The Asia-Pacific Network for Global Change Research project, “Moving to Remain in Place: Micro-mobilities and circular migration as adaptive strategies to gendered climate risks in Fiji and Samoa (CRRP2023-02MY-Neef)”, sets out to better understand small-scale and short-term mobility in climate-affected communities in Fiji and Samoa. Rather than focusing on large-scale displacement or permanent relocation, we explored the more everyday movements that households and individuals practice to adapt and build resilience. Working closely with communities, we asked how short-distance and circular mobilities might help people remain in place, even as climate risks grow.
To do this, we used three interactive and largely visual methods: mobility mapping, causal loop diagramming and photovoice. These tools opened spaces for collaborative knowledge-making and allowed participants to reflect on lived experience in grounded, often unexpected ways. The visual format helped illuminate local understandings of risk, movement and adaptation, and suggested solutions that are not always visible to outside researchers and policymakers.
In December 2024, the research teams from Fiji, Samoa, Australia and Aotearoa New Zealand assembled for a workshop at the University of Otago in Dunedin, Aotearoa New Zealand, to reflect on the challenges and successes of these visual research methodologies. We had a follow-up meeting a year later at a writing retreat at Griffith University, Brisbane, to revise and validate our reflections on the methods employed. A quick preview of what we found is that the success of these methods depends not only on the tools themselves, but on how they are used. When adapted with care and driven by Indigenous Pacific modes of conversation and engagement (broadly glossed in Fiji and Samoa as Talanoa), these methods offer more than data. They also support community reflection, spark collective ideas and help shape more responsive and locally meaningful adaptation policies. The following sections describe our experiences with each of the visual methodologies in turn.
Mobility maps
Talanoa sessions solicited mobility maps (Figure 1), which provide an understanding of when and why people move to specific places, whether they are aware of other places they could go to, and which adaptation measures they might use as an alternative to mobility. Mobility maps help explain why some groups and individuals are more mobile than others, and how the mobility of some groups and individuals affect the mobility or immobility of other groups and individuals. For instance, one hypothesis our project investigated is whether able-bodied, young men are more mobile than women, particularly as they participate in overseas seasonal work schemes, which leaves mothers with young children, the elderly and people with disabilities behind, confined to immobility for extended periods of time. On the other hand, remittances sent home by seasonal workers may help less mobile family members invest in climate adaptation strategies, such as building a second home or extending farmland.
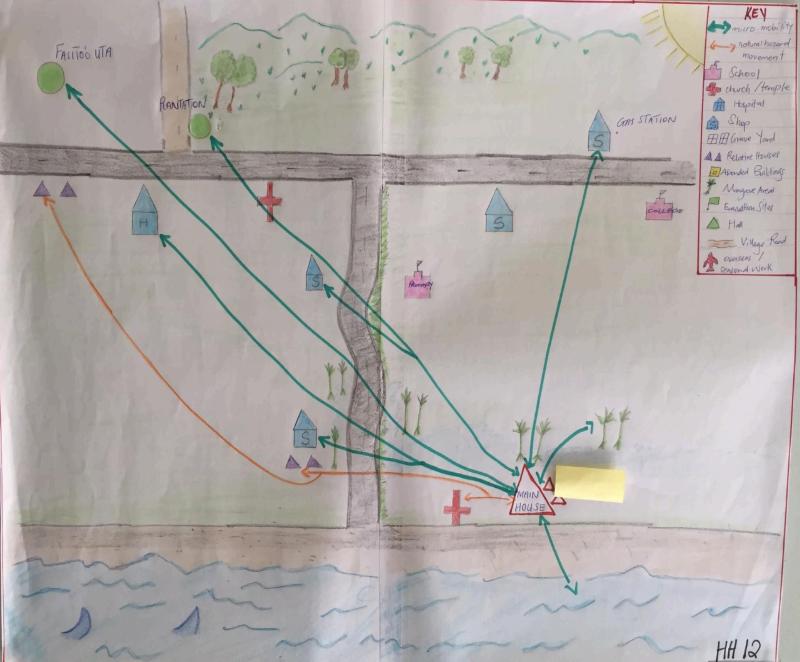
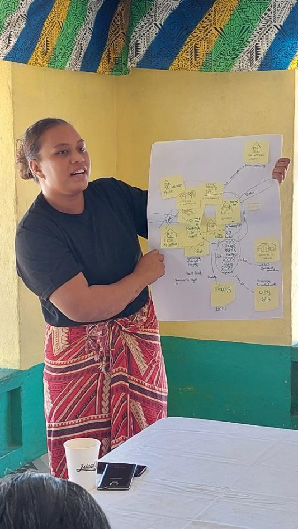
Mobility maps proved to be the most popular and frequently used method because it provided autonomy to participants to narrate their own mobility experiences. With minimal prompting, participants were able to guide the conversation, allowing for a more natural and participant-led flow of information. Research teams encouraged participants to draw their own diagrams, which not only facilitated deeper engagement but was also described as the most enjoyable activity. Mobility maps are more inclusive and flexible, yielding richer and more relevant information than standard interviews. Through drawing-led discussions, research teams could elicit critical spatial information such as proximity to nearby facilities and services, distance from the sea, most important destinations and frequencies of travel to each location. Participants expressed surprise and delight once the maps and conversations revealed overall patterns of their own mobility (Figure 2). In these cases, mobility maps had an enlightening and empowering element.
When reflecting on the use of mobility maps, several researchers on the team offered caveats. First, draft mobility maps were hard to read or disorganised and often required revision or even redrawing them by the researcher to add more detail, but researchers were mindful that doing this risked inadvertently introducing researcher bias into the maps. Meanwhile, some participants have better drawing skills, better recall of their mobility patterns, or simply more confidence to draw with the researchers, while others demurred or insisted that researchers use their (presumed superior) skills to draw mobility maps for them. Researchers found these skills, or willingness to draw, varied by age, and this too introduces a kind of respondent bias that features the more willing and more skilled participants. Finally, this method can lead to the oversimplification of movement patterns, as it may not fully capture the complex and multifaceted reasons behind people’s movements. Therefore, it is essential to allocate adequate time and care to the creation of these diagrams to ensure a more accurate representation of the data.
Causal loop diagramming
Talanoa sessions also solicited causal loop diagrams (CLD) to visualise climatic and non-climatic drivers of mobility. The CLD method invites session participants to draw long-term cause-effect-response relationships associated with climate impacts as well as various environmental, social, cultural and economic changes. CLDs can be an effective tool for analysing complex systems and identifying feedback loops that amplify or dampen the effects of different drivers. The visualisation of these loops helps participants and researchers alike to gain a better understanding of the underlying mechanisms that drive mobility patterns and how they evolve over time.
Here we share the Fiji team’s experience with CLDs, which began with village head consultations to identify the five main social groups for conducting Talanoa sessions. Generating CLDs were exercises in trial and customisation from one social group to the next. After each session, the research team identified the strengths and weaknesses of their approach, then made adjustments for the next CLD exercise. Importantly, adjustments are not in service of perfecting the CLD method for general application, but toward accommodating unique village contexts and variabilities of each social group.
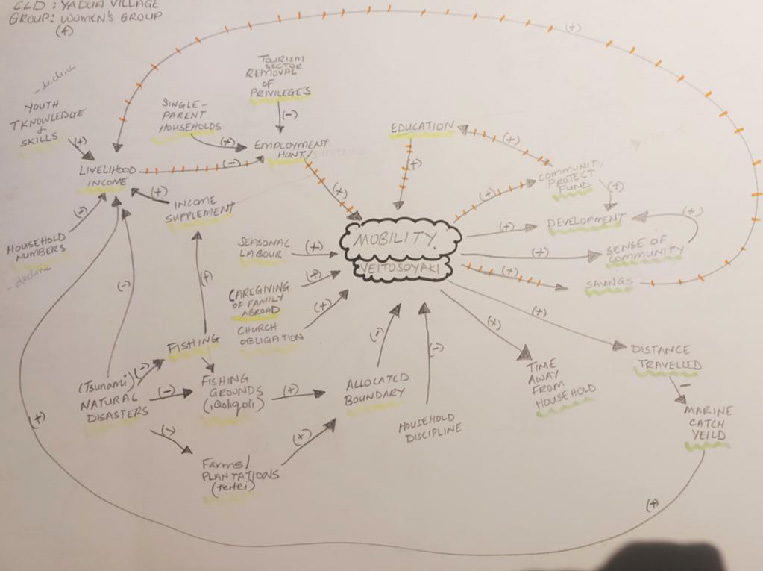
The women in Yadua village in southern Viti Levu produced one of the most detailed CLDs (Figure 3). They highlighted multiple variables that linked climate change, the environment, and the mobility of people. An important part of this process was, first, finding out how participants perceive their movements and, second, how they visualised the loops and variables.
Another session with youths proved to be very different. During the first iteration of drawing a CLD, the youth participants felt they could better describe the mobility of other people in their household as opposed to their own. After completing the diagram and explaining what we had developed together, they were better able to understand the purpose of the activity and then engage in the activity again to showcase their own mobility within the village. In both instances, the approach to creating a CLD had to be repeated or revised for participants to better represent their views, and to help us and our participants get a better understanding of the approach to developing the CLD.
As the experience in Fiji shows, producing a valid and meaningful CLD requires time and deliberation, and the Samoan team’s experience provides an important caveat. Due to time limitations in trying to solicit CLDs from multiple households, one team found it easier to record conversations with a household and then produce the diagram off-site. Drawing, or re-drawing, CLDs after the Talanoa sessions allowed researchers to add clarifying details and produce cleaner visualisations. The results still proved valuable, as the team learned that drivers of micro-mobility might be hastily ascribed to climate change but through more careful CLD discussions, they learned that other drivers such as disputes over land among extended family networks are sometimes more proximate causes of relocation.
Photovoice
Photovoice is an interactive research method in which participants take photographs to document their lived experiences, followed by reflective discussions that generate insights into personal and collective meanings. It can encourage the co-creation of knowledge by using visual storytelling from the perspectives of participants that might be overlooked in conventional research methods. We decided to include photovoice as one of the visual methods employed in this research because it has the potential to capture the everyday impacts and solutions related to climatic and environmental changes. It also enables participants to express how climate-related stressors affect their decisions about movement or staying put, often highlighting emotional, place-based, or culturally specific dimensions of mobility that might otherwise be missed. The photovoice method was a late entry into the project plan and was therefore applied unevenly across our field sites. One master’s student made it the sole focus of their project (Figure 4), one team used photovoice with children only to supplement the other research methods, and others employed photovoice for the first time and saw it as a learning opportunity.
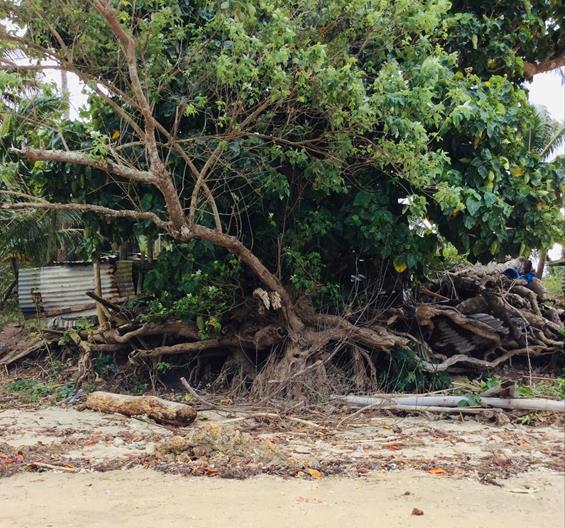
One major learning from the Fiji team’s use of the photovoice method was to introduce more specific prompts for research participants. At first, participants produced generic images that reproduced well-known examples of climate change impacts, such as coastal erosion (Figure 5), with less emphasis on individual participant stories or possible solutions.
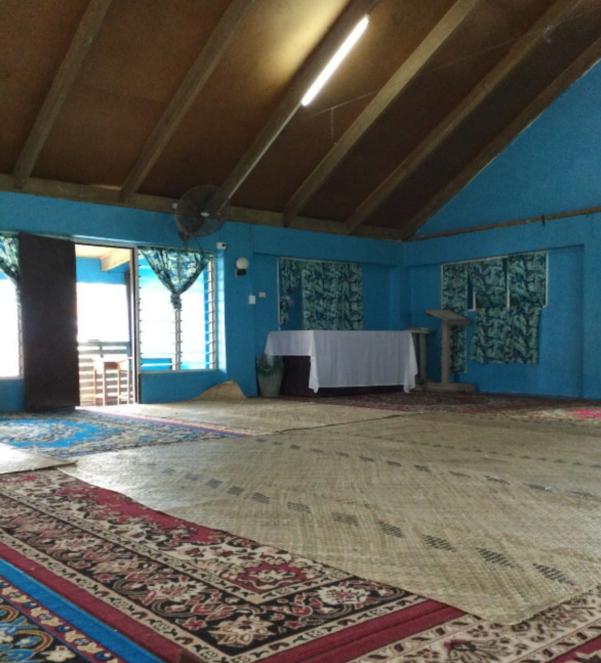
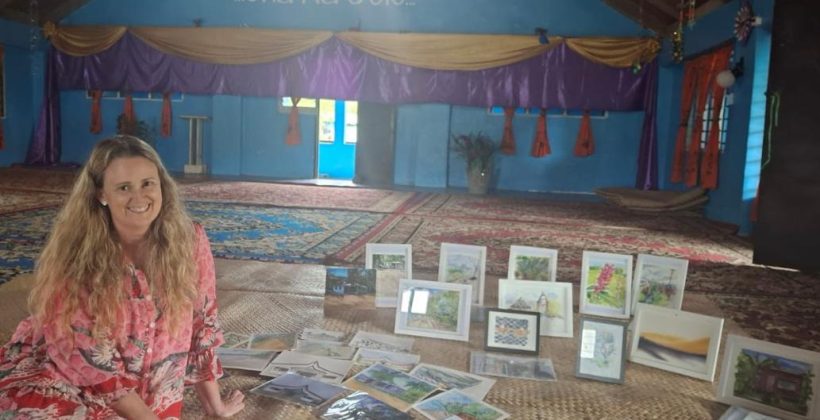
Over two rounds of employing this method, both researchers and participants figured out the artistic potential of photovoice for building community solidarity and greater climate change awareness, for example through a display of photos and artwork in community halls (Figure 6).
Conclusions: Listening, learning and adapting our methods
Each of the three methods discussed here shared a strong visual component, helping to surface ideas, relationships and experiences that might have remained unspoken. The visual nature of the tools supported both reflection and storytelling, inviting participants to engage in ways that were intuitive, collaborative and rooted in place. These preliminary considerations of the visual methods we used to improve understanding of climate micro-mobilities and circular migration in Fiji and Samoa showed us that the positionality of the researchers influenced how each method was used and what results emerged. Furthermore, the application of methods designed elsewhere only worked when guided by Indigenous approaches, especially those grounded in Talanoa-like practices. As one member of the research team put it, “Talanoa was the oars that propelled the participants to a deeper understanding of the research.” For each of these methods, another researcher emphasised, “Talanoa was wrapped around it.” Following best practices in Indigenous research has been key to the project’s success. Time also mattered. More time allowed for iteration, reflection and adaptation. In Yadua, for example, women used the CLD and mobility mapping to propose a community fund that would support temporary relocation to evacuation centres during disasters. The work did not just gather insights from participants; it helped spark local ideas for improving resilience. In that sense, the sails were adjusted. We learned with participants and from the process itself. Our team now believes that repeating the process with more time could lead to stronger, more refined results, as evidenced by the second round of photovoice work in Fiji. These reflections help us think about what comes next with increased confidence in the validity of our findings, both for this project and for others like it.
Key messages and recommendations
- Visual methods have long been used to study various dimensions of migration and im/mobility and, more recently, climate change adaptation and resilience in separate fields of inquiry.
- This Perspectives article underscores the value of combining various visual methods to illuminate how people interpret and give meaning to their everyday experiences in ways that verbal or numerical data alone cannot. By illustrating their perspectives through photographs, drawings and mapping, participants make visible the spatial, relational and symbolic dimensions of climate im/mobilities.
- The use of visual methods includes interactive and participatory components, in which research participants are invited to co-create knowledge alongside each other and researchers. These participatory processes are able to surface a diversity of perspectives and enable participants to articulate their priorities, concerns, and lived realities such that interpretive authority within the research is distributed.
- We argue that visual methods produce policy-relevant knowledge. They generate evidence that is aligned with how communities experience climate impacts and adaptation pressures; such insights are actionable for policymakers, as they shape interventions to be contextually grounded and reflective of lived conditions rather than abstract assumptions.
