The Case of Shanghai
Summary
For the full paper: LCD05-Jupesta and project details |

Authors: Dr. Joni Jupesta, The United Nations University Institute for the Advanced Study of Sustainability (UNU-IAS), Japan; Dr. Ping Jiang, Department of Environmental Science & Engineering, Fudan University, China; Ms. Takako Wakiyama, Institute for Global Environmental Strategies (IGES), Japan.
In China, the building sector is one of the biggest sectors that consumes large amounts of energy. Green buildings produce a variety of external benefits in their life cycles, including energy and water savings, pollution reduction, indoor and outdoor environmental improvement, among others. However, developers are reluctant to provide all these external benefits due to the consideration of incremental costs, making the green building sector a less attractive market.
Shanghai is the first city in China to have implemented the Green Standards, and the first “green building label” was awarded to a building in Shanghai in 2008. Between 2008 and 2013, a total of 94 green building labels were issued.
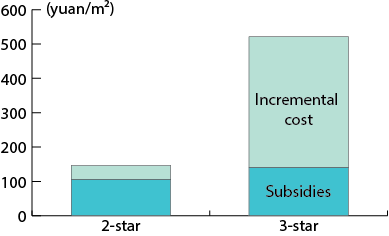
In Shanghai, the total subsidies for two- and three-star green buildings amount to 105 yuan/m2 and 140 yuan/m2 respectively, thanks to a uniform subsidy of 60 yuan/m2 provided by the municipal government in accordance with a policy titled “Supporting the Building Energy-saving Projects in Shanghai”, in addition to state subsidies of 45 yuan/ m2 for two-star green buildings and 80 yuan/m2 for three-star green buildings. This study found that real incremental costs of green buildings in Shanghai are 41 yuan/ m2 and 381 yuan/m2, respectively for two- and three-star green buildings and, therefore, the total subsidies are sufficient to cover the incremental cost of two-star green buildings, but insufficient for three-star ones. A comparison between subsidies and incremental costs for Shanghai is presented in Figure 1.
Policy Implications
|
Recommendations
|
The Case of Yokohama
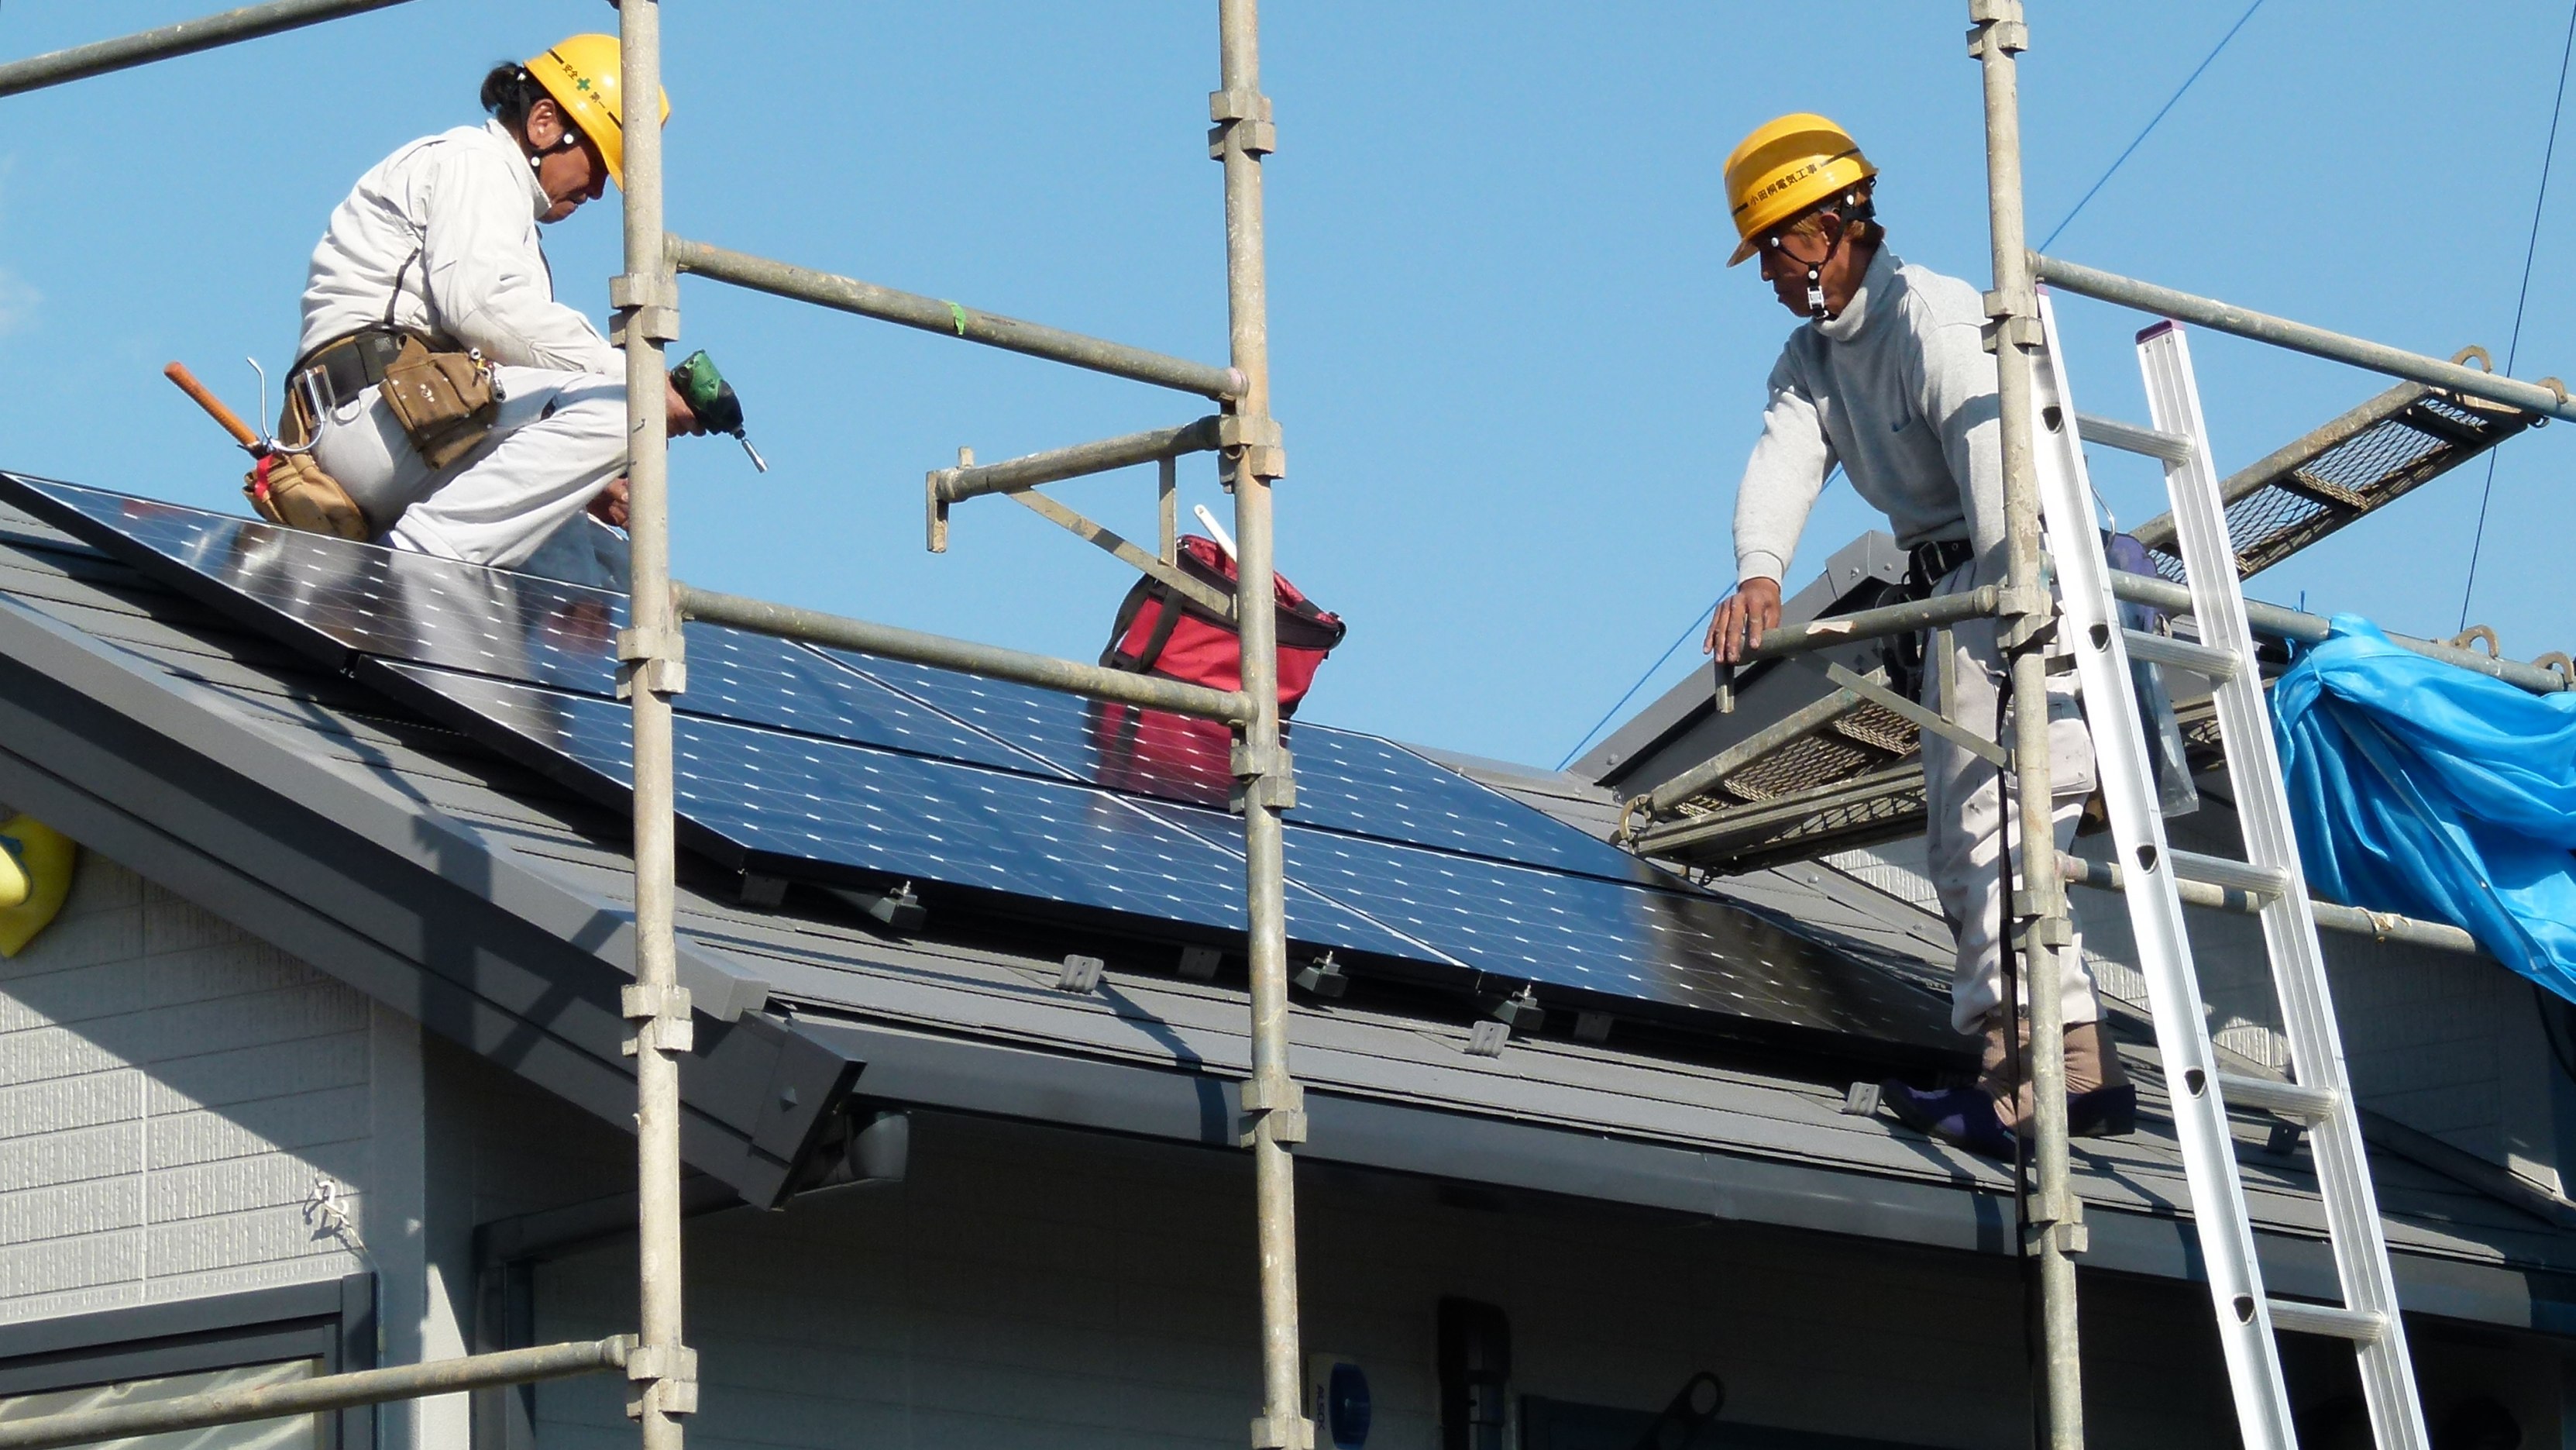
Compared with investing in conventional energy sources, investment in renewable energy presents multiple risks and challenges in economic, social, political and geological realms. A reformed electricity market, innovative financing schemes and further low carbon policies are crucial for mitigating the risks and increasing the attractiveness of renewable energy investment, which will help address these challenges and promote renewable energy supply. In Japan, a Feed-in Tariff (FIT) system was introduced in 2012 after the Fukushima nuclear plant incident to accelerate the use of renewable energy. Following the introduction of FIT, the installed capacity of solar PV increased to 11.857 GW in two years from July 2012 to July 2014.
This study found that risks exist in the current FIT system in Japan. Price of renewable technology is still expensive in Japan to replace the conventional energy system. Problems of the current FIT system emerged in 2014 with the rapid increase of installed capacity of solar PV. Enhancement of grid system is needed to increase future renewable energy operations. These include the widening gap between maximum electricity demand and the increasing installed capacity of renewable energy at the regional level. Taking Kyushu Electric Power Company as an example: Although the maximum electricity demand of the company was 16.71 GW, the approved installed capacity of renewable energy reached 17.55 GW in March 2014, well above the company’s maximum demand. This is also linked with the supply balance of renewable energy and nuclear power, and related cost performance issues.
Policy Implications and Recommendations
|
The Case of Jakarta
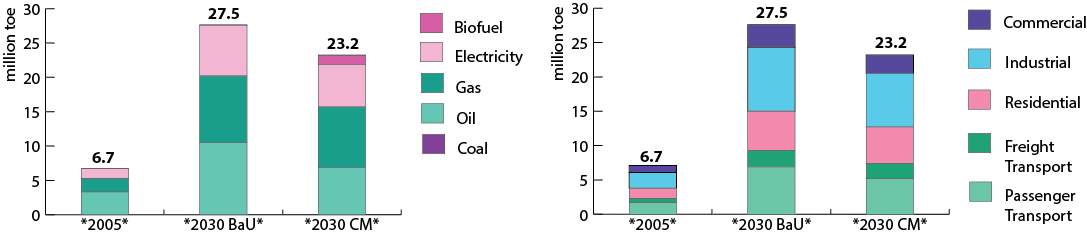
A modelling study was conducted to identify options of GHG mitigation action for the energy sector of the Special Capital City District (DKI) of Jakarta to achieve “Low Carbon City in 2030”. Figure 2 shows a summary of the results of an Extended Snapshot Tool (ExSS) modelling simulation, showing snapshots of energy supply and demand for the base year (2005) and target year (2030) under two scenarios: business as usual (BaU) and mitigation (CM). The snapshot of final energy demand in DKI Jakarta shows that under the BaU scenario the final energy demand during the period 2005–2030 is estimated to increase by a factor of 4.1 from 6.67 Mtoe (5.5% of total energy consumption of Indonesia) to 27.54 Mtoe, while the primary energy supply during 2005–2030 will increase from 11.29 Mtoe to 49.2 Mtoe. Under the CM scenario in the same period, the demand is estimated to increase by 3.5 times from 6.67 Mtoe to 23.33 Mtoe while the primary energy supply mix will increase from 11.3 Mtoe to 41.53 Mtoe.
Policy Implications and Recommendations
|
| This policy brief is developed for APN project “Low Carbon Urban Infrastructure Investment: Cases of China, Indonesia, and Japan” (LCI2012-05NMY(R)-Jupesta; LCI2013- 05CMY(R)-Jupesta) under APN’s Low Carbon Initiatives Framework. This brief is also published as a part of the book: Jupesta, J., Wakiyama, T. (2015). Low Carbon Urban Infrastructure Investment in Asian Cities, Palgrave Macmillan Publisher.For full details of this project, including technical reports and other outputs, please visit the project metadata page. |