Strengthening adaptive capacities of small holding South Asian agrarian community through Climate Information Network -based decision support tool
Keywords
Climate Information Network (CIN) · Coupled Model Intercomparison Project Phase 5 (CMIP5) · Crop calendar · Decision Making Cropping Support System · Global Circulation Model (GCM) · Participatory Action Research (PAR) · Representative Concentration Pathway (RCP)
Highlights
- Long-term climate anomaly prediction and PAR (Participatory Action Research) based on existing crop practices and available climate information were made on two extremely climate-vulnerable locations in the Indian subcontinent of Purulia (India) and Shyamnagar (Bangladesh).
- Long-term climate anomaly prediction was made based on CMIP5 scenarios and RCP 4.5 projections.
- Alternative crop calendar, crop and cropping practices were developed based on probable climate emergencies.
- DMCSS involving crop, climate, contrivances and contingency (4C) has been developed as an Android based bot and field validated.
1. Introduction
Climate change is causing seasonal shifts resulting in various anomalies related to temperature, rainfall pattern and the number of dry and wet spells. These and other visible increments in extreme events have adversely impacted cropping patterns and crop productivity (Crane, Roncoli, & Hoogenboom, 2011). Climate change has triggered weather anomalies that can significantly impede achieving zero hunger sustainable development goals (UNDESA, n. d.; UNICEF, 2021). A widespread increase in high-temperature events in India has been highlighted, and thirty-fold higher than 2°C warming is predicted (Mishra, Mukherjee, Kumar, & Stone, 2017). Increased days with higher temperatures may decrease production by creating physiological stress on plants and causing sterility (Wang et al., 2020). Adaptation is the adjustment in natural or human systems in response to actual or expected climatic stimuli or their effects, which moderates harm or exploits beneficial opportunities (Parry, Canziani, Palutikof, & Linden, 2007). The potential impacts of climate change on agroecological systems have been addressed by various models (Hein, Metzger, & Leemans, 2009; Lahsen, 2005; Olson et al., 2008; Thornton, Jones, Alagarswamy, Andresen, & Herrero, 2010). Modelled climate practice scenarios often ignore farmers’ adaptive capacities to climate trends in both the short- and long-term (Crane et al., 2011). Richards (1989, 2002) has emphasised that farmers’ improvisational capacities are key elements in formulating agriculture performance. However, climate change impacts and risks are becoming increasingly complex and more difficult to manage (Pörtner et al., 2022). In this situation, integrated, multi-sectored solutions that address social inequities and differentiate responses based on climate risk and local situations may enhance food security and nutrition (Pörtner et al., 2022). The science of forecasting has emerged as “the key technology for visualising and anticipating the processes and impacts of climate change and climate variability on agricultural production systems” (Crane et al., 2011). The accuracy of these climate predictions is, however, limited by fundamental, irreducible uncertainties (Dessai, Hulme, Lempert, & Pielke, 2009). Prediction is only useful for farmers if the forecast is reliable and the uncertainty is understood (Mall, Bhatt, Sonkar, & Banerjee, 2014).
The weather prediction-based approach for advancing agriculture has been well implemented in developing countries. To the best of our knowledge, a climate-based approach for the long-term improvement of cropping patterns has been significantly overlooked. The major differences between weather-based and climate-based approaches are that weather-based approaches focus on improving short-term water usage efficiency in agricultural fields. In contrast, climate-based approaches focus on the low-risk selection of crops and varieties for long-term improved productivity. The weather-based agro-decision-making system depends upon numerical simulation of Weather Research and Forecasting (WRF) models at a high-resolution scale for five to seven days of forecasting using meteorological data from ground-based weather stations. The advantages include sowing/transplanting time selection during monsoonal crops, irrigation advisory at the critical plant growth time, and fertiliser application based on wind and rain-predicted conditions. On the other hand, the climate-based approach uses CMIP5 outputs that are statistically downscaled for a higher spatial resolution to predict the best possible future climatic conditions over an area. Outputs from the climate-based approach can be directly used to formulate strategies and decision-support tools for farmers through a micro-level crop calendar incorporating agricultural, economic and climate data.
A crop calendar tool has been developed to assist farming communities and stakeholders in facilitating the availability of quality seeds of specific crop varieties based on agroecological zone and climate conditions and can serve as an adaptive tool against changing weather patterns (FAO, n.d.). Business as usual cropping and crop calendar does not incorporate scientific adaptive measures. Adjusting crop calendars may present an effective adaptation measure to avoid crop yield loss and reduce water use in a changing climate (Wang et al., 2022), especially in rain-fed agrarian systems. Place-based and micro-level crop calendar is vital in assisting marginal farmers to adapt to changing climatic conditions with better and resilient crop and cropping practices. Adger, Huq, Brown, Conway, and Hulme (2003) and (Kurukulasuriya et al., 2006) stated that adaptation is one of the policy options for reducing the negative impacts of climate change, while Mendelsohn, Nordhaus, and Shaw (1994) noted that farmers will be especially hard hit if they do not adjust to new climates. Including agro-meteorological information networking in planning for crop calendars over time and space is necessary. It is also essential to document the change and resilience of local marginal farmers on which their adaptive capacities need to be built. The present study has been undertaken to develop a Decision Making Cropping Support System (DMCSS) for climate vulnerability in Purulia, India and Shyamnagar, Bangladesh. This would act as a climate information network (CIN) based real-time contingency planning (RTCP) system. A system such as DMCSS can be a critical policy tool for ensuring food security and livelihood augmentation in the climate milieu in the Global South.
1.1 Objectives of the Study
1. Prepare Crop Inventory of Project Locality – contrivances, traditional practices and resource inputs
2. Undertake Participatory Action Research (PAR) at the grassroots level and long-term climate anomaly prediction based on global circulation models (GCMs) to develop a micro-level CIN-based Android based bot crop advisory system
3. Validate the crop calendar with at least two cropping cycles (Monsoon & Winter) to develop a decision support system for rain-fed agro-farming
4. Undertake capacity building of marginal farmers on the use of a CIN-based decision-making cropping support system using the Android based bot.
2. Methodology
2.1 Climate Information Network (CIN)
A Climate Information Network (CIN) has been established through an APN-funded cross-country collaborative project over Purulia, West Bengal, India (23.3N, 86.4E) and Shyamnagar, Bangladesh (22.3N, 89.1E) for the improvement of climate literacy among marginal farmers. Purulia is extremely arid and receives minimum rainfall, whereas Shyamnagar is located on the edge of the Bay of Bengal and is affected by climate extremes. The study collected meteorological data from various sources spanning 1960 to 2019, compared them with multiple GCM models and data from the IPCC Fifth Assessment Report (AR5), and identified the most appropriate model output for the study areas. Future projections were taken from the best-fit model output.
Past weather data was gathered from the following sources: (1) The gridded Climatic Research Unit (CRU) TS (time-series) 3.21 (CRU-TS3.21) monthly datasets with a resolution of 0.50×0.50 covering the period 1901-2012 prepared by CRU at the University of East Anglia (Harris, Jones, Osborn, & Lister, 2014); (2) Global Precipitation Climatology Centre (GPCC) V6.0 and a reanalysis of monthly land-surface rainfall data set with a temporal span of 110 years from 1901-2010 at a resolution of 0.50×0.50 (Schneider, Fuchs, Meyer-Christoffer, & Rudolf, 2008); (3) WorldClim version 2.1 monthly climate data for minimum, mean and maximum temperature, precipitation, solar radiation, wind speed, water vapour pressure, and for total precipitation gathered with climate data from 1970-2000 (Fick & Hijmans, 2017); and (4) Terra Climate, which is a dataset of monthly climate and climatic water balance for global terrestrial surfaces from1958-2019 (Abatzoglou, Dobrowski, Parks, & Hegewisch, 2018).
Forty-two GCMs from Coupled Model Intercomparison Project Phase 5 (CMIP5) were used for the present work and are among the group of GCMs outlined in the IPCC AR5 (, 2014) having monthly precipitation records from 1860-2100 in its experimental ‘run-1’. The CMIP5 products are freely available at http://www.knmi.nl/. The GCMs used in the present study were also used by IPCC AR5 working group (WG) I and WGII (Field & Barros, 2014). The GCMs’ performance was assessed by dividing the simulation period into two parts: 1960-2019 for evaluating the models and 2006-2100 for constructing future climate change scenario information. The 42 GCMs’ performance was evaluated against observational data through rigorous statistical analysis. The best-performing models were selected for the prediction of future scenarios. For preparing future projections, RCP 4.5 was used.
The term climatic water deficit is quantified as the amount of water by which potential evapotranspiration (PET) exceeds actual evapotranspiration (AET) (Lutz, Wagtendonk, & Franklin, 2010). This term effectively integrates the combined effects of solar radiation, evapotranspiration, and air temperature on watershed conditions, given available soil moisture derived from precipitation. The Palmer Drought Severity Index (PDSI) (Palmer, 1965) uses readily available temperature and precipitation data to estimate relative dryness. It is a standardised index that generally spans from -10 (dry) to +10 (wet).
2.2 Participatory action research
Questionnaire-based stakeholder feedback was generated through an online system by utilising Survey Monkey. Crop calendars were developed based on PAR involving 4C (crop, climate, contrivances, contingency) and engaging farmer groups through PRA (Participatory Rural Appraisal). Contingency crop planning was undertaken according to (Banerjee et al., 2019) and National Innovation in Climate Resilient Agriculture (NICRA).
An MS Excel-based gradation system of preparation level of farmers (>75%=A, 60-74%=B, 50-59%=C and <50%=D) was developed where higher grades or higher percentages signify higher resilience and lower risk. Here the farmers are categorised into various groups based on their available resources like land elevation, soil condition, tillage, water availability or irrigation, finance, land area, labour, market availability, seeds and fertilisers, among others. Based on preparedness or resource availability, the score range was established as 0-5, where 0 signifies the lowest score and 5 the highest regarding preparedness and resilience. By this logic, one (farmer or user) must accumulate a minimum score of 75% or more of the total cumulative score possible to qualify as grade A. Some standard logic sets were set up in the framework to arrive at the right score for a particular input. Farmers who adhered to agroecological practices such as minimal or zero tillage, utilisation of animal power in tillage, preservation of indigenous seed banks, reduced water waste in fields, and the use of natural ingredients for fertilizers and pesticides achieved significantly higher scores compared to farmers who transitioned to more equipment-based intensive farming. Similarly, lack of financial strength, non-availability of public or private credit, greater distance from the market, and consistently maintaining fallow land, among others, were designated lower scores in the 0-5 range. Then, decisions on the crop (grain, vegetable and pulses) and contingency suggestions are provided based on (1) the final accumulated grade of the farmer; (2) the sowing season, i.e., monsoon (Kharif) or winter (Rabi); and (3) rainfall pattern (normal, less than 75% or excessive).
2.3 Preparation of conditions based crop suggestion in the form of “Android based bot”
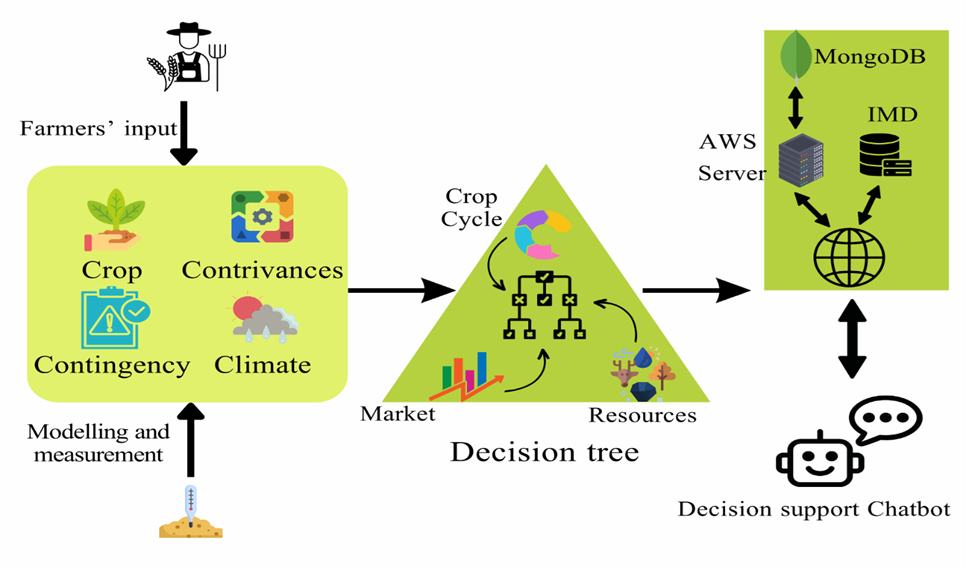
A cloud computing Android based bot was developed using a Gradation Based Cropping and Contingency Suggestion framework. The bot uses Android software development kit (SDK) Version 21 with Android 5.0 — A Lollipop software system, utilising NodeJs and MongoDB server, is designed to generate tailored outputs based on various inputs, including geolocation, weather, land and soil conditions, available resources and equipment, market and economic conditions. A flow chart of the system’s functionality is given below (Figure 1).
The Android based bot was field validated with farmers at locations during different crop cycles and fined tuned accordingly.
3. Results
3.1 Climate information
3.1.1 Purulia: Historical pattern
The historical weather pattern for Purulia indicates the aridness of the region. The yearly maximum temperature has regularly reached 40°C during the summer months since the 1960s (Fig. S1, Supplementary Material-Appendix 3). The annual temperature minimum always stays above 22°C. During winter (December-February), the minimum temperature remains at ~12°C and reaches ~42°C during summer (March-May). It is also clearly evident that the minimum and maximum temperature gradually increases over Purulia. The annual average rainfall for the study period 1960-2019 was 1267±182 mm, with a range varying from a maximum of 1920 mm to a minimum of 854 mm (Fig. S1, Supplementary Material-Appendix 3). Around 60% of the years, annual rainfall deficiency was observed during the study period and the skewness of the frequency distribution of annual rainfall inclined towards the left. Very high solar radiation (216±40 watt m-2) over the study area indicates scorching heat and aridness (Fig. S1, Supplementary Material-Appendix 3). No significant trend was observed in solar radiation and wind speed during the entire study period.
3.1.2 Purulia: Precipitation and temperature anomaly
The precipitation and temperature anomalies were calculated for the last two decades (2000–2019) considering a baseline of 1958–1970 and represented in Fig. S2, Supplementary Material-Appendix 3. 55% of the time, rainfall deficiency was observed and 45% of the time, annual rainfall was found to be surplus. The decadal rainfall was analysed and no significant changes in decadal rainfall were observed. However, a significant error in the box plot for individual decades (25-75 percentile) indicates year-wise high variability. A significant positive trend was found while plotting the decadal variability as a function of rainfall anomaly, and it was observed that the variability increased during the last couple of decades. It was observed that positive temperature anomalies exist for both maximum and minimum temperatures considering the baseline from 1958-1970 (Fig. S2, Supplementary Material-Appendix 3). It was found that the rate of increment for temperature minima was higher compared to temperature maxima.
The month-wise maximum temperature anomaly for the last decade (2010-2019) computed with respect to the 1958-1970 baseline is represented in Fig. S3 (Supplementary Material-Appendix 3). It reflects hotter summer and winter months compared to historical climatic patterns. The 70% positive climatic water deficit anomaly value in the last two decades for Purulia indicates drought-prone increments over the region. The PDSI values over Purulia specify that the region has been suffering from prolonged drought since the 1960s and becoming more regular and repetitive (Fig S3, Supplementary Material-Appendix 3).
3.1.3 Purulia: Future prediction and agronomic significance
The future projection of temperature for Purulia has been given in Fig. S9, Supplementary Material-Appendix 3. The projection indicates increments during both the summer and winter months. During the end of the upcoming decades, a certain probability exists to lower the mean temperature slightly. The maximum temperature during winter has been calculated and plotted as a histogram. It could be observed that the median range of maximum temperature increment is 1.5-2°C. The projection suggests that the monsoonal precipitation will increase during July and decrease during August. Winter precipitation will decrease in the upcoming decades (Fig. S9, Supplementary Material-Appendix 3). There is an expected increase in the frequency of flash flood events and longer periods of drought in the coming decades. During the decade’s end, a significant monsoonal precipitation decrement is expected. Severe drought events might be observed during non-monsoonal months. Irrigation-dependent agriculture or low-water-consuming crops need to be promoted. Winter varieties might be highly affected as winter temperatures will increase. Increasing the number of flash floods will also elevate nutrition run-off from the soil.
3.1.4 Shyamnagar: Historical pattern
Compared to Purulia, the temperature over Shyamnagar is stable and less extreme (Fig. S4, Supplementary Material-Appendix 3). However, the minimum and maximum temperatures gradually increase over Shyamnagar, and the increment rate of minimum temperature is five-fold higher compared to the maximum temperature. Very high solar radiation (203±28 watt m-2) was observed. However, unlike Purulia, substantial monthly variation was observed. Due to close proximity to the sea and convection activity during summer months, wind speed is much more elevated in Shyamnagar (3.6±0.3 m s-1) compared to Purulia (Fig. S4, Supplementary Material-Appendix 3).
3.1.5 Shyamnagar: Precipitation and temperature anomaly
The precipitation anomaly was calculated for the last two decades (2000-2019) considering a baseline of 1958-1970 and represented in Fig. S6, Supplementary Material-Appendix 3. During the monsoon season, the anomaly was found to be more skewed towards the deficit, which implies that precipitation extremes have been higher over Shyamnagar compared to Purulia in recent times.
The decadal precipitation (1960-2019) has been plotted along with temperature anomalies over Shyamnagar (Fig. S6, Supplementary Material-Appendix 3). The quantile and central tendency for precipitation in recent decades is considerably lower compared to previous decades. It can be observed that, especially during the last decade, both maximum and minimum temperatures increased compared to historical climatic patterns, but temperature minima increases were higher compared to temperature maxima.
Two drought indices, climate water deficit anomaly and Palmer drought sensitivity index, are presented in Fig. S7 (Supplementary Material-Appendix 3). High precipitation and proximity to the sea help to overcome the climate water deficit over Shyamnagar. The Palmer drought sensitivity index also indicates that the impact of drought has been relatively low in the last decade.
3.1.6 Shyamnagar: Future prediction and agronomic significance
Both minimum and maximum temperature in Shyamnagar is expected to increase during the upcoming decades compared to the last decades (Fig. S10, Supplementary Material-Appendix 3). Dry spells will increase significantly, and up to an eight-to-nine-day increment in break-spell is expected compared to previous decades. An overall increment in monsoonal rainfall is expected in Shyamnagar (Fig. S11, Supplementary Material-Appendix 3). Similarly, the frequency of extreme precipitation events is expected to rise in comparison to previous decades, and there will be a gradual increase in the occurrence of warm spells. Precipitation extremes such as drought and flood are expected in the next decade.
It can be predicted that saltwater inundation and extreme cyclonic risk aggravate the difficulties of agrarian livelihoods in Shyamnagar. Low-water-consuming crops or salt-tolerant varieties need to be promoted. Conservation of rainwater and incorporating micro-irrigation may help reduce the dry physiological condition.
3.2 Stakeholder feedback
Significant numbers (85%) of stakeholders (n=85) were in favour of such an android mobile-based decision-making tool. In the climate milieu, real-time contingency planning in the form of an Android based bot which disburses implementable suggestions, including resilient crops, cropping techniques, risks etc., can be extremely critical in securing food and livelihoods. Fifteen percent of those surveyed were of the opinion that such a system would not be able to provide implementable adaptive measures if accurate information on local soil, weather and market trends were not available. The majority of respondents have opined that the most visible effect of climate change on agricultural farming systems is on two fronts: water scarcity and productivity. While this has been asked what would be the most niche-specific and pertinent ways to deal with the problem, the majority of answers hover over watershed management and the promotion of sustainable farming practices (Fig. S12 and Fig. S13, Supplementary Material-Appendix 3).
3.3 Crop Calendar
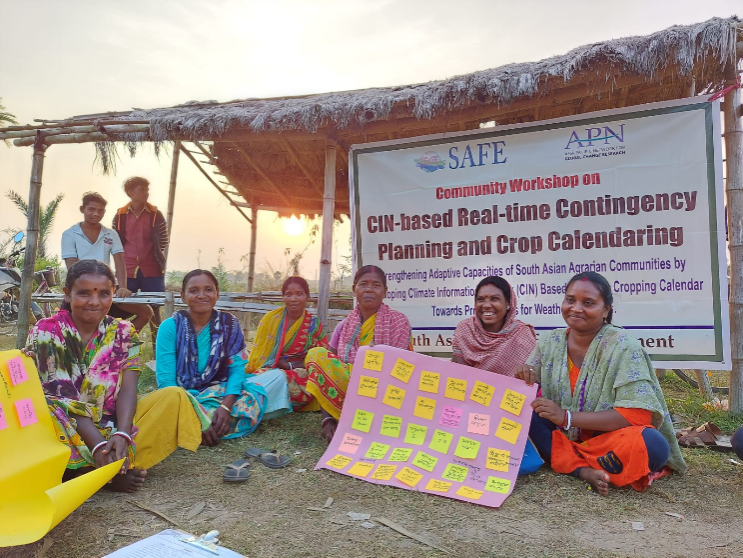
An alternative crop calendar (Supplementary Material-Appendix 1), including contingency management and recommendations, has been developed by involving farmer groups through PRA (Figure 2). The crop calendar includes average meteorological data, including monthly maximum and minimum temperature, monthly rainfall (mm), rainy days, relative humidity (RH%), solar days, among others. The CIN information has been included in the form of expected variations in rainfall and temperature regimes. Both common and alternative local crops are suggested, with probable days of sowing and harvesting. The management of pests and diseases should be conducted using natural and chemical-free methods, along with contingency plans to handle climate extremes.
The grade of preparation level of the farmer is based on real-time input of land/soil type, tillage, water and irrigation, finance, land availability, seeds, fertiliser, labour and market availability, and has been developed for both locations together with suitable contingency planning based on (1) crop season; (2) real-time weather conditions like normal or excessive rainfall, dry spell or drought; and (3) stage of cropping (Supplementary Material -Appendix 2).
3.4 Crop suggestions by the Android based bot
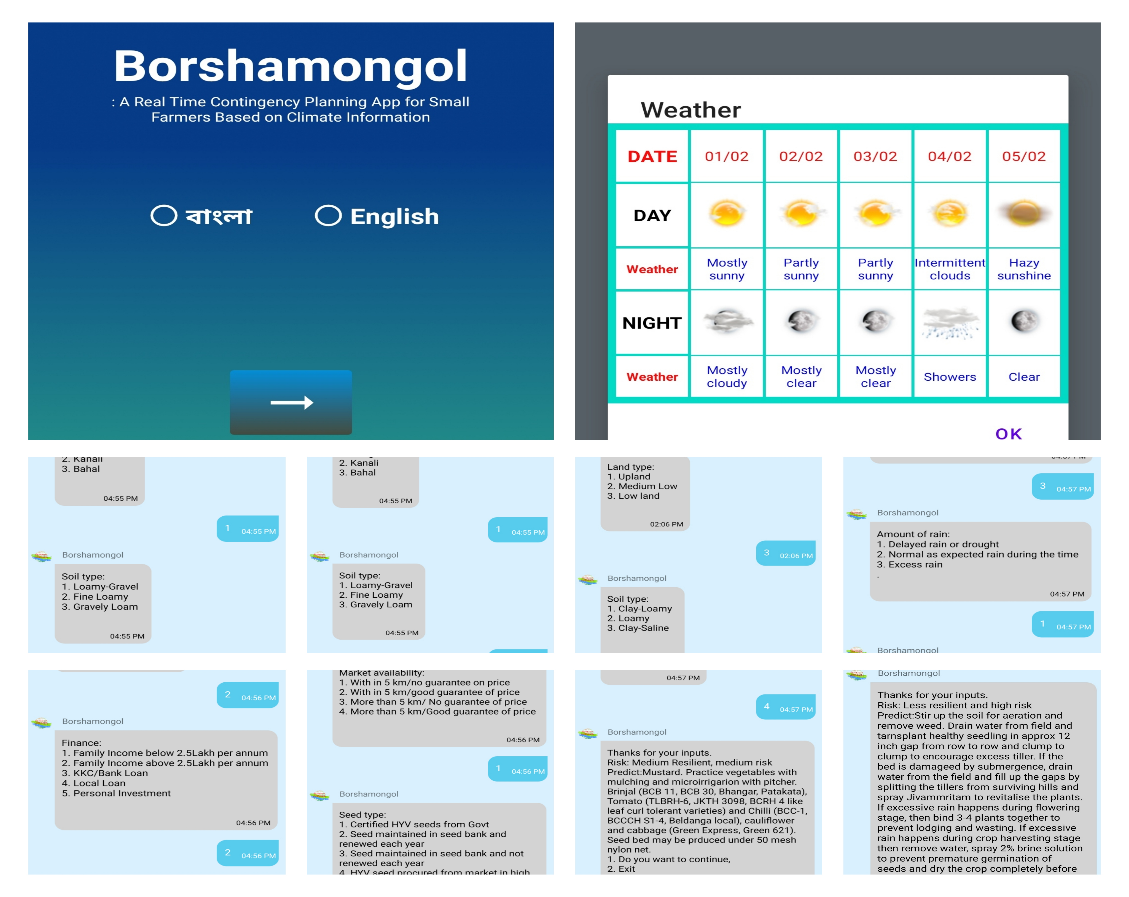
The Android based bot, which has been named Borshamongol (which means “Blessing of Rain” in the Bengali language), has been developed as a bilingual (Bengali and English) system which can provide crop suggestions based on selected inputs. The Android based bot is freely downloadable from the Google app store (https://play.google.com/store/apps/details?id=com.boenci.naboborshamongol). The bot asks for the mobile numbers and name of the first-time user and then uses the phone’s location to provide weather information based on Accuweather© free data for the coming five days. After registration is completed, the bot asks the user to type “Hi” and then asks specific sets of questions based on the framework of gradation already prepared (Supplementary Material -Appendix 2) and embedded in the software logic of the bot. The bot asks for inputs from the users in the form of MCQ only, and one has to type the corresponding serial number of the right option or choice to progress to the next stage. After grading the user, the bot provides a crop advisory and risk assessment based on further inputs like Kharif (monsoon) or Rabi (winter) crops for the sowing or mid-cycle stage. After generating the first advisory, the bot will ask the user whether they want to continue or exit. If the exit button is chosen, then a comprehensive report is generated. Otherwise, the bot continues based on user input. A screenshot of the Android bot is shown in Figure 3.
3.5 Field testing of the Android based bot
The Android based bot was field tested in both locations, with 120 farmers trained to use the system in the most effective way. Farmers also provided detailed feedback. Eighty-eight percent of farmers found the bot very easy to use. Twenty-nine percent of farmers said internet connectivity was a problem for availing the bot service, but all of them indicated this could easily be solved as the bot uses a live location to provide a weather forecast but does not depend upon a live location to generate crop suggestions. Thus, the farmer can easily get his or her response from another farmer in a location with faster internet connectivity by sharing the required inputs. The suggestion generated can be communicated to the original beneficiary as a downloaded document or screenshot. Seventy percent of farmers complained that the bot allotted higher risk grading levels to the farming practices they followed as they are not following agroecological methods, but such methods are not easily available to them nor sufficiently trained to do such practices. Eighty-nine percent of farmers admitted that agroecological practices are more resilient and can reduce costs, but there is a shortage of indigenous seeds, proper training and suitable markets for the end products and resources for such practices. Ninety-one percent of farmers appreciated the contingency plans pertaining to weather extremes based on their specificity and easier methods of explicability were suggested.
4. Conclusion
An Android based bot in the form of a real-time crop advisory tool based on a Climate Information Network has been developed for Purulia in India and Shyamnagar in Bangladesh. This tool has been developed not only as a means of sharing adaptive strategies but also as a process for preparing against climate change-induced weather extremes. The major aim of the intervention under discussion is to prepare the most vulnerable communities in the climate milieu with resilient crops and cropping practices. Analysis of historical weather data and future climate change prediction studies revealed that increments in summer and winter temperatures in both locations with an increase in weather extremes like drought, dry spells and flash floods in Purulia; and extreme rainfall, saltwater inundation and extreme cyclones in Shyamnagar. Both stakeholder feedback and participatory rural appraisal have been done to develop a place-based crop calendar. The crop calendar also includes alternative indigenous crops, resilient cropping practices based on indigenous traditional knowledge and suggested contingency actions under extreme events. The Android based bot grades the farmer user in various categories based on his or her inputs and embedded grading matrix and provides crop and cropping advisory and risk assessment. This unique agriculture-related decision support system method uses all kinds of available information at ground level to reach a fully interactive place-based solution. The system has been satisfactorily tested at both locations among 120 farmers. Farmers have found the system easy to use in both locations, with only a few minor impediments. The two important lessons which can be derived from this activity are: (1) the CIN-based agriculture decision-making tool can provide successful adaptive management in the climate milieu if it can be coupled with ecologically informed practices and availability of heirloom seeds; and (2) such a tool can prevent untimely or incorrect distribution and procurement of seed, fertiliser, water and other input factors thus reducing costs and carbon emissions.
One crucial lesson from these endeavours is that such a system cannot function as a standalone solution, given the multifaceted nature of various driving factors, which also require simultaneous policy-level attention to achieve SDGs such as No Poverty (SDG 1), Zero Hunger (SDG 2), and Climate (SDG 13). Specifically:
1. The availability of resilient crops and indigenous seeds is too small;
2. Three generations of green revolution practices contributed to the loss of Indigenous and Traditional Knowledge (ITK);
3. Large-scale socio-political and psychological inertia remains in the community, which may resist further transformation;
4. Weather data, rental costs of cloud servers and mobile data have become too costly for marginal commons and need to be affordable;
5. Each Panchayat (village government in India) needs to have its own local weather and satellite station, making real-life contingency planning worthwhile; and
6. Market linkages and value chains of resilient and indigenous crops are still in their infancy and are dominated by unsustainable market demands
Acknowledgement
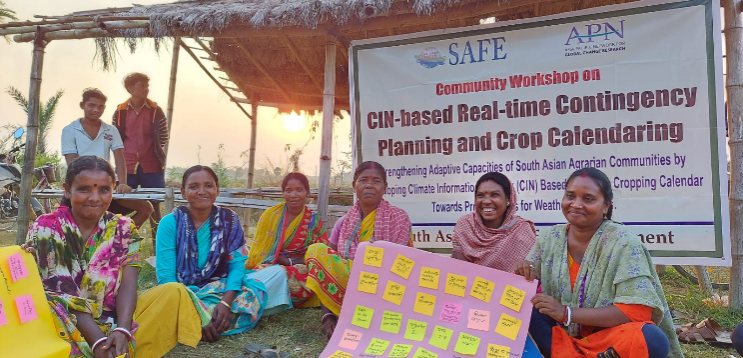
This study has been implemented as a partial requirement of the Asia-Pacific Network for Global Change Research (APN) project on “Strengthening Adaptive Capacities of South Asian Agrarian Communities by Developing Climate Information Network (CIN) Based Scientific Cropping Calendar Towards Preparedness for Weather Extremes” (Grant No. CBA2019-10MY-Ghosh Sarkar). The authors are indebted to APN for its financial support during the implementation of the said programme. We are also indebted to the farming community of Muchkunda, Purulia and Amtali, Kumirmari, Tipligheri of Indian Sundarbans and Shyamnagar of Bangladesh for their active participation during the study. We also like to thank all the stakeholders and experts for their input during the stakeholder survey and webinar during the period of study. Last but not least, some special thanks go to Boenci Solutions for their effort in establishing the bot from conceptualisation to functional state.