Rapid mapping technique for data acquisition: The case of a summer school in the Banjarnegara district, Indonesia
Keywords
Disasters · NDVI · Rapid mapping · Southeast Asia · Summer school · UAVs
Highlights
- Summer school employing the face-to-face method for sharing knowledge related to rapid mapping can improve the basic science knowledge of the participants.
- The unmanned aerial vehicle (UAV) technology is the best technology for acquiring detailed field data.
- The rapid-mapping method (RapMet) may consist of the normalized difference vegetation index (NDVI), linear enhancement, image fusion, and orthophoto map development.
1. Introduction
1.1. Background
Natural disasters affect a large number of vulnerable communities in the world annually. Southeast Asia is the region in the world that is most prone to disasters. More than 41% of the world’s natural disasters occur in this region, and the region is exposed to almost all types of hazards (Sapir, Guha, Hoyois, & Below, 2015). Emergency responses and humanitarian actions are usually provided in the communities in disaster areas. For these reasons, spatial information or mapping the impact areas are needed. For rapid humanitarian action, remote-sensing technology can provide faster and more accurate spatial information on disaster areas.
Rapid mapping and monitoring using remote-sensing techniques are potentially useful technology for providing rapid information on disasters for decision-makers (Bühler, Kellenberger, Small, & Itten, 2016). As such, Rapid-Mapping Method (RapMet), which integrates near-real-time-acquired remote-sensing data with spatial data acquired from unmanned aerial vehicles (UAVs) and with local knowledge, was developed for use in Southeast Asia. The early careers in the region need to acknowledge and use RapMet and thus help disseminate it to their communities. Therefore, a capacity-building initiative, summer school for early careers was used for sharing knowledge about RapMet within the Southeast Asian region.
1.2 Aims
This article aims to explain the implementation of summer school to improve young scientists’ knowledge of rapid mapping and to perform a qualitative assessment of the summer school implementation.
1.3. Study area
Landslides are frequent hazards in Southeast Asia. In Indonesia, the Banjarnegara district is one of the districts in the country where landslides occur annually. It was thus selected as the study area. More than 90% of Banjarnegara consists of undulating, hilly, and steep slopes with high-saturation soil types that have been cleared for use as agricultural lands. High-intensity rainfall, a soil type with a crumb structure, saturation, and slope may cause massive landslides in some parts of the district (Widjaja, Amartiawati, & Naba, 2016).
2. Methodology
2.1. Capacity building
Summer school is a capacity-building initiative that was chosen for this project for sharing knowledge and developing a network among young scientists. Summer school programs focused on accelerated learning have a positive impact on the knowledge and skills of the participants (Cooper, 2015). Indeed, according to Sida (2005), education and training (as in the summer school framework) are the best ways to improve young scientists’ knowledge about science. As this study focused on the Southeast Asian region, the summer school participants were representatives of eight Association of Southeast Asian Nations (ASEAN) member countries (i.e. Indonesia, Malaysia, Philippines, Vietnam, Thailand, Cambodia, Myanmar and Brunei Darussalam). The modules of the school had to meet the criteria for rapid mapping for disasters: basic knowledge of disasters; data acquisition method (either downloading the imagery data or field mapping); how to download and operate the open-source software; the remote-sensing digital-analysis process for disasters (e.g. image enhancement using normalized difference vegetation index [NDVI] and image fusion); mapping using UAVs, and sharing spatial data via WebGIS. Both theory and practice were taught. A simple rapid-mapping system, RapMet, was also developed prior to the summer school for sharing information. The basic method applied for this project was the face-to-face sharing method either in class or in the field.
2.2. Rapid-Mapping Method (RapMet) development
Disasters require quick and precise information for timely and effective emergency response and humanitarian aid. In relation to the provision of spatial information, remote sensing is a fast and reliable source of data. The development of RapMet as a teaching tool for summer school and the steps of sharing knowledge about it are illustrated in Figure 2.
RapMet acquires remote-sensing data in near real-time as preliminary information for determining disaster areas and the general features of such areas. However, near-real-time remote sensing cannot provide detailed information related to a disaster area. In disaster systems, remote-sensing data with a high temporal resolution, but a low spatial resolution can provide only initial information. More detailed information can be obtained only through field mapping. As such, it is necessary to have a tool that can map a disaster area without compromising the surveyor’s safety. The UAV technology, among others, can be used for this purpose. The initial experience with the use of such technology showed that the combination of aerial surveys using UAVs and the collaborative sharing of such with domain experts results in richer information (Ezequiel et al., 2015). The process of rapid-mapping development is illustrated in Figure 3.
2.2.1 Multi-sensor remote sensing: Near-real-time analysis
Analyzing medium-temporal-resolution satellite images such as those from Landsat 8 OLI and Sentinel to assess environmental conditions and infrastructure is a possible prior analysis that can be employed. These two types of images can be freely downloaded. The fastest method of analysis is by simply identifying a disaster area after the images have been quickly rectified using international/national standards such as SRGI 2013 (Indonesian Geospatial References System, 2013). The NDVI method is used to identify disaster areas. According to Liu, Stanturf, and Goodrick (2010), the use of the NDVI method to assess environmental change and disasters provides rapid and straightforward information.
2.2.2. Pan sharpening: Image fusion
Pan sharpening or panchromatic sharpening merges high-resolution panchromatic images with lower- or high-resolution multi-spectral images to obtain better or higher-resolution spectral images (Palsson, Sveinsson, & Ulfarson, 2013; Rajendra, Varghese, Annadurai, Vaithiyanathan, & Thamorathan, 2012). In this case, the disaster area’s Landsat 8 OLI-derived map is fused with the area’s Sentinel image. The process of obtaining a new pan-sharpened image involves using a simple Brovey transformation method combined with a high-pass filter. High-pass filtering is the best way to map infrastructure or other information not available in the previous optical images. This method merges the high-frequency panchromatic image data with the multi-spectral image data to obtain a higher-resolution multi-spectral image.
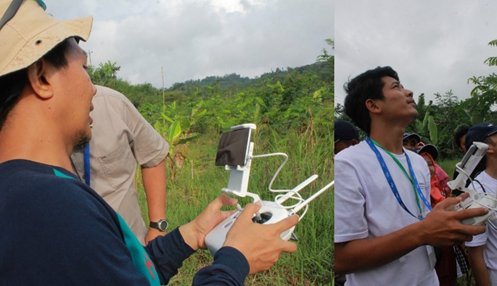
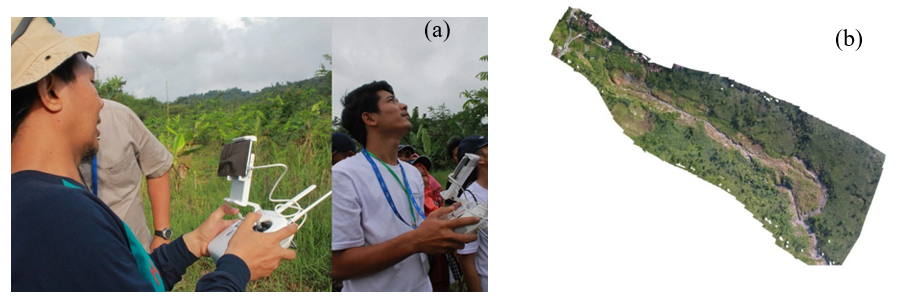
2.2.3. UAV data acquisition and processing
High-spatial-resolution remote-sensing data are needed to obtain reliable information in the event of a disaster quickly. UAVs equipped with compact digital cameras can be used to map landslides quickly and at a high ground resolution (Niethammer, James, Rothmund, Traveletti, & Joswig, 2012). The process of obtaining spatial information using UAV-acquired data is illustrated in Figure 4.
For this step, the images acquired from the UAV should be able to capture the 60% forward and side overlaps and the ground control points (GCPs) using the conventional surveying method, which should collect more than nine GCPs. Ancillary data should also be collected, and manual or digital UAV image selection should be made prior to the orthophoto map development. The selected UAV images are co-registered using the UTM standard and the conventional photogrammetric method.
2.2.4. Uploading the orthophoto map onto RapMet
The orthophoto-derived map is then merged with the near-real-time-acquired images. This spatial information is preliminary information that can be further processed for post-disaster management purposes.
2.3. Evaluation of summer school
Qualitative analysis was used to determine how much the study participants learned what was taught in the summer school. This was done by reviewing the participants’ assignments and personal opinions on the lessons. The amount of learning was ranked from 0 to 4 (i.e. 0 = no basic knowledge [the participant did not learn anything about what was taught in summer school]; 1 = very low basic knowledge [the participant learned only a little about what was taught in summer school]; 2 = low basic knowledge [the participant acquired a moderate amount of learning from what was taught in summer school]; 3 = mid-basic knowledge [the participant acquired a slightly high amount of learning from what was taught in summer school]; 4 = high basic knowledge [the participant fully learned everything that was taught in summer school].
3. Results and Discussion
3.1. Data acquisition and processing
The implementation of summer school, which was attended by young scientists representing only eight ASEAN member countries (excluding Singapore and Lao PDR), showed an acceleration in the attendees’ acquisition of science knowledge in the field of rapid mapping (Table 1).
|
No. |
Materials |
* Level of knowledge |
Note |
|
|
Background |
Summer school |
|||
|
1 |
Basic knowledge about disasters |
3 |
4 |
|
|
2 |
Remote-sensing data acquisition from the system |
3 |
4 |
|
|
3 |
Open-source software downloading and operation for image processing |
3 |
4 |
|
|
4 |
Open-source software downloading and operation for UAV image processing |
0 |
4 |
|
|
5 |
Digital image processing – image enhancement |
3 |
4 |
|
|
6 |
Digital image processing – image fusion |
3 |
4 |
|
|
7 |
Global Navigation Satellite System (GNSS) and orthorectification |
2 |
4 |
|
|
8 |
UAV concept |
2 |
4 |
|
|
9 |
UAV practice |
1 |
3 |
Needs more practice |
|
10 |
Field data acquisition using UAV |
1 |
3 |
Needs more practice |
|
11 |
Selecting and image mosaicking |
2 |
4 |
|
|
12 |
WebGIS |
2 |
3 |
Needs more practice |
|
13 |
RapMet system concept |
0 |
4 |
|
Table 1. Level of knowledge of participants to RapMet material (Note: * 0 = no basic knowledge; 1 = very low basic knowledge; 2 = low basic knowledge; 3 = mid-basic knowledge; 4 = high basic knowledge).
Significant acceleration of knowledge acquisition was obtained in UAV data acquisition and processing, as reflected in the modules on open-source software downloading and operation for UAV image processing, GNSS and orthorectification, selecting and image mosaicking, and UAV concept (Table 1). The participants were able to grasp the kind of software used to process the images obtained from the UAV platform. They came to understand how to operate the software to obtain an orthorectified image. They also better understood the GNSS concepts and theories and the orthorectification processes required to obtain orthorectified-image data. In addition, the participants came to fully understand UAVs, particularly the related regulations, UAV technology development, how to fly UAVs, how to acquire data using UAVs, and how to select and mosaic images using the software. Most participants had not tried acquiring image data using the UAV platform prior to the summer school, not even converting image data into an orthorectified image. Thus, the knowledge they acquired about this was new to them, and they found it exciting that they had come to understand how to map a disaster area rapidly and on a detailed scale.
Despite the increase in the participants’ knowledge, participant eagerness for practising data acquisition using UAVs was not fully achieved, as reflected by the level of knowledge that the participants acquired on average on UAV field practice and field data acquisition (less than 4). In-class computer simulation practice in flying UAVs, in-class practice in flying mini-UAVs, and field practice in flying UAVs require extensive skills that may not be developed within four days of summer school. The participants should continue to improve their UAV flying skills beyond the summer school to obtain spatial data from UAVs in the future.
Knowledge acquisition acceleration also occurred on multi-sensor remote sensing modules–near-real-time analysis and pan-sharpening–image fusion. The participants understood the importance of using the NDVI and linear enhancement methods to quickly identify disaster areas and the surrounding environment as initial information. NDVI can help predict unfortunate natural disasters for the prompt provision of humanitarian aid, for damage assessment, and the formulation of new protection strategies through the changing of vegetation cover (Gandhi, Parthiban, Thummalu, & Christy, 2015). Even the accuracy assessed based on independent data on natural disasters was high (76% correct) for the NDVI-based map (Lupo, Reginster, & Lambin, 2010). The remote-sensing images used for these methods are the Landsat 8 OLI-derived images (acquired before and shortly after the disaster) and Sentinel A-derived images (acquired before and after the disaster).
The summer school participants also grasped the importance of image fusion methods between optical and radar data for quickly and clearly identifying disaster areas. Due to the availability in the near future of near-real-time-acquired synthetic aperture radar (SAR) images from multiple satellites, the fusion of SAR images with other images and data is playing an increasingly important role in understanding and forecasting natural hazards (Lu et al., 2010). Indeed, image fusion helps achieve high spatial and spectral resolutions by combining images from two sensors into one new image containing information whose quality cannot be achieved otherwise (Flusser, Sroubek, & Zitova, 2007). Image fusion helps sharpen the image map for determining disaster areas (Garzelli, Capobianco, & Nencini, 2008; Wan & Qin, 2011). See Figure 6 for the result of the use of image fusion for this purpose.
The most important part of the summer school’s knowledge-sharing program is how to convert the map data derived from near-real-time-acquired images into more detailed and accurate information using UAVs. Considering the rapid UAV technology development and the fact that mappers or surveyors safety will not be compromised in the field, mapping disaster areas using UAV is a good option. This is because UAVs can quickly record disaster areas. Indeed, the methodologies, techniques, and software for creating orthophoto images from UAV-acquired data are already available. This view is supported by Adam and Friedland (2011). They state that UAVs’ inherent characteristics, such as their small size, manoeuvrability, and low cost, make them a viable option for use in disaster events.
As mentioned earlier, for the summer school participants in this study, how to create a rapid map from UAV-acquired data technically and conceptually is a new scientific knowledge because most of them had not tried recording objects on Earth using UAVs and did not know how to create maps using UAV-acquired data before the summer school.
Ideally, summer school participants can acquire field data and process these into useful spatial information. However, considering the time constraints and the participants’ lack of skill and experience in flying UAVs, what is important is that they be given a chance to learn and practice how to fly UAVs, acquire data from these, and process such data into spatial information.
3.2. Understanding RapMet
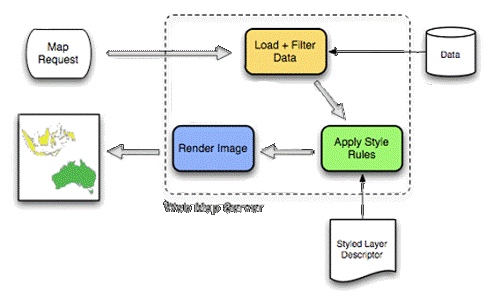
All the data collected and integrated using RapMet can be made easily accessible and visible to decision-makers and end-users in near real-time and worldwide using WebGIS technologies. The user will perform a query on certain data from his client application generally running within a Web browser. The results will be provided by a remote server to the Web browser. Such functionalities are the core of the so-called decision support systems (DSSs), which provide online access to multiple users and allow users to manage critical situations and make decisions in a very short time.
Although the summer school participants in this project were not fully able to practice WebGIS RapMet’s development to obtain basic spatial information on disaster areas, the concept and development of such methods were fully provided in the open-source software and were understood by them. In addition, the method can be further developed for the participants’ needs in the future (see Table 1). What the participants should understand about the development of RapMet is shown in Figure 7.
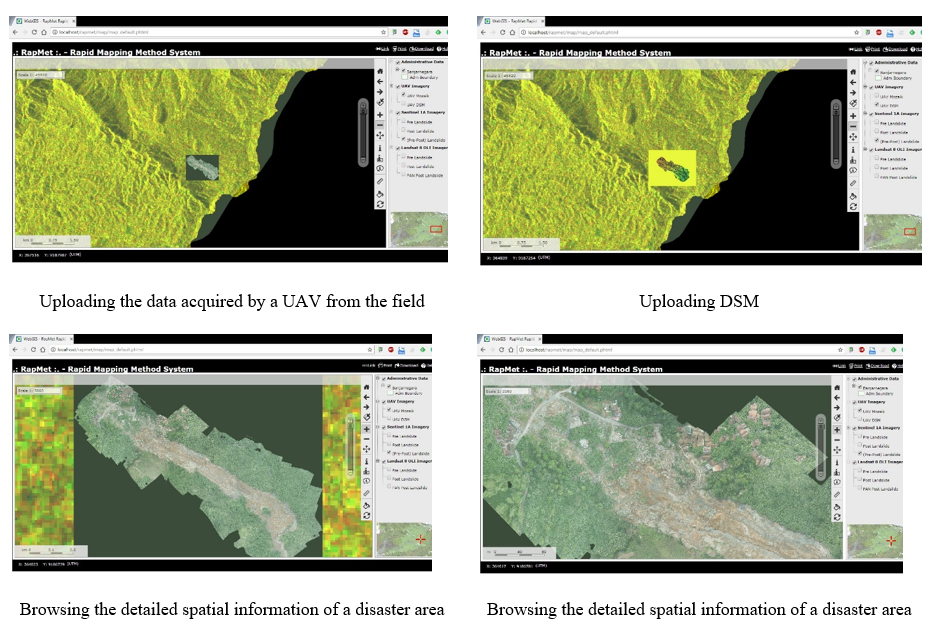
The results of uploading data into the system are shown in Figure 8.
4. Conclusion
Summer school employing a face-to-face method for sharing knowledge related to rapid mapping can improve the basic science knowledge of the young scientists that attennd, especially on UAV data acquisition and processing, WebGIS, and RapMet. Even though there were time constraints on learning about RapMet development, the basic concept of RapMet development was fully learned by the summer school participants in this study. In the future, these young scientists can further develop such a method using the basic knowledge that they obtained from the summer school. They can also introduce it to their disaster prevention authorities.
Acknowledgement
We wish to express our appreciation and gratitude to APN for funding this project, and to the lecturers from the University of Technology Malaysia, the Chinese Taipei Society of Photogrammetry and Remote Sensing (CTSPRS), EuroUSC–Netherlands, Ohio State University (OSU), Gadjahmada University, and Geospatial Information Agency, all of whom lent their support to this project. Lastly, we thank the study participants’ institutions for allowing the participants to participate in this project.
References
- Adams, S. M., & Friedland, C. J. (2011). A survey of unmmaned aerial vehicle (UAV) usage for imagery collection in disaster research and management. Retrieved from https://www.researchgate.net/publication/266465037_A_Survey_of_Unmanned_Aerial_Vehicle_UAV_Usage_for_Imagery_Collection_in_Disaster_Research_and_Management
- Bühler, Y.A., Kellenberger, T.W.; Small, D, & Itten, K.I. (2006). Rapid mapping with remote sensing data during flooding 2005 in Switzerland by object-based methods: A case study. In J.F. Martin-Duque (Ed.), Geo-environment and landscape evolution II: Monitoring, simulation, management and remediation. Southampton, 391-401. doi:10.2495/GEO060391
- Cooper, H., Charrlton, K., Valentine, J.C., & Muhlenbruck, L. (2000). Making the most of summer school: A meta-analytic and narrative review. Monograph of the Society for Research in Child Development, 65(1):1–118
- Poursanidis, D., & Chrysoulakis, N. (2017). Remote Sensing, natural hazards and the contribution of ESA Sentinels missions. Remote Sensing Applications: Society and Environment, 6, 25–38. doi:10.1016/j.rsase.2017.02.001
- Ezequiel, C. A. F., Cua, M., Libatique, N. C., Tangonan, G. L., Alampay, R., Labuguen, R. T., Favila, C. M., Honrado, J. L. E., Caños, V., Devaney, C., Loreto, A. B., Bacusmo, J., & Palma, B. (2014). UAV aerial imaging applications for post-disaster assessment, environmental management and infrastructure development. 2014 International Conference on Unmanned Aircraft Systems (ICUAS), 274–283. doi:10.1109/ICUAS.2014.6842266
- Flusser, Jan., Filip Sroubek, and Barbara Zitova B. (2007). Image fusion: Principles, methods, and applications [Lecture notes]. Tutorial EUSIPCO 2007. Institute of Information Theory and Automation Academy of Sciences, Czech Republic.
- Gularso, H. (2017). RSNI pemetaan PBI skala besar bagian 2: Akuisisi data foto udara digital menggunakan pesawat nir-awak [RSNI large-scale PBI mapping part 2: Digital aerial photo data acquisition using drones]. Presented at RSN FGD-BIG 2017.
- Gandhi, G. M., Parthiban, S., Thummalu, N., & Christy, A. (2015). NDVI: Vegetation change detection using remote sensing and GIS – A case study of Vellore district. Procedia Computer Science, 57, 1199–1210. doi:10.1016/j.procs.2015.07.415
- Garzelli, A., Capobianco, L., & Nencini, F. (2008). Fusion of multispectral and panchromatic images as an optimisation problem. In T. Stathaki (Ed.), Image Fusion (pp. 223–250). Academic Press. doi:10.1016/B978-0-12-372529-5.00005-6
- Liu, Y., Stanturf, J., & Goodrick, S. (2010). Wildfire potential evaluation during a drought event with a regional climate model and NDVI. Ecological Informatics, 5(5), 418–428. doi:10.1016/j.ecoinf.2010.04.001
- Zhong, L., Dzurisin, D., Jung, H., Zhang, J., & Zhang, Y. (2010). Radar image and data fusion for natural hazards characterisation. International Journal of Image and Data Fusion, 1(3), 217–242. doi:10.1080/19479832.2010.499219
- Niethammer, U., James, M. R., Rothmund, S., Travelletti, J., & Joswig, M. (2012). UAV-based remote sensing of the Super-Sauze landslide: Evaluation and results. Engineering Geology, 128, 2–11. doi:10.1016/j.enggeo.2011.03.012
- Palsson, F., Sveinsson, J. R., & Ulfarsson, M. O. (2014). A new pansharpening algorithm based on total variation. IEEE Geoscience and Remote Sensing Letters, 11(1), 318–322. doi:10.1109/LGRS.2013.2257669
- Rajendra, V., Varghese, D., Annadurai, S., Vaithiyanathan, V. & Thamorathan, B. (2012). A Case study on satellite image fusion technique. Research Journal of Information Technology, 4(2), 71–78.
- Lupo, F., Reginster, I., & Lambin, E. F. (2001). Monitoring land-cover changes in West Africa with SPOT Vegetation: Impact of natural disasters in 1998-1999. International Journal of Remote Sensing, 22(13), 2633–2639. doi:10.1080/01431160117700
- Guha-Sapir, D., Hoyois, P. & Below, R. (2015). Annual disaster statistical review 2015: The numbers and trends. Centre for Research on the Epidemiology of Disasters (CREP) – Institute of Health and Society (IRSS). Université Catholique de Louvain. Brussels, Belgium.
- Bergström, L. (2002). Methods for capacity development: A report for Sida’s project group “Capacity development as a strategic question”. Swedish International Development Cooperation Agency. Retrieved at https://publikationer.sida.se/contentassets/21d3b77fac2844fd89779048c8b3cfe7/no-10.-methods-for-capacity-develpoment_2645.pdf
- Sutrisno, D., Hashim, M. B., Syaifoel, R., Qin, R., Shih, P. T. Y., & Wicaksono, P. (2017). Rapid mapping technique for disaster observation and environmental change data acquisition. Project final report: CBA2016-10SY-Sutrisno, Asia-Pacific Network for Global Change Research. Retrieved 9 April 2021 from https://www.apn-gcr.org/publication/project-final-report-cba2016-10sy-sutrisno/
- Wan, T., & Qin, Z. (2011). An application of compressive sensing for image fusion. International Journal of Computer Mathematics, 88(18), 3915–3930. doi:10.1080/00207160.2011.598229
- Widjaja, B., Naba, S. M. B., & Amartiawati, N. (2016). Banjarnegara landslide and mudflow: Rheological parameter and numerical simulation using Bingham’s model. Proceedings of the 6th International Annual Engineering Seminar. Yogyakarta, Indonesia.