
Integrating ALOS-PALSAR and ground based observations for forest biomass estimation for REDD+ in Cambodia
Keywords
Deforestation · Forest biomass · Geospatial data · Mitigation · SAR backscattering
Highlights
- PALSAR is effective in monitoring biomass and its changes without limitations of clouds
- National level biomass information is useful in implementing sustainable forest management practices required for REDD+
- Empirical, remote sensing and modelling studies can be useful for generating biomass information for REDD+ MRV implementation
1. Introduction
Forests play an important role in global carbon cycling as they are potential carbon sinks and sources to the atmosphere CO2 (Muukkonen & Heiskanen, 2007; Pachauri et al., 2014). Tropical forests store about 40% of terrestrial carbon (Page et al., 2009). According to the FAO (2015), total forest area declined by 3% from 4128 M ha to 3999 M ha in 1990 and 2015, respectively. Natural forest area declined from 3961 M ha to 3721 M ha between 1990 and 2015, while planted forest increased from 168 M ha to 278 M ha. The Intergovernmental Panel on Climate Change (IPCC) has pointed out that reducing or preventing deforestation is a mitigation option for climate change (Angelsen A., 2010; Pachauri et al., 2014). The Clean Development Mechanism (CDM) under the Kyoto Protocol is not sufficient to mitigate climate change by adopting afforestation and reforestation because deforestation releases more greenhouse gases (GHGs) than afforestation and reforestation (Schoene, 2005). Forest conservation is only one of many possible options by which permanent land-use change may be avoided (Skutsch et al., 2007). REDD+ prevents carbon emissions being released into the atmosphere by conserving existing carbon stocks. The basic idea of REDD+ is to reward individuals, communities, projects, and countries that reduce GHG emissions from forests (Angelsen, 2008). Implementation of REDD+ policies require effective biomass and deforestation monitoring systems that are reproducible, provide consistent results, meet standards for mapping accuracy, and can be implemented at the national level (DeFries et al., 2007).
There are various methodologies for biomass estimation but, currently, no methodology gives a clear view on how to report carbon pools and their fluxes and the resulting accuracy and uncertainty of biomass monitoring. Therefore, the need for biomass mapping has become urgent in order to assess and produce data on forest carbon stocks and change in stocks on a national level (Maniatis & Mollicone, 2010). Van der Sande et al. (2017) studied the strength of empirical, remote sensing and ecosystem modelling approaches in evaluating biodiversity effects on carbon storage in a case study in lowland Bolivia. They proposed the integration of all three approaches to climate change mitigation. Global biomass map (Saatchi et al., 2011) shows uncertainties of about 30-50% in Indo-China countries. Therefore, there is a need to develop a regional or national level biomass map to overcome limitations of global biomass map. National or regional biomass information can be useful to design policies for a particular region based on country-specific information.
The most accurate way of calculating biomass is destructive sampling and forest inventory data using allometric equations (Anitha K. et al., 2015). However, these traditional techniques are often time-consuming, labour intensive, and difficult to implement, especially in remote areas, and they cannot provide the spatial distribution of biomass in large areas (Avtar, Takeuchi, & Sawada, 2013). Moreover, forest inventory databased methods cannot give historical information about forest biomass if there were no existing forest inventory data. To overcome this limitation most of the scientists suggest using remote sensing satellite supplemented with low forest inventory data. This can provide a cheap and fast estimation as well as historical information about forest biomass at regional or local scale (Avtar, Suzuki, Takeuchi, & Sawada, 2013). Most remote sensing techniques are based on optical and synthetic aperture radar (SAR) systems. Gizachew et al. (2016) used Landsat-8 to estimate living biomass in low woodlands of Tanzania and concluded that Landsat-8 based NDVI is a useful parameter to estimate biomass in low biomass regions. The disadvantages of optical sensors are not related to plants’ structural parameters, acquisition of cloud-free images in tropical countries, the low saturation level of spectral bands and various indices (Gibbs, Brown, Niles, & Foley, 2007). Therefore, dependency on SAR sensors has increased because SAR can provide data without limitation of clouds and solar illumination. Penetration capability of SAR allows the extraction of information about plants’ structural parameters and hence has the ability to measure biomass (Lu, 2006).
The successful launch of the Advanced Land Observing Satellite (ALOS) PALSAR in 2006 has increased the potential to use radar to measure biomass. This is the first long-wavelength (L-band, 23-cm wavelength) SAR satellite sensor to have the capability of collecting single, dual, full and Scan-SAR mode with cross-polarized (HV, horizontal-transmit, vertical receive) and co-polarized (HH, horizontal-transmit, horizontal receive; VV, vertical-transmit, vertical receive) data. The HV polarization is useful because it interacts with trees and produces a strong response (Mitchard et al., 2011).
Various studies have analyzed the retrieval of Above Ground Biomass (AGB) using radar data in tropical regions (Mitchard et al., 2009; Gama, Dos Santos, & Mura, 2010; Englhart, Keuck, & Siegert, 2011). Longer wavelength SAR systems have proven to be more useful because of an increasing backscatter range with changing biomass (Dobson et al., 1992; Luckman et al., 1997; Castro, Sanchez-Azofeifa, & Rivardastro, 2003; Lu, 2006). These biomass estimations are valid up to a certain threshold where saturation occurs, (Lucas et al., 2007; Mitchard et al., 2009). In general, the saturation level of SAR depends on the frequency of SAR systems as well as forests structure (Imhoff, 1995). The sensitivity of SAR decreases with the increase of biomass in the dense forests (Kasischke, Melack, & Dobson, 1997). In recent studies use of airborne laser scanning is also one of the effective methods to monitor above ground biomass precisely, however, use of airborne laser scanning is expensive and can’t cover global data (Chen, McRoberts, Wang, & Radtke, 2016; Ene et al., 2017). This study is an attempt to overcome the saturation problem of PALSAR appropriately. The main aim of this study is to estimate national level biomass using PALSAR mosaic data based on a bottom-up approach to support REDD+ and forest management practices in Cambodia.
2. Methodology
2.1 Field data
The study area was visited in November 2010 and January 2011 to collect forest inventory data (Diameter at Breast Height (DBH), tree height, species, tree density, and forest types). Seventy-nine sampling plots were selected based on analysis of forest cover map, Landsat data, and SRTM-DEM data. We selected homogeneous forests for in-situ data collection. During the selection of sampling plots spatial homogeneity, eco-climatic conditions and forest types were considered. Most of the sampling plots were selected in the plane area to minimize the topographic effects of SAR data. 30×60 m and 30×30 m sampling plots were used in deciduous and evergreen forests respectively depend on the homogeneity of the site. The sampling plots were identified using GPS (Garmin 62s) in the field. We used the Cambodia-based allometric equation developed by Kiyono et al. (2010) as previous studies mentioned that a country-specific allometric equation is better than a global allometric equation (Angelsen, 2008). To check the accuracy of biomass estimation, we compared the allometric equation-based biomass of Kiyono et al. (2010) with that of Brown (1997) and Kenzo et al. (2009) allometric equations-based biomass. The comparison indicates that the allometric equation-based biomass estimation by Brown (1997) shows over-estimation and that by Kenzo et al. (2009) shows under-estimation. Therefore, we decided to use the allometric equation by Kiyono et al. (2010) allometric equation. The biomass value obtained from each tree were summed and normalized algebraically to calculate the total biomass of each plot in t/ha. In the estimation, we considered trees ≥ 10 cm DBH, which are likely to comprise of most of the woody biomass of the plots. The common plant species in Cambodia are Aporusa filicifolia (Bail Krong), Dipterocarpus tuberculatus (Roxb Khlong), Swietenia macrophylla (Krobaek), Garcinia schomburgkiana (Tro-moung/Tro-meng), Ardisia helferiana (Chhom pou prey), Cananga latifolia (Chke sraeng), Dacrydium elatum (Srol kraham). Table 1. Sows the major tree species in Cambodia and their inventory parameters in some of the field plots. The following allometric equations were used (Kiyono et al., 2010):
Leaf biomass (kg) = 173* (BA 0.938) (1)
Branch biomass (kg) = 0.217 * (BA 1.26) * (D1.48) (2)
Stem biomass (kg) = 2.69 * (BA1.29) * (D1.35) (3)
where BA stands for Basal area and D is stem density.
| Major species | Max DBH (cm) | Max Height (m) |
| Dipterocarpus costatus | 128.0 | 41.4 |
| Dipterocarpus intricatus | 87.2 | 26.2 |
| Melaleuca cajuputi | 30.0 | 17.2 |
| Irvingia malayana | 117.5 | 26.5 |
| Shorea siamensis | 34.0 | 16.2 |
| Lagerstroemia calyculata | 108.4 | 45.6 |
| Dalbergia cochinchinensis | 66.8 | 28.1 |
| Shorea obtusa | 53.6 | 24.5 |
| Schima wallichlii | 67.5 | 27.1 |
| Peltophorum dasyrrhachis | 77.3 | 31.6 |
| Terminalia mucronata | 78.2 | 32.1 |
| Irvingia malayana | 157.2 | 42.8 |
| Dipterocarpus obtusifolius | 42.8 | 26.9 |
2.2 Satellite data
Forest cover map based on ASTER 2005 data, SRTM-DEM data, Landsat ETM+ 2009, 2010 data were used to select the sampling sites. PALSAR FBD 50 m mosaic data was downloaded from the Japan Aerospace Exploration Agency (JAXA). The processing of PALSAR data was started with the terrain corrections using methodology by Akatsuka, Takeuchi, Rakwatin and Sawada (2009) and Shimada (2010) in order to minimize the topographic effects of PALSAR in a mountainous area. The digital number (DN) was converted to the normalized radar cross section (NRSC, or σº). The backscattering coefficient was calculated using the following equation (Shimada, Isoguchi, Tadono, & Isono, 2009).
σº = 10 x log10 (DN2) – 83 (4)
The PALSAR data was co-registered with Landsat ETM+ orthorectified data. We did not consider the climatic conditions of PALSAR 50 m mosaic data because the information was not available.
2.3 Statistical Analysis
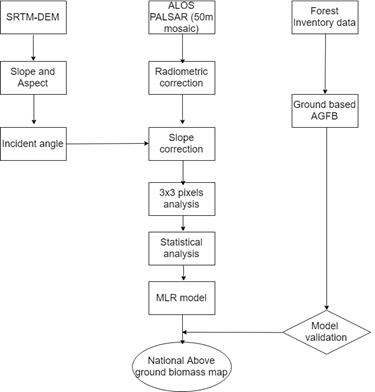
Multi-linear regression (MLR) method was applied relating the field calculated biomass with the backscattering properties of PALSAR. We consider biomass as a dependent variable and PALSAR backscattering (HV, HH/HV) as an independent variable. We used 3×3 pixels window size analysis for MLR model development and this MLR model was applied to the PALSAR 50 m mosaic data to estimate biomass of forests for Cambodia. Finally, validation was used to evaluate the accuracy of the model by comparing PALSAR estimated to the field derived AGB. The methodology is shown in Figure 1.
3. Results and Discussion
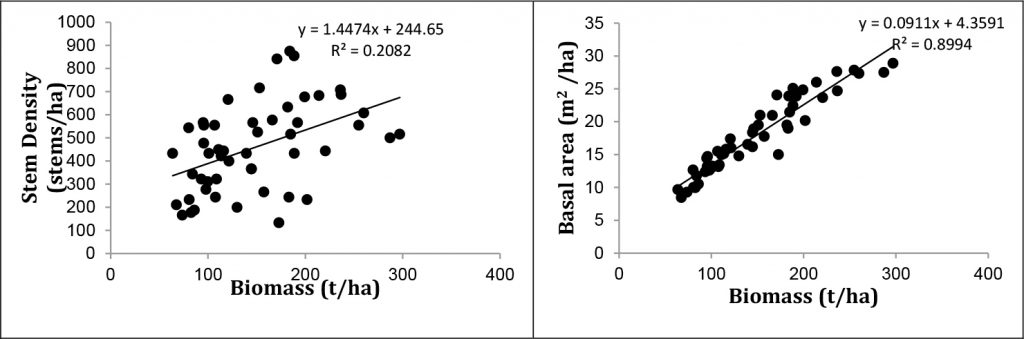
Statistical analysis was undertaken to correlate the forest inventory data. Figures 2a and 2b show the relationship of biomass with the stem density and basal area, respectively. Figure 2a does not show good correlation (R2 = 0.2) between biomass and tree density because tree density depends on tree species, site conditions, and forest type. Figure 2b shows strong correlation (R2 = 0.9) between biomass and basal area because the basal area is a function of tree density and DBH. Data from a total of 79 plots were analyzed. Fifty-one plots were used for the MLR model development and 23 plots were used for model validation. Five plots were excluded from the analysis because their locations were either too near to roads or there were some degraded trees.
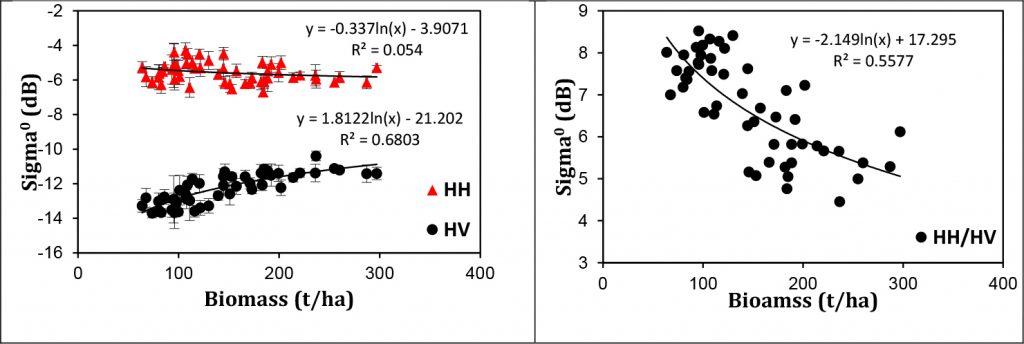
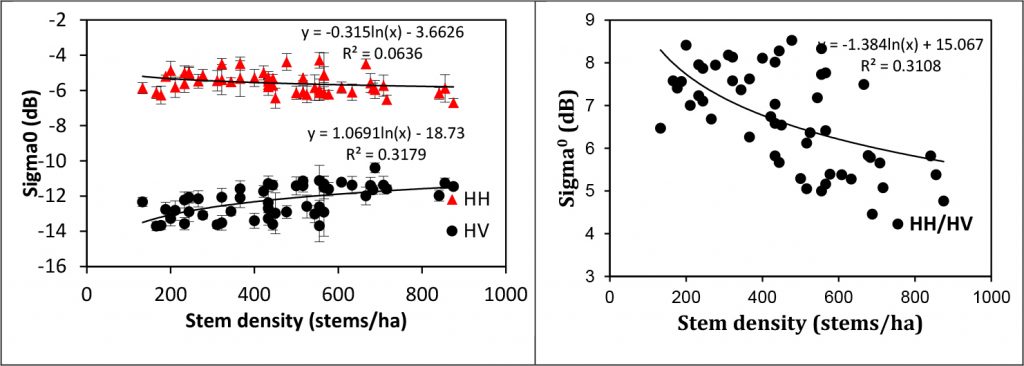
Figure 3a shows the relationship between PALSAR σº (HH) and (HV) and biomass. Field measured biomass shows a significant relationship with the σº HV (R2adj = 0.66) as compared with σº HH (R2adj = 0.05). High σº HH in low biomass region has been observed because of the high surface scattering from the plots covered by dry leaves and grass, which increases surface roughness. The reason why σº HV polarization produces a better correlation than HH is due to the volume scattering in forest areas, which enhances the cross-polarization returns as an increase in biomass. Other studies also reveal that the σº HV is more sensitive to forest biomass compared to σº HH (Le Toan, Beaudoin, Riom, & Guyon, 1992; Harrell et al., 1995). We observed different backscattering properties from the same biomass region (Figure 3a at biomass 100-150 t/ha) because of the difference in canopy and their distribution. Evergreen forest, having a multi-storey tree structure, shows high backscattering as compared to deciduous forests of the same biomass class. A loss in sensitivity of the PALSAR signal appeared to occur at approximately 150-200 t/ha biomass (Figure 3a). Figure 3b shows a strong relationship between PALSAR σº HH/HV with biomass (R2adj = 0.54). Therefore, the polarization ratio is a useful parameter for biomass estimation. Figure 3c shows a poorer relationship between PALSAR σº HH and HV with the stem density (R2 = 0.06 and 0.32, respectively). This is mainly because tree density depends on the forest types, tree species, and site conditions, etc. Figure 3d also shows a poor relationship between σº HH/HV with tree density (R2 = 0.3).
We have used PALSAR σº HV and HH/HV to generate MLR model because HV and HH/HV shows a strong correlation with biomass as compared to HH polarization. PALSAR σº HV is dominated by volume scattering from woody elements of trees so that HV is strongly related to AGB (Le Toan et al., 2011). The MLR model was developed using dependent (biomass) and independent (HV, HH/HV backscattering) variables. The model was applied to the PALSAR 50 m mosaic data to generate a national-level biomass map. Figure 4a shows the biomass map with 8 classes of biomass for Cambodia. The deforested area shows a very low value of biomass. Figure 4b shows the forest cover map of the same biomass region. If we compare the biomass map (Figure 4a) with the forest cover map (Figure 4b) then the high biomass region (>200 t/ha) mostly falls into the illustrated categories of evergreen high and medium-low class in forest cover map. However, in the mountainous area (northern part) the biomass map shows variation because of the topography. The results from this study show the potential of PALSAR 50 m mosaic data that is freely available.
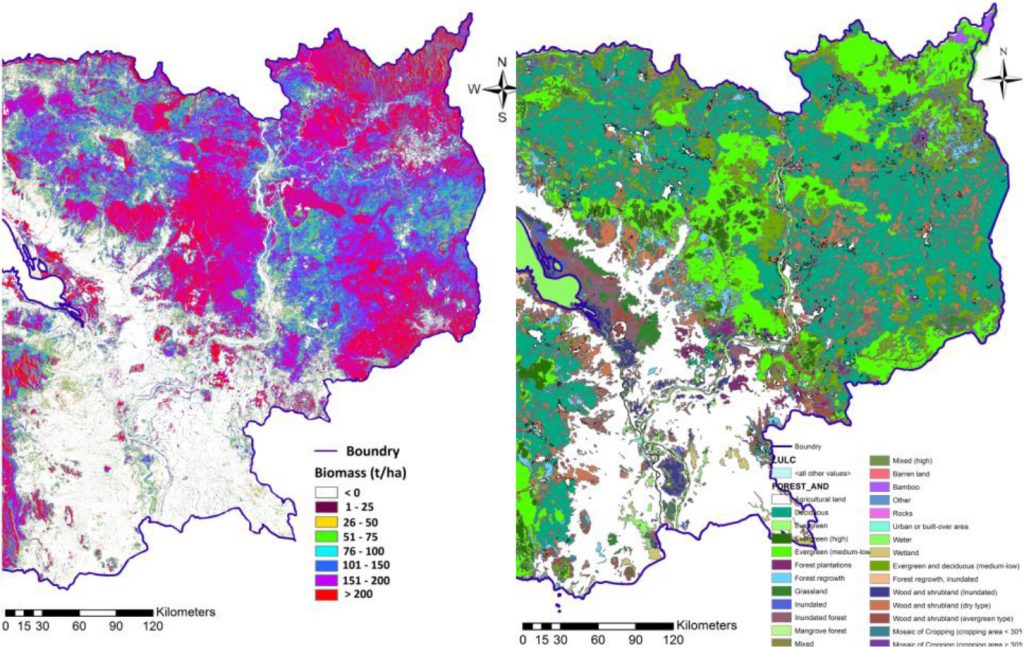
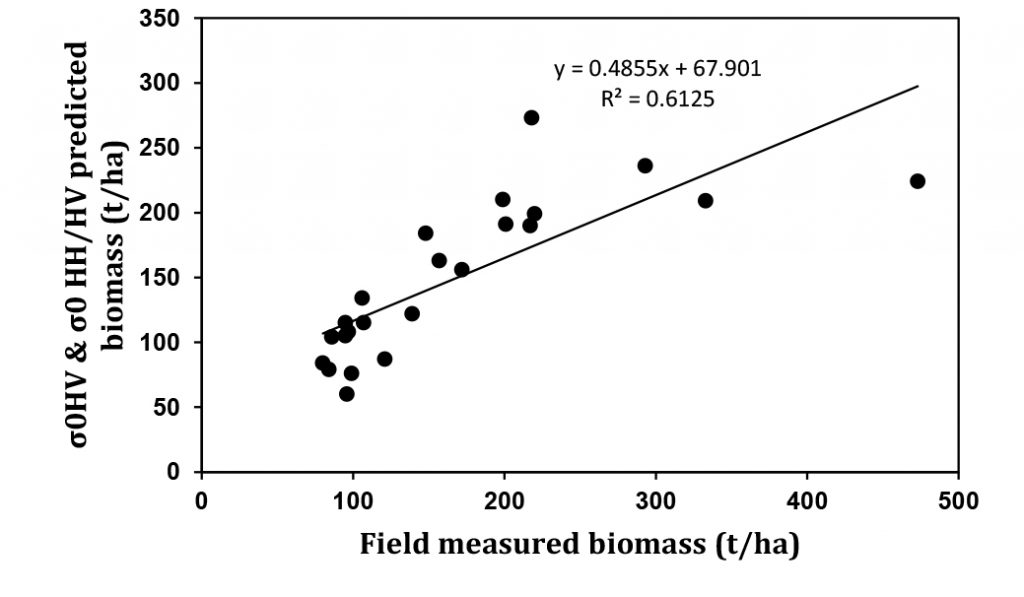
Figure 5 shows the validation results of PALSAR derived biomass. The accuracy of PALSAR predicted AGB decreases as the biomass increases because of saturation of the PALSAR signal. The result shows a significant coefficient of correlation R2 = 0.61. The overall root means square error (RMSE) for the data is 63 t/ha, however, this decreases to 19 t/ha if values only below 100 t/ha are considered and to 21 t/ha using values up to 200 t/ha. The high variation in errors are present in the high biomass region i.e. >200 t/ha. We predicted two types of uncertainties: a) calculating biomass from field data using allometric equation because we have not used species-specific allometry as well as small plot size and trees having DBH < 10 cm was not considered, and b) saturation of PALSAR signal at high biomass region as well as topographic effects. Essentially, this study shows the importance of PALSAR backscattering and its interaction with vegetation to estimate various biophysical parameter estimation. High penetration capability of L-band SAR data can be effective to monitor forest volume.
4. Conclusion
Spatial information about forest biomass is useful to calculate the total amount of forest carbon in specific areas at a specific time. Biomass information is useful to calculate CO2 emissions due to deforestation. This study demonstrates that a combination of PALSAR data and field data is useful to generate biomass maps that show the importance of forest inventory data. However, in high biomass regions, the PALSAR data become saturated. Biomass maps are not precise but can provide information about biomass distribution, which is needed for forest management practices. This methodology can be used to estimate biomass of other tropical countries using PALSAR and PALSAR-2 data more precisely. Cambodia biomass map is a vital data source for national level REDD+ mechanism implementation. The information will not only help enhance carbon stock in forests by implementing sustainable forest management practices but also enhance the livelihoods of the local communities as they depend on forests and their products. National level biomass maps will be useful for establishing effective national-level forest management plans and policies for REDD+ implementation.
Acknowledgement
The authors are highly thankful to the Asia-Pacific Network for Global Change Research (APN) for supporting various capacity development programme and Japan Aerospace Exploration Agency (JAXA) for providing PALSAR data under ALOS Research Announcement-4. We would like to thank the Forestry Administration (FA), Cambodia for their cooperation during the field data collection.
References
- Akatsuka, S., Takeuchi, W., Rakwatin, P., & Sawada, H. (2009, October). Evaluation of slope correction effects on ALOS PALSAR mosaic data set in forest mapping in Indonesia and Malaysia. In 30th Asian conference on remote sensing (ACRS): Beijing, China.
- Angelsen, A. (Ed.). (2008). Moving ahead with REDD: Issues, options and implications. CIFOR.
- Angelsen, A. (2010). Policies for reduced deforestation and their impact on agricultural production. Proceedings of the National Academy of Sciences, 107(46), 19639-19644.
- Anitha, K., Verchot, L. V., Joseph, S., Herold, M., Manuri, S., & Avitabile, V. (2015). A review of forest and tree plantation biomass equations in Indonesia. Annals of forest science, 72(8), 981-997.
- Avtar, R., Takeuchi, W., & Sawada, H. (2013). Full polarimetric PALSAR-based land cover monitoring in Cambodia for implementation of REDD policies. International Journal of Digital Earth, 6(3), 255-275.
- Avtar, R., Suzuki, R., Takeuchi, W., & Sawada, H. (2013). PALSAR 50 m mosaic data based national level biomass estimation in Cambodia for implementation of REDD+ mechanism. PLoS One, 8(10), e74807.
- Brown, S. (1997). Estimating biomass and biomass change of tropical forests: A primer (Vol. 134). UN Food and Agriculture Organization
- Castro, K. L., Sanchez-Azofeifa, G. A., & Rivard, B. (2003). Monitoring secondary tropical forests using space-borne data: Implications for Central America. International Journal of Remote Sensing, 24(9), 1853-1894.
- Chen, Q., McRoberts, R. E., Wang, C., & Radtke, P. J. (2016). Forest aboveground biomass mapping and estimation across multiple spatial scales using model-based inference. Remote Sensing of Environment, 184, 350-360.
- DeFries, R., Achard, F., Brown, S., Herold, M., Murdiyarso, D., Schlamadinger, B., & de Souza Jr, C. (2007). Earth observations for estimating greenhouse gas emissions from deforestation in developing countries. Environmental science & policy, 10(4), 385-394
- Dobson, M. C., Ulaby F. T., LeToan, T., Beaudoin, A., Kasischke, E.S., & Christensen, N. (1992). Dependence of radar backscatter on coniferous forest biomass. IEEE Transactions on Geoscience and Remote Sensing 30, no. 2 (1992): 412-415.
- Englhart, S., Keuck, V., & Siegert, F. (2011). Aboveground biomass retrieval in tropical forests—The potential of combined X-and L-band SAR data use. Remote sensing of environment, 115(5), 1260-1271.
- Ene, L. T., Næsset, E., Gobakken, T., Bollandsås, O. M., Mauya, E. W., & Zahabu, E. (2017). Large-scale estimation of change in aboveground biomass in miombo woodlands using airborne laser scanning and national forest inventory data. Remote Sensing of Environment, 188, 106-117.
- FAO. (2015). Global Forest Resources Assessment 2015. UN Food and Agriculture Organization, Rome. Retrieved from http://www.fao.org/3/a-i4808e. pdf
- Gama, F. F., Dos Santos, J. R., & Mura, J. C. (2010). Eucalyptus biomass and volume estimation using interferometric and polarimetric SAR data. Remote Sensing, 2(4), 939-956.
- Gibbs, H. K., Brown, S., Niles, J. O., & Foley, J. A. (2007). Monitoring and estimating tropical forest carbon stocks: Making REDD a reality. Environmental Research Letters, 2(4), 045023.
- Gizachew, B., Solberg, S., Næsset, E., Gobakken, T., Bollandsås, O. M., Breidenbach, J., … & Mauya, E. W. (2016). Mapping and estimating the total living biomass and carbon in low-biomass woodlands using Landsat 8 CDR data. Carbon balance and management, 11(1), 13.
- Harrell, P. A., Bourgeau-Chavez, L. L., Kasischke, E. S., French, N. H. F., & Christensen Jr, N. L. (1995). Sensitivity of ERS-1 and JERS-1 radar data to biomass and stand structure in Alaskan boreal forest. Remote Sensing of Environment, 54(3), 247-260.
- Imhoff, M. L. (1995). Radar backscatter and biomass saturation-Ramifications for global biomass inventory. IEEE Transactions on Geoscience and Remote Sensing, 33(2), 511-518.
- Pachauri, R. K., Allen, M. R., Barros, V. R., Broome, J., Cramer, W., Christ, R., … & Dubash, N. K. (2014). Climate change 2014: Synthesis report. Contribution of Working Groups I, II and III to the fifth assessment report of the Intergovernmental Panel on Climate Change (p. 151). IPCC.
- Kasischke, E. S., Melack, J. M., & Dobson, M. C. (1997). The use of imaging radars for ecological applications—A review. Remote Sensing of Environment, 59(2), 141-156.
- Kenzo, T., Furutani, R., Hattori, D., Kendawang, J. J., Tanaka, S., Sakurai, K., & Ninomiya, I. (2009). Allometric equations for accurate estimation of above-ground biomass in logged-over tropical rainforests in Sarawak, Malaysia. Journal of forest research, 14(6), 365-372.
- Kiyono, Y., Furuya, N., Sum, T., Umemiya, C., Itoh, E., Araki, M., & Matsumoto, M. (2010). Carbon stock estimation by forest measurement contributing to sustainable forest management in Cambodia. Japan Agricultural Research Quarterly: JARQ, 44(1), 81-92.
- Le Toan, T., Beaudoin, A., Riom, J., & Guyon, D. (1992). Relating forest biomass to SAR data. IEEE Transactions on Geoscience and Remote Sensing, 30(2), 403-411.
- Le Toan, T., Quegan, S., Davidson, M. W. J., Balzter, H., Paillou, P., Papathanassiou, K., … & Ulander, L. (2011). The BIOMASS mission: Mapping global forest biomass to better understand the terrestrial carbon cycle. Remote sensing of environment, 115(11), 2850-2860.
- Lu, D. (2006). The potential and challenge of remote sensing‐based biomass estimation. International journal of remote sensing, 27(7), 1297-1328.
- Lucas, R. M., Mitchell, A. L., Rosenqvist, A. K. E., Proisy, C., Melius, A., & Ticehurst, C. (2007). The potential of L‐band SAR for quantifying mangrove characteristics and change: Case studies from the tropics. Aquatic conservation: Marine and freshwater ecosystems, 17(3), 245-264.
- Luckman, A., Baker, J., Kuplich, T. M., Yanasse, C. D. C. F., & Frery, A. C. (1997). A study of the relationship between radar backscatter and regenerating tropical forest biomass for spaceborne SAR instruments. Remote Sensing of Environment, 60(1), 1-13.
- Maniatis, D., & Mollicone, D. (2010). Options for sampling and stratification for national forest inventories to implement REDD+ under the UNFCCC. Carbon balance and management, 5(1), 9.
- van der Sande, M. T., Poorter, L., Balvanera, P., Kooistra, L., Thonicke, K., Boit, A., … & Kolb, M. (2017). The integration of empirical, remote sensing and modelling approaches enhances insight in the role of biodiversity in climate change mitigation by tropical forests. Current opinion in environmental sustainability, 26, 69-76.
- Mitchard, E. T., Saatchi, S. S., Woodhouse, I. H., Nangendo, G., Ribeiro, N. S., Williams, M., … & Meir, P. (2009). Using satellite radar backscatter to predict above‐ground woody biomass: A consistent relationship across four different African landscapes. Geophysical Research Letters, 36(23).
- Mitchard, E. T., Saatchi, S. S., Lewis, S. L., Feldpausch, T. R., Woodhouse, I. H., Sonké, B., … & Meir, P. (2011). Measuring biomass changes due to woody encroachment and deforestation/degradation in a forest-savanna boundary region of central Africa using multi-temporal L-band radar backscatter. Remote Sensing of Environment, 115(11), 2861-2873.
- Muukkonen, P., & Heiskanen, J. (2007). Biomass estimation over a large area based on standwise forest inventory data and ASTER and MODIS satellite data: A possibility to verify carbon inventories. Remote Sensing of Environment, 107(4), 617-624.
- Page, S., Hoscilo, A., Langner, A., Tansey, K., Siegert, F., Limin, S., & Rieley, J. (2009). Tropical peatland fires in Southeast Asia. In Tropical fire ecology (pp. 263-287). Springer, Berlin, Heidelberg.
- Saatchi, S. S., Harris, N. L., Brown, S., Lefsky, M., Mitchard, E. T., Salas, W., … & Petrova, S. (2011). Benchmark map of forest carbon stocks in tropical regions across three continents. Proceedings of the National Academy of Sciences, 108(24), 9899-9904.
- Shimada, M. (2010). Ortho-rectification and slope correction of SAR data using DEM and its accuracy evaluation. IEEE Journal of Selected Topics in Applied Earth Observations and Remote Sensing, 3(4), 657-671.
- Shimada, M., Isoguchi, O., Tadono, T., & Isono, K. (2009). PALSAR radiometric and geometric calibration. IEEE Transactions on Geoscience and Remote Sensing, 47(12), 3915-3932.
- Skutsch, M., Bird, N., Trines, E., Dutschke, M., Frumhoff, P., De Jong, B. H., … & Murdiyarso, D. (2007). Clearing the way for reducing emissions from tropical deforestation. environmental science & policy, 10(4), 322-334.
- Schoene, D., & Netto, M. (2005). The Kyoto Protocol: What does it mean for forests and forestry?. UNASYLVA-FAO, 56(3), 3.