Historical drought and its trend in South Asia: Spatial and temporal analysis 2000-2020
Highlights
- This research uses open-access satellite products to assess drought conditions in Nepal, Bangladesh, Pakistan, and selected regions of India from 2000 to 2020. Spatial and temporal drought maps are generated using DSI values, which are further utilised to assess the trends and severity of drought.
- Severe droughts are most common in the region during March, April, and May. During the winter months of December, January, and February, significant dryness was predominately observed in the northern and eastern side of South Asia, including Eastern India and Bangladesh.
- Satellite data-based Drought Severity Index calculations have been proven to be a reliable tool for drought monitoring at a regional scale, particularly for countries with insufficient hydro-meteorological datasets.
Introduction
Drought is a silent and pervasive hazard originating from the deficit of water availability, with devastating impacts on agriculture, water supply, and the environment (Popova et al., 2014; Yu et al., 2014), to cause economic losses (Below, Grover-Kopec, & Dilley, 2007; Wilhite, 2000; Wilhite, Svoboda, & Hayes, 2007). Unlike other natural hazards with a smaller geographic scope, these effects have a wider influence. The Intergovernmental Panel on Climate Change (IPCC) has identified South Asia as a global region most sensitive to drought, and consequently, water and food shortage events are expected to increase in frequency (IPCC, 2022). From 2046-2065, the region is expected to experience a rise in temperature of 2-4 degrees Celsius (Walsh et al., 2017). The Sixth Assessment Report of the IPCC has found South Asia as the most food-insecure population in the warming scenario (IPCC, 2022). Therefore, understanding drought to minimise its adverse impacts and to secure food production in South Asia has become more relevant than ever.
A recent study has found that a proper drought monitoring system on a regional scale is unavailable in most South Asian countries (Aadhar & Mishra, 2017). Despite this, individual efforts to assessing drought in South Asia (Aadhar & Mishra, 2017; Abuzar et al., 2017; Carabine et al., 2014; Dahal et al., 2016; Kafle, 2014; Masud, Khaliq, & Wheater, 2015; Miyan, 2015; Shakya & Yamaguchi, 2010; Sigdel & Ikeda, 2010) using different drought indices have taken place. From these previous studies, the most frequent droughts evidenced across South Asian nations are attributed to variations in rainfall volume (i.e., absence), onset, and distribution pattern during the main monsoon season (Hore, Werner, & Maskey, 2019; Imbulana, 2010; Meshram, Gautam, & Kahya, 2018; Miyan, 2015; Regmi, 2010). In India, the 2014–2015 drought, which has a return duration of 542 years (Mishra, Aadhar, Asoka, Pai, & Kumar, 2016), impacted 330 million people and resulted in a severe water shortage. One of the worst occurrences was the 2002-2003 drought, in terms of magnitude, spacing, dispersion, and duration, affecting almost 300 million people in India (Bhat, 2006; Dutta, Kundu, & Patel, 2013; Patel, Parida, Venus, Saha, & Dadhwal, 2012). Pakistan has also endured numerous droughts; the 1999–2000 droughts, which persisted until 2002, impacted an estimated 3.3 million people and caused the national agriculture sector to decline at a -2.6% rate (Ahmad, Hussain, Qureshi, Majeed, & Saleem, 2004). As such, the Pakistani government declared emergency conditions because of severe droughts (Tariq, 2012). In Bangladesh, 19 droughts were recorded between the period of 1960 and 1991. According to (Dey et al., 2011), a severe drought in Bangladesh occurs every 2.5 years on average, impacting 40% of crop production and affecting 53% of the population. In Nepal, the spatial distribution of drought varies; far-western and western regions experience winter drought, whereas pre-monsoon droughts are felt more acutely in the eastern and central regions in comparison (Kafle, 2014). The worst winter drought was experienced in 2008–2009, when the country received less than 50% of its average precipitation (Wang, Yoon, Gillies, & Cho, 2013). Due to this, a 14.5% decline in wheat production and a 17.3% decline in barley production was reported (Report, 2009).
Detecting historical drought patterns will allow researchers to identify the drought-prone areas and quantify the indicators of vulnerability. Drought can be detected, monitored, and evaluated using drought indices that have been developed in the past (Niemeyer, 2008). Drought indices were developed for different objectives, applications, and the spatial coverage of geographical locations (Zargar, Sadiq, Naser, & Khan, 2011). Basic meteorological data, such as precipitation and temperature, were originally used to develop drought indices (Wu et al., 2013), including the Standardised Precipitation Index (SPI) (Mckee, Doesken, & Kleist, 1993), the Palmer Drought Severity Index (PDSI) (Palmer, 1965), and the Moisture Anomaly Index (Z index) (ibid). These indices work successfully at the scale of individual meteorological stations or across geographical regions of homogeneous land cover and similar climatic conditions. However, in places with scattered or absent meteorological data, these indices are insufficient for timely drought detection, monitoring, and decision-making (Brown, Wardlow, Tadesse, Hayes, & Reed, 2008; Son, Chen, Chen, Chang, & Minh, 2012; Unganai & Kogan, 1998).
Satellite remote sensing has been proven to be a capable and reliable tool for monitoring drought in countries with a scarcity of meteorological datasets (Abbas, Nichol, Qamer, & Xu, 2014; Wu et al., 2013), a valuable alternative to station-based data. They are critical to ascertain spatial and temporal drought patterns and trends due to the availability of time-series datasets, the low cost of access, the synoptic view, and the repetition and reliability of data acquisition (Mao, Ma, Xia, Tang, & Han, 2012). Various remotely-sensed drought indices using different satellite products have been developed and used for various applications and purposes (Peng, Deng, Di, & Han, 2015). Recently, regional drought monitoring tools in South Asia have been developed using remote sensing data sets (Aadhar & Mishra, 2017) . However, these applications have only utilised precipitation related data products, or only vegetation indices-related data products (Aboelghar et al., 2010; Kundu & Dutta, 2011; Mondal et al., 2014), which does not predict drought accurately across different land cover situations. Topographical complexity and scarcity of meteorological data are significant factors affecting the proper delineation of drought-prone areas in the South Asian region, therefore, integrating multiple variables from remotely sensed platforms and in-situ climate data is necessary to improve current drought assessment and monitoring systems. In this study, we have used the Drought Severity Index (DSI) (Mu, Zhao, Kimball, Mcdowell, & Running, 2013; Zhang & Yamaguchi, 2014), a remote sensing-based method applying evapotranspiration, potential-evapotranspiration, and vegetation index products to detect historical drought conditions at a regional scale. The main objective of our research is to examine the characteristics of long-term meteorological drought to understand its severity, frequency, and trends in South Asia under various climatic conditions and seasonal fluctuations. The timing and duration of drought have been studied, and outcomes from satellite datasets have been examined with field-based drought indices in Nepal and Bangladesh. The government agencies and other parties involved in designing drought mitigation initiatives would benefit from this knowledge. Furthermore, stakeholders can better prepare for regional shifts in actual and realised crop output under the stress of future climatic changes by understanding the spatial and temporal patterns of drought sensitivity for crops systems.
Study area
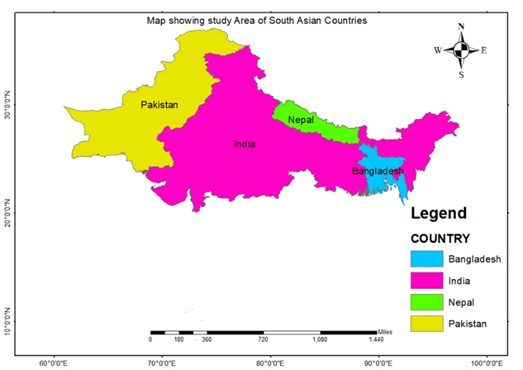
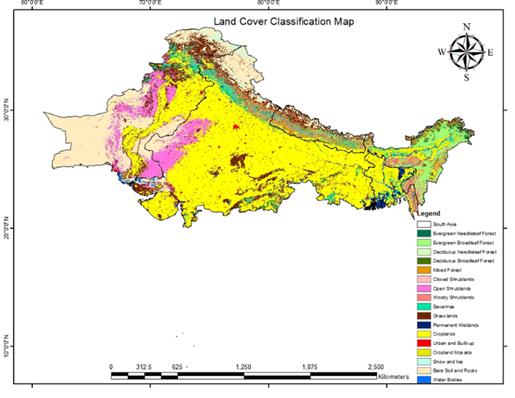
The study area comprises of Nepal, and selected regions of India, Pakistan, and Bangladesh, as shown in Figure 1. The land cover type data was obtained from MODIS Combined Terra+Aqua products, specifically MCD12Q1 data (collection v005, 500m) retrieved from the open-access National Aeronautics and Space Administration (NASA) Earth Data repository (https://earthdata.nasa.gov) for the 2000-2020. According to the International Geosphere-Biosphere Programme (IGBP) land cover classes (IGBP, 2017), including forests, croplands, wetlands, open shrublands, closed shrublands, grasslands, urban and built-up areas, bare soil, and roads, as shown in Figure 2. Altitudinal and climatic differences also exist in the study area.
Methodology
Remotely sensed data
In the study, eight days of composited reflectance data from the MODIS sensor has been retrieved from NASA and the United States Geological Survey (USGS), via the Earth Resources Observation and Science (EROS) centre (Justice et al., 1998). MODIS products of Landcover, Normalised Difference Vegetation Index (NDVI), and evapotranspiration/potential evapotranspiration (ET/PET) have been used for this study. The use of NDVI in this study is due to the potential of this product to link climate changes with vegetation responses (Xu et al., 2011).
MODIS Landcover Data
The land cover type data was derived from time series 2000-2020 MCD12Q1 data (collection v005, 500m), obtained from the MODIS Combined Terra+Aqua products on the open-access NASA Earth Data repository (https://earthdata.nasa.gov). Land cover was classified into 17 categories and later merged into eight categories: forests, savannas, grasslands, cropland, urban and built-up lands, barren, and water bodies (IGBP, 2017). Cropland was identified by at least 60% coverage of cultivated land and a mosaic of 40-60% small-scale cultivation with natural trees, shrubs, or herbaceous vegetation (IGBP, 2017).
MODIS ET, PET, and NDVI Data
The initial remote sensing data set included 8-day MOD16A2 Gap-Filled ET, PET, and MOD13A1 NDVI products at 500m spatial resolution for twenty-one years (2000-2020). The ET, PET, and NDVI datasets were obtained from the NASA Earth Data repository (https://earthdata.nasa.gov/), and the NASA Land Processes Distributed Active Archive Centre (LP DAAC, https://lpdaac.usgs.gov/).
Drought Severity Index (DSI)
According to Mu et al. (2013), the DSI Index, which combines the NDVI and ET/PET, is calculated as shown in Equation 1 to Equation 4. Incorporating transpiration and vegetation indicator data in DSI has been regarded as an improvement over other drought indices. To study historical drought in South Asia, monthly DSI values were calculated over twenty-one years (2000–2020). To identify the spatial distributions of drought, the mean monthly DSI values of South Asia and a few countries of South Asia were calculated separately. Following are the equation systems that were used:
1
\(Z_{Ratio\;}=\frac{ET/PET-\;\underline{ET/PET}}{\sigma_{ET/PET}}\)2
\(Z_{NDVI}=\frac{NDVI – \underline{NDVI}}{\sigma_{NDVI}}\)3
\(Z=\;Z_{Ratio\;}+\;Z_{NDVI}\)4
\(\;DSI=\;\frac{Z-\underset\_Z}{\sigma_Z}\)
Where \(Z_{Ratio\;}\;\) and \(Z_{NDVI}\) is the standardized value of ET/PET ratio and NDVI, respectively. \(\underline{ET/PET\;}\) and \(\underline{NDVI}\) is the mean, and \(\sigma_{Ratio}\) and \(\sigma_{NDVI}\) is the standard deviation of ET/PET ratio and NDVI, respectively. \(\underline{Z}\) and \(\sigma_Z\) represents the mean and standard deviation of the sum of \(Z_{Ratio\;}\;\) and \(Z_{NDVI}\) respectively. The Drought Severity Index is represented by the DSI calculated in Equation 4. The positive value of DSI represents wet conditions, while the negative value of DSI shows dry conditions. Mu et al. (2013) classified the values of DSI into categories of drought severity, as shown in Table 1.
|
Category |
DSI Value |
|---|---|
|
Extremely wet |
1.5 or greater |
|
Very wet |
1.2 to 1.49 |
|
Moderately wet |
0.9 to 1.19 |
|
Slightly wet |
0.6 to 0.89 |
|
Incipient wet spell |
0.3 to 0.59 |
|
Near normal |
0.29 to -0.29 |
|
Incipient drought |
-0.3 to -0.59 |
|
Mild drought |
-0.6 to -0.89 |
|
Moderate drought |
-0.9 to -1.19 |
|
Severe drought |
-1.2 to -1.49 |
|
Extreme drought |
-1.5 or less |
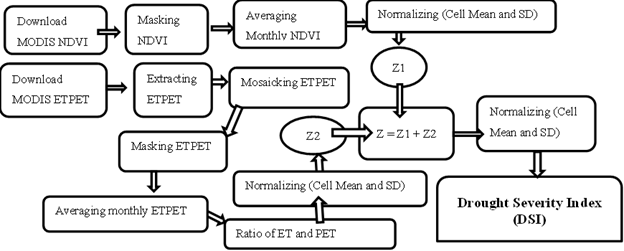
Detailed calculation steps of DSI with the process of satellite data product download and processing has been shown in Figure 3.
Standardised Precipitation Index (SPI)
SPI is the measure of standard deviations that the observed mean precipitation deviates from the long-term mean precipitation (Mckee et al., 1993), as defined in Equation 5. The input parameter is monthly precipitation data, and the index can be calculated for multiple timescales (1, 3, 4, 6, 9, 12, and 24 months). SPI was endorsed as a primary meteorological drought index by the World Meteorological Organisation (WMO) in 2009 (Hayes, 2011) and is widely used for early drought detection.
5
\(SPI\;=\;\frac{P-P\ast}\sigma\)
In which \(P\) is the total precipitation, \(P\ast\) is the mean precipitation, and \(\sigma\) is the standard deviation. Monthly SPI (SPI1) and three-monthly SPI (SPI3) have been calculated for the available meteorological data of Nepal and Bangladesh.
Results and discussion
Mean monthly DSI values of South Asia
The long-term average monthly DSI values for South Asia from 2000 to 2020 have been shown in Figure 4. The X-axis shows the time period, while DSI values are shown on the Y-axis. Positive DSI levels indicate wet conditions, whereas negative values denote drought conditions (Mu et al., 2013). The lowest mean monthly DSI value of -1.01 was reported in April 2001, suggesting severe drought conditions during the studied period (2000-2020). The lowest DSI values in the winter months were in January 2001, with a mean monthly DSI value of -0.63, showing a mild drought condition. We have also found long-term drought episodes for a continuous five-month period in 2000, 2001, and 2012. Most drought occurrences were in the pre-monsoon season (March, April, and May) in each year of the studied period except 2003, 2006, 2013, and 2019. There were no drought episodes in any month of 2020. The least drought-affected years were determined to be 2007, 2014, 2015, and 2019 with no instances of extremely dry circumstances, in reference to DSI values.
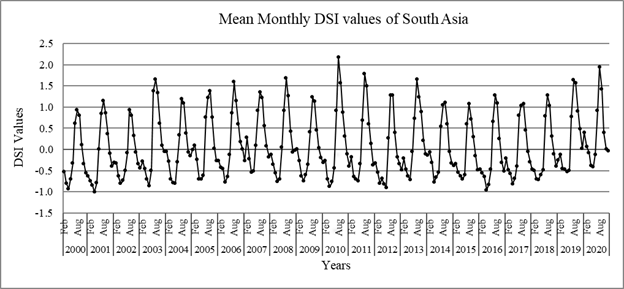
According to the average DSI values of South Asia, the summer months of March to May appear to be drought-prone. This may occasionally stretch into June. However, compared to the summer months, the winter months were less affected by the drought except during January 2001 and February 2000, 2001, 2012, 2016, and 2018. Compared to other years, 2007, 2019, and 2020 had relatively more precipitation, indicating wet conditions across South Asia.
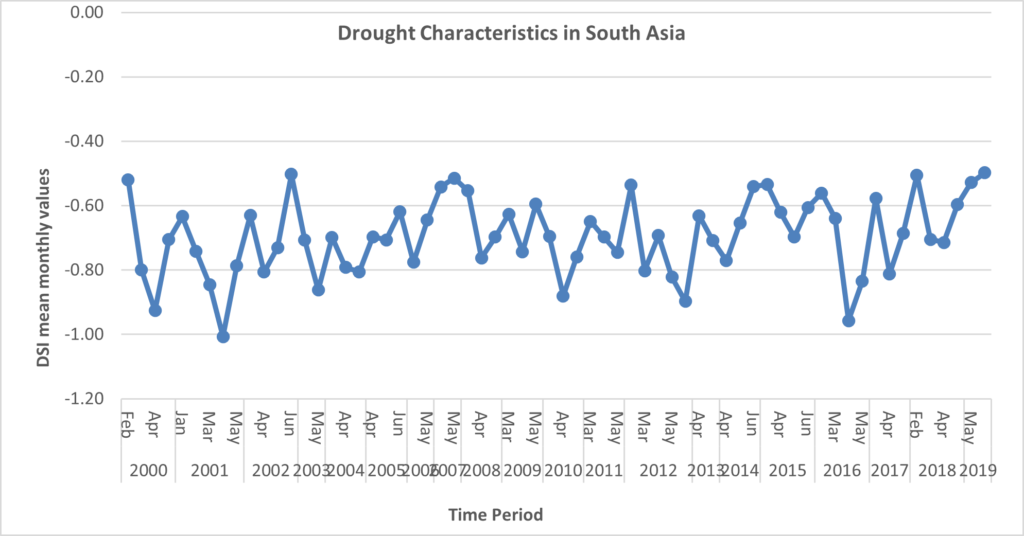
Mean monthly DSI values of drought months in South Asia
Mean monthly DSI values of the drought months in each year were analysed to study the characteristics of the historical drought in South Asia (Figure 5). The X-axis represents the drought months each year from 2000 to 2019, as 2020 was the wettest year in the past 20 years. Y-axis represents the mean DSI values across South Asia. According to our results, the onset of drought is often observed from March. On occasion, during drier years, the onset of drought conditions may be observed from February. The severity of drought is observed to peak in April, and the cessation of drought is often observed in June. However, in some years, it has been recorded in the month of July. This phenomenon is spatially variable across different parts of South Asia. Drought onset is seen mainly from the eastern part of South Asia, and gradually moving towards the western part. Similarly, the cessation of drought is attributed to the monsoonal rain, originating from the eastern part of South Asia.
Spatial and temporal distribution of drought
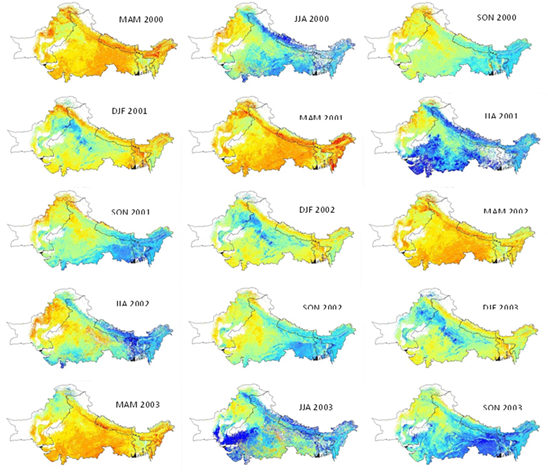
Drought maps of the studied area from the months of January to December in different drought years, as explained above, are shown in Figure 6. These maps represent the characteristics and severity of drought in different locations in South Asia. In the month of March (Figure 6c), the eastern region of South Asia had severe to moderate drought for most of the research period. After that, the drought moved to the west, creating severe to moderate drought in April (Figure 6d) in southern Nepal and northern India. In May (Figure 6e), the location of the drought struck once more, this time in the west, impacting southern Nepal, northern India, and the south-eastern region of Pakistan. While the north-western region of South Asia continues to experience a moderate to mild drought, the eastern region receives rain in June (Figure 6f).
As the monsoon continues, the study area becomes moist, except for Pakistan’s western region, which experiences an early drought. Almost all of South Asia experienced rain in August (Figure 6h) and September (Figure 6i). The post-monsoon months of October (Figure 6j) and November (Figure 6k) are primarily moist in the east. In contrast, the north-western section of the research region is found to be in severe to impending categories of drought. Meanwhile, moderate to mild drought conditions persisted throughout South Asia in December (Figure 6l). The eastern portion of the continent saw severe to mild drought conditions in January (Figure 6a) and February (Figure 6b), mostly in eastern India and Bangladesh. The most notable drought in the investigated era, affecting all South Asian countries, occurred in April (Figure 6d) and May (Figure 6e). In these months, both people and the environment were affected by drought.
Seasonal drought variation in South Asia
For the seasonal analysis of drought, the DSI was averaged to DJF (December-January-February) as shown in Figure 7d for winter, MAM (March-April-May) (Figure 7a) for pre-monsoon, JJA (June-July-August) (Figure 7b) for monsoon, and SON (September-October-November) (Figure 7c) for post-monsoon seasons.
Pre-monsoon season (MAM) is when droughts are most prevalent, ranging from severe to moderate. As rainfall becomes more readily available during monsoon season (JJA), the severity of the droughts gradually decreases. Similar to the post-monsoon SON season, eastern part of South Asia is remains moist, with a developing drought in the northwest of the study region. Most of the eastern part of South Asia, including eastern India and Bangladesh, and certain regions of the northern belt of South Asia, experience considerable dryness during the DJF cold season. In MAM, severe signs of drought dominated, which often impacted water sources and farmlands. In comparison to the classification of land cover, South Asia’s farmland is more affected by droughts in MAM. Long-term farmland dryness during the pre-monsoon season can impact the nation’s agricultural growth and productivity.
The results indicate longer drought episodes during December 2000 to May 2001 in Nepal, April, May, June, and July 2002 in Pakistan, and December 2000 to April 2001 in Bangladesh. These types of drought occurrences could impact the region’s agriculture, thereby seriously reducing crop yield and threatening food security for people. Similar results were shown in a study from Ahmad et al. (2004), which reports that a severe drought episode during 2000–2001 had a substantial impact on the growth rate of crop plants, declining by 2.6%, compared to a positive growth rate of 1.4% during 2001–2002 in Pakistan.Adnan, Ullah, and Shouting (2016) also identified severe drought in south-central Asia in 2000, including Pakistan. According to previous research (Ramamasy & Baas, 2007; Shahid & Behrawan, 2008), droughts affected around 2.3 million hectares of Bangladesh’s agricultural land from April to September 2001, and 1.2 million ha of cropland from October to March 2001, resulting in an annual production loss of 1.5 million tons. The severe drought occurrences in Bangladesh from December 2000 to April 2001 are consistent with studies from Raghib et al. (2010). Our findings on drought using the DSI index in Nepal were also consistent with the study by Adhikari (2018), which shows the impact of drought on the agriculture and hil farming system in various areas of Nepal in the years 2002, 2008, 2009, 2012, 2013, and 2015.
Comparison of DSI values with SPI in Nepal and Bangladesh
Monthly SPI values of 24 meteorological stations in Bangladesh and 59 meteorological stations in Nepal were compared with DSI values from the same latitude/longitude of each meteorological station. The line graphs of SPI and DSI values of four stations in Bangladesh (Figure 8a, b, c, d) and four stations in Nepal (Figure 8e, f, g, h) are shown below.
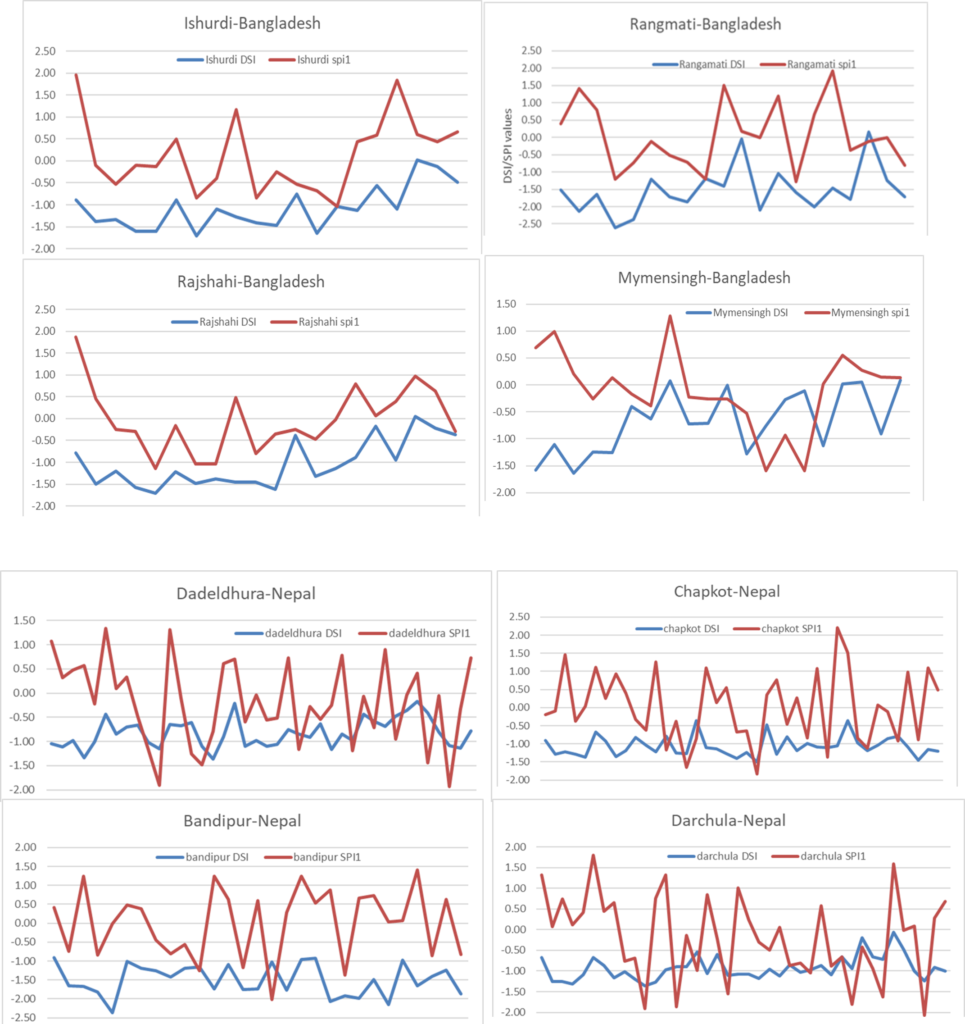
As indicated from the graphs, we found a similar trend of SPI and DSI values in some stations. However, there were different trends and values in some years. These could be due to the different land cover designations of the geographical area. It can also be assumed that each DSI value is the average value of each land cover within the MODIS 500m*500m data tile. Conversely, the SPI value of each station indicates the point location where the meteorological station was situated, whereby SPI values could be influenced by irrigation facilities on the field. As DSI calculations do not utilise precipitation value, the area with an irrigation facility will be moist, although the precipitation value of that location is very minimal. In this case, we can identify severe drought from SPI calculation. Therefore, the occurrence of drought due to anthropogenic causes will not be captured by SPI values.
Conclusion
One of the key elements influencing the nation’s agricultural growth is found to be drought, as shown in this study of historical drought of South Asia from 2000-2020 using open-access satellite data products. Drought severity maps of each month and season in drought periods demonstrate that past drought experiences substantially influenced South Asia. The most severe drought events investigated, affecting all South Asian countries, occurred in 2000, 2001, 2004, 2010, 2012, and 2016. These years had notable drought occurrences that affected people and the environment for several months. Severity of drought in these years could also be due to the El Nino-Southern Oscillation (ENSO), since the occurence of ENSO was found to be in the years 2002, 2004, 2006, 2010, and 2016.
In most of the selected study areas, severe to moderate drought was identified from March to May in the years 2000, 2001, 2002, 2004, 2009, 2010, 2011, 2012, 2016, and 2018. DSI value characterisation of different countries resulted in significant drought events in different periods; for instance, in Bangladesh, the extreme drought events took place in February, in Nepal, it was during March-April-May, and in Pakistan, during April-May-June. Moreover, severe to moderate drought occurrences were most prevalent during South Asia’s pre-monsoon season (MAM). During the monsoon season (JJA), when rainfall is more frequent, the severity of the droughts gradually diminishes. Similar to the post-monsoon SON season, eastern parts of South Asia was still damp, with a small area that may soon see dryness. During the DJF cold season, the majority of the eastern parts of South Asia, including eastern India and Bangladesh, and some areas of the northern belt of South Asia experienced significant dryness. Furthermore, western and north-western regions of Nepal, eastern and central-southern parts of India, the south-eastern region of Bangladesh, and southern parts of Pakistan were likely to have long-term drought risk.
A comparison between the monthly DSI values and the monthly SPI values in Nepal and Bangladesh showed a similar trend in some places. Varied values and trends among SPI and DSI values were attributed to differing land cover types, irrigation facilities, and the presence of vegetation. This result demonstrates that SPI captures the occurrence of drought due to natural causes or precipitation. On the other hand, drought caused by anthropogenic factors and also natural factors are captured by DSI. The results demonstrate that the monitoring of past and present drought is possible using DSI on a regional scale, with no availability of meteorological stations.
Mitigating drought is essential, and investigating historical drought experiences can be quite helpful in this regard. The economic effects of droughts have not been adequately quantified, and policymakers frequently fail to take preventive measures to prepare for them. Additionally, population growth, urbanisation, water consumption trends, governmental policy, social behaviour, and environmental factors affect society’s susceptibility to drought. The vulnerability of society to drought may increase or decrease as a result of these components. An assessment of likely corrective actions to prevent the negative impact of drought should be produced.
This study’s analysis of the historical drought episodes between 2000 and 2020 can aid in monitoring droughts in South Asia. Future research may concentrate on the interaction between other climatic and topographic variables influencing drought. Moreover, various insitu data-gathering methods might be used for field validation.
Acknowledgement
We are very grateful to Asia-Pacific Network for Global Change Research (APN) for funding this work. Our gratitude goes to all the collaborators, researchers, program managers, field data collectors and technical supervisors for their continuous support and feedback in this research. We would also like to thank the Centre for Water and Atmospheric Research, Kathmandu Institute of Applied Sciences for giving us office space, needed instruments and administrative support to carry out this research work.