Evaluation of best management practices with greenhouse gas benefits for salt-affected paddy soils in South Asia
Keywords
Agriculture · Climate change · Greenhouse gas emissions · Management practices · Salinity
Highlights
- Both organic and inorganic amendments can variably increase greenhouse gas emissions in salt-affected soils.
- Organic amendments could improve the soil conditions, and yield in salt-affected sites when combined with proper water management and other agronomic practices.
- Transplanting seedlings help minimize yield loss in saline soils compared to broadcast seeding.
1. Introduction
South Asia is responsible for about one-third of the global rice production and about one-fifth of the global wheat production among a variety of other crops (Food and Agriculture Organization [FAO], 2015). However, food security in the region is affected due to unfavourable impacts of climate change, including land degradation, and increased salinity in agricultural soils has been a significant concern. The agricultural areas within the countries in the region are variably affected by saltwater intrusion due to sea-level rise and certain irrigation practices.
A significant part of agricultural lands in this region, particularly in Bangladesh, India, Pakistan, and Sri Lanka are already witnessing soil salinity as the major challenge for crop production. In Sri Lanka, about 0.1 million ha of paddy lands are affected by salinity (De Alwis & Panabokke, 1972), and coastal salinity mainly exists in districts of Mannar, Puttalam, Jaffna, Trincomalee, Ampara, Hambantota, Galle, Kalutara and Matara (Senanayake, Herath, Wickramesinghe, Udawela, & Sirisena, 2017). India has 6.73 Mha salt-affected soil, including in coastal areas, of which 2.5 Mha lies in the Indo-Gangetic plain (IGP) (Singh, Arora, Mishra, Dixit, & Gupta, 2019). In Bangladesh, about 30% of the arable land is in the coastal zone, of which about 1.2 Mha soil has become saline (Islam, Salambr, Hassanbr, Collardbr, & Gregorio, 2011). Salinity intrusion in Bangladesh is also partly due to the conversion of cropland to shrimp farming and overexploitation of natural resources.
Soil salinity is one of the most devastating environmental stresses, which causes a significant reduction in cultivated land area, productivity and quality (Shahbaz & Ashraf, 2013). Saline soil is defined as soil having an electrical conductivity of more than 4 dS/m in the saturation soil extract at 25°C (Richards, 1954), which is equivalent to ~0.3 dS/m in 1:5 (soil:water) extract (Dharmakeerthi, Indrarathne, & Kumaragamage, 2007). Apart from yield reduction, excess salt interferes with the microbial activity and thus, microbe-mediated soil processes are also affected (Tejada, Garcia, Gonzalez, & Hernandez, 2006). Salt concentration may have significant effects on emissions of GHGs, including nitrous oxide (N2O) and carbon dioxide (CO2) (Setia, Marschner, Baldock, Chittleborough, & Verma, 2011).
Crop production, especially the production of rice, which serves as the staple food in the region, has already been severely affected by soil salinity. In this study, we mostly focused on management practices that could ameliorate coastal salinity caused by saltwater intrusion due to sea-level rise, while minimizing GHG emissions in the rice cropping systems. Further, inland salinity was considered for some critical salinity-affected regions such as the IGP.
Management practices could significantly impact GHG emissions from agricultural soils (Lokupitiya & Paustian, 2006). Currently, countries in the region have adopted a range of salinity management practices including salt-tolerant varieties, irrigation water management, crop intensification, and other changes in cropping patterns (i.e. double cropping) and tillage practices, in addressing salinity issues (Sirisena, Rathnayake, & Herath, 2010; Abedin & Shaw, 2013). Recent studies indicate that certain cultivation systems and management practices could help the soil to act as a significant GHG sink (Pandey, Agrawal, & Bohra, 2013). However, remedial measures adopted in salinity-affected soil could enhance or feedback on future climate change if they cause high levels of net GHG emissions.
The intensification of rice cultivation to meet the needs of the population each year may contribute about 1-2% to the observed gradual increase of atmospheric methane (CH4) mixing ratio (Rasmussen & Khali, 1981). Similarly, the fertilizer use and other management options can lead to variation in the emissions of other GHGs, including N2O and CO2. Therefore, the main objective of the current study was to identify the best agronomic practices causing the lowest levels of GHG emissions and best yields in salinity reclaimed land in the respective countries of the South Asian Region.
2. Methodology
The available information on coastal agricultural areas facing salinity problem in Bangladesh, India, Pakistan, and Sri Lanka, were collected using published scientific literature, reports and other data sources from Governmental and Non-Governmental Organizations. The information collected was analyzed considering the spatial scale of the problem, history and degree of salinity information, and crops and cropping practices affected (with particular emphasis on rice crops), and any land-use changes due to salinity problems. The salt-affected sites for this study were selected based on such available information, including available maps. Site-level measurements on the relevant parameters were conducted (i.e. soil carbon content, electrical conductivity, pH, temperature, etc.), and in-person surveys were conducted to supplement the existing data available within each country.
Existing information, including the agricultural statistics and information obtained from the officers at the Agricultural Extension Services, were used to collect information on the management practices and socioeconomic data in selected regions and sites in each country. Farmer surveys were executed to obtain relevant information in the selected study areas. The data collected included the location, crop management practices, geophysical variables (e.g. soil type, geographical coordinates) salinity, crop yields and other socioeconomic data including any information on the costs, crop price, farmer income, and fertilizer use, etc.). The farmers’ perception of the problem, level of acceptance concerning the adoption of different new management techniques, including advantages and disadvantages, were also documented and studied. The collected data was analyzed both statistically and qualitatively.
2.1 Estimation of GHG emissions (including soil carbon)
Greenhouse gas emissions were measured/estimated using field plots with the chosen BMPs in the respective rice-growing areas within each country. Soil carbon stocks were measured for paired comparison (saline vs non-saline soils and before and after remedial management practices). Similarly, closed-chamber measurements (Hutchinson & Livingston, 1993) of CH4, N2O, and CO2, the three main GHGs emitted from rice paddies, were taken and analyzed using gas chromatography. The number of seasons and sites sampled varied by country, depending on in-country situations, including weather impacts. The collected GHG emission data was analyzed statistically for any significant emission differences with and without the adoption of the chosen BMPs.
2.2 Selected sites and country-specific methodological information
This paper mostly focuses on findings from two of the collaborating countries (India and Sri Lanka), based on the outcome available by the end of the project. The site- and specific methodological information relevant to those countries are given below.
2.2.1 India
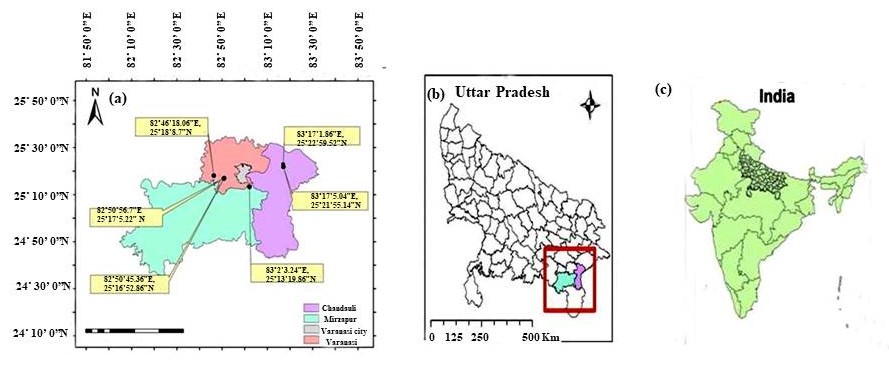
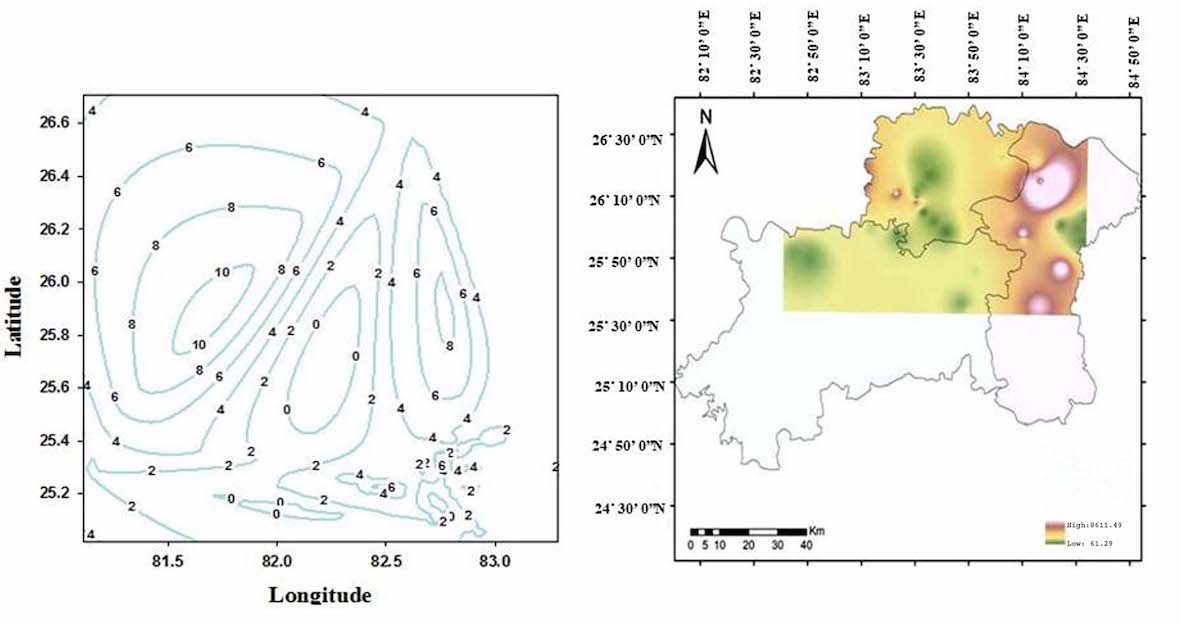
Soil samples were collected from a stretch of over 200 km where the salinity-affected land was reclaimed using various agronomic strategies (e.g. organic manure, inorganic N and gypsum salt); then pH, conductivity, cation exchange capacity (CEC), sodium absorption ratio (SAR) were measured. Exchangeable sodium percentage (ESP) were quantified to rank the sites based on the level of salinity. The contour mapping was done to make the salinity level at geographical grids more apparent. Of the mapped sites, six reclaimed land areas were selected for further study (Figures 1 and 2); i.e. Rajatalab (RJT) and Beerbhanpur (BBN) with lower salinity and Mirzamurad (MZM), Baraipur (BRP), Salaempur (SLM) and Dharahara (DHR) with higher salinity (Table 1).
| Site | Clay (%) | EC (dS cm-1) | Fertilizers used | Irrigation | Cation | Cropping sequence |
| Rajatalab (RJT) | 8 | 0.19 | Organic fertilizer | Underground aquifer | K>Mg>Na>Ca | Rice-wheat |
| Beerbhanpur (BBN) | 11 | 0.34 | Mainly chemical | Underground aquifer | Ca>Mg>K>Na | Rice-wheat |
| Mirzamurad (MZM) | 12 | 0.50 | Organic + Chemical | Canal irrigation | Ca>K>Mg>Na | Rice-mustard |
| Raipur (BRP) | 8 | 1.35 | Mainly chemical | Canal irrigation | Ca>Mg>K>Na | Rice-wheat |
| Dharhara (DHR) | 10 | 1.65 | Mainly organic | Canal irrigation | Ca>K>Na>Mg | Rice-fallow |
| Salaempur (SLM) | 12 | 2.52 | Mainly chemical | Canal irrigation | Ca>K>Na>Mg | Rice-wheat |
Table 1. Characterization of selected sites in India.
Soil parameters including pH, EC (in 1:5 soil:water extract), texture, and total organic carbon (Walkley & Black, 1934) were assessed and CEC was measured using ammonium acetate as the cation extractant. The exchangeable cations were then assessed by using an Atomic absorption spectrophotometer (Model Analyst 800, Perkin–Elmer, USA). Cation exchange capacity, SAR, ESP and Exchangeable sodium ratio (ESR) were calculated using a standard formula from exchangeable cations (Harron, Webster, & Cairns, 1983). Total cation concentrations were analyzed with the Atomic absorption spectrophotometer after diacid digestion with a 4:9 ratio of perchloric acid and nitric acid. Anions were estimated by ion chromatography. One-way ANOVA was used to test any differences in sample parameters across the selected sites. The statistical analysis of all data was performed using SPSS (Version 16.0).
2.2.2 Sri Lanka
The salinity levels in several salinity-affected areas of both wet and dry zones of Sri Lanka were measured using soil samples collected at randomly selected sampling locations. Areas of salinity-affected paddy soils in Jaffna and Mannar districts of the Northern Dry Zone of Sri Lanka were identified with the aid of Department of Agriculture, Sri Lanka. Soil samples were collected in the identified locations and tested for soil texture, pH, and electrical conductivity (EC; in 1:5 soil:water extract). Electrical conductivity values were recorded to construct thematic maps of soil salinity. District-wise maps of soil salinity were prepared using ArcGIS 10.0. These maps will be further improved to indicate the different levels of salinity (Table 2).
| 1:5 (soil: water) | Saturate extract | Effect |
| <0.15 | >2.0 | Non-saline |
| 0.16 – 0.30 | 2 – 4 | Slightly saline |
| 0.31 – 0.60 | 4 – 8 | Moderately saline |
| 0.61 – 1.20 | 8 – 16 | Very saline |
| >1.20 | >16 | Highly saline |
Table 2. Salinity ranking based on measured EC (dS m-1) for paddy soils. (Source: RRDC, 2013)
Soil samples were collected from selected sites in 5 districts in the Wet Zone of Sri Lanka (Table 3). Each site was visited twice a month in two-week intervals and 6 soil samples were collected randomly from each paddy site.
| District | Site locations* | ||
| Colombo | Kahapola | ||
| Gampaha | Katana | ||
| Kalutara | Walagedara | Iththapana | Paadagoda |
| Galle | Bentota
Ambalangoda |
Ranthotuwila Ahungalla |
Weragoda Gonapinuwala |
| Matara | Dickwella | Godagama | Mirissa |
Table 3. The sampling sites in the Wet Zone districts of Sri Lanka.
*Each location had up to two sites.
Statistical analyses (i.e. two-sample t-tests) were carried out using Minitab Version 18.0 for comparison of saline vs non-saline sites and the salinity levels during the wet period vs dry period at each site. Socioeconomic data was collected from farmers using a questionnaire survey.
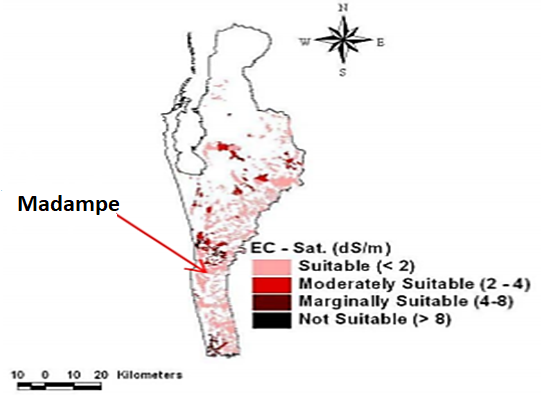
The paddy cultivation was dramatically affected by the alternating droughts and floods in the country, and Sri Lanka was ranked second under the Global Climate Risk Index in 2019. The prevailing weather delayed project initiation, and by far the GHG measurements and gas chromatography analyses under different BMPs (along with soil carbon and bulk density measurements) could be conducted at only two sites (Table 4; Figure 3 shows the salinity map relevant to Puttalam District and the site in Madampe). A significant number of sites were surveyed for measuring salinity for map construction during the study period, as described above.
| Soil physicochemical properties | Madampe1 | Mannar2 |
| Bulk density | 0.98 g/cm3 | 1.23 g/cm3 |
| pH | 3-4 | 5.5-7.5 |
| Soil organic carbon content | 0.46% | 0.54% |
| Electrical Conductivity (EC; saturated) | 3-4 | 3-4 |
Table 4. Soil physicochemical properties (0 cm to 15 cm depth) at the beginning of the project at the two experimental sites in dry areas of Sri Lanka, used for GHG measurements. (1) Madampe site (7.4972°N, 79.8413°E) is located on the western coast of Sri Lanka in the intermediate zone with an annual rainfall of 1500-2000mm; (2) Mannar site (8.7748°N, 79.9891°E) is located on the northern coast of the dry zone of Sri Lanka 1-with an annual rainfall of 1000-1250mm in Maha season.
Greenhouse gas measurements in field plots under different BMPs
Field plots at the selected sites were provided with a combination of different treatments (i.e. a combination of management practices, including one control). The combination of management practices considered the water level until milking (2 cm to 3 cm, intermittent; regular [control]), organic matter (OM) addition (with or without OM), and method of seedling establishment (transplanting seedlings vs. broadcast seeding) (Table 5). Newly improved saline tolerant variety BG 310, which has a response for salinity levels up to 8 dSm-1, was estimated in the field plots of the relevant sites. The average crop duration was 100 days. After proper ploughing, puddling and levelling (at the same time compost was also mixed with the soil for the relevant plots), 28-day old seedlings were manually transplanted at a density of 2 seedlings per hill with a spacing of 15 cm x 10 cm (row-to-row and plant-to-plant). All of the field plots were uniform and had the same dimensions (4 m x 5 m). Pest management and weed management were carried out, as needed.
| Agronomic Practice | Mgt* 1 (a) | Mgt 2 (b) | Mgt 3 (c) | Control (d) |
| Water level until milking | 2-3 cm | 2-3 cm | intermittent | regular |
| Organic matter addition | Yes | Yes | Yes | No |
| Broadcast seeding (B) or transplanting (T) | B | T | T | B |
Table 5. Experimental design showing the combination of practices under the different management options considered.
* Management (Mgt 1, Mgt 2 and Mgt 3) are the management options with different combinations of practices as given, considered against the control plots.
Gas sampling and estimation
Closed chamber method was used to collect gas samples from field plots. The temperature inside the chamber was measured at every sampling. Samples were collected using a 20 ml syringe at 0-minute, 30-minute and 1-hour intervals (between 11 am to 12 noon weekly). Collected gas samples were analyzed using gas chromatography (Shimadzu Model 9 AM) equipped with a flame ionization detector (FID) and thermal capture detector (TCD).
Socioeconomic analysis
Socioeconomic data, including information on costs, crop price, farmer income, and fertilizer use, etc., was collected via questionnaire surveys from the farmers in the neighbouring areas of the salinity-affected sites. The information, along with the farmers’ perception of the problem, the level of acceptance concerning the adoption of the new management techniques, etc., were collected from a total of 75 respondents. The percentage of respondents falling under the different options for the questions given in the questionnaire survey was analyzed.
Plant growth analysis
Plant growth parameters (leaf area, leaf number and tiller number) were measured at weekly intervals. Leaf area was measured with a portable laser leaf area meter (Model LI 3000C, USA). The plot-level rice yield was determined by harvesting at the end of the season.
3. Results and Discussion
3.1 Findings relevant to the study sites in India
In India, rainfall was higher in 2018 than in 2017, but the temperature was uniformly high. Thus, more of the underground aquifer or open canal water was used for irrigation in 2018. Based on the EC and soil sodium concentration, the highest salinity was recorded at SLM followed by DHR, BRP, MZM and BBN and the lowest was found in RJT. In the high salinity areas, canal irrigation is predominant, which probably led to an upward movement of salt by rising groundwater, which is caused due to over-irrigation of the fields. High rainfall in 2018 caused water-logged conditions in high clay containing soil of MZM, SLM and DHR, which resulted in the appearance of secondary salinization. Significant increases in rainfall led to increases in leaching, loss of nutrients and increasing acidification depending upon the buffering pool in soils (Karmakar, Das, Dutta, & Rakshit, 2016). MZM showed an increase in sodium (Na) at harvest in 2017 and 2018, while at SLM, Na decreased at harvest in 2017 and increased in 2018 (Figures 3.1 and 3.2). This suggests that poor field drainage even with good rainfall can lead to accumulation of ions thus contributing to salinity. High sulphate ion levels at SLM could be due to the addition of gypsum or pyrite (Figures 4 and 5).
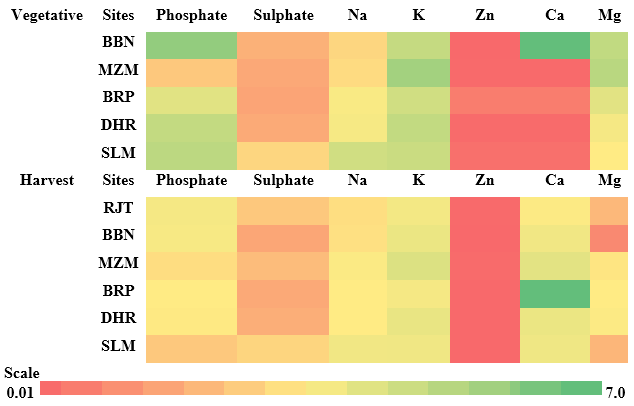
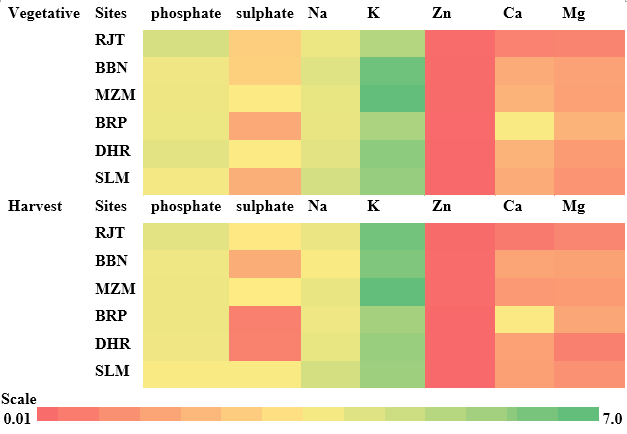
The pH was maximum at SLM followed by DHR and the minimum was at BBN in both 2017 and 2018. The EC of high saline soil was higher during harvest compared to the early stages of growth. On the other hand, at low to medium saline soils, there were no changes in EC. This change reflects the impact of malpractices (untimely addition of inorganic nutrients especially urea) during cultivation in high saline soil.
3.1.1 Greenhouse gas emissions in Indian sites
Sites with low to medium salinity (RJT, MZM and BRP) acted as a source of N2O during vegetative growth in standing water during rice cultivation. Maximum N2O emissions were observed at MZM, where maximum clay was observed, and underground aquifer was the source of irrigation resulting in water-logged conditions. Urea and NH4+ fertilizer are majorly applied, resulting in higher N2O emissions under saturated conditions (Tenuta & Beauchamp, 2003). More nitrogen was applied on sites with medium to high salinity to get a better yield. N-fertilizer application during reproductive stage onset led to N2O emissions at all sites except SLM, with a maximum observed at BRP, which had medium salinity. Nitrous oxide emissions were observed at RJT during all the growth stages (except vegetative stage) which could be due to nitrification by soil microbes.
CO2 remained positive for most of the duration of rice cultivation and there were no temporal trends. Low saline site (RJT) with high organic carbon, released less CO2 during the vegetative stage owing to higher utilization efficiency of plants growing under low salinity as well as the waterlogged anaerobic environment created for rice transplantation. Fertilizer application also improves microbial activities resulting in pulses of CO2 emissions as observed during the pre-reproductive stage upon N-application except at medium saline sites (BBN and BRP), where the peak was instead achieved at the reproductive stage due to poor drainage of the soil. High salinity reduced the utilization efficiency of rice, and thus more input of organic matter and N-fertilizer at saline sites resulted in greater CO2 emissions.
The sites with low to medium salinity majorly acted as a sink of CH4 except at the pre-reproductive stage at RJT. The increase in CO2 at low (RJT) and medium (BBN) sites offsets the CH4 increase during vegetative growth. High saline soil (SLM) consistently acted as a source of CH4 except during the reproductive stage whereas the least saline soil only acted as a source of CH4 during the pre-reproductive stage. High saline soil (DHR) with better organic amendments disrupted methanogenesis, and thus negative values were obtained at the later stage of growth. The rice-fallow farming sequence and organic fertilizer amendment resulted in a minimum of GHG emissions in saline soil.
3.2 Findings relevant to the study sites in Sri Lanka
The area of the field study in Madampe of Puttalam District has a pH range of 3.0 to 4.0. Only 50 -60% of the crops survived in the broadcasted plots as the plants could not tolerate salinity even though 90% of the seeds were germinated. After 14 days the tips of the leaves had burned and eventually wilted.
Salinity tolerance increases with age during the tillering phase of growth and decreases from panicle formation stage to the flowering stage leading to reduced grain yields. The straw weight and the total number of tillers seemed to be less affected than grain yield and the number of productive tillers. According to FAO, high salinity can delay the setting of the inflorescence while increasing the number of sterile spikelets (Abrol, Yadav, & Massoud, 1988). Maintaining the right soil moisture content during the tillering phase to the milking phase would aid in producing higher crop yields. Application of inorganic fertilizers causes N2O emissions. Organic amendments with intermittent flooding seem to be quite effective in improving salinity while limiting N2O emissions to undetectable levels, as observed in the current study (data not shown due to insignificant concentrations detected).
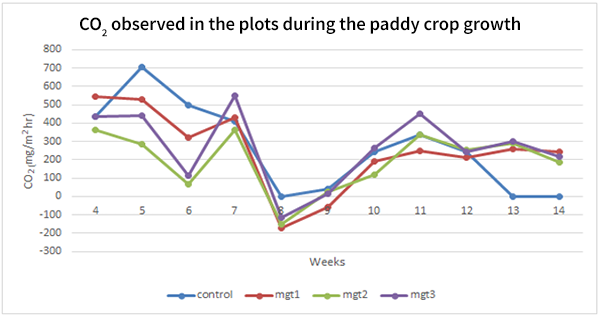
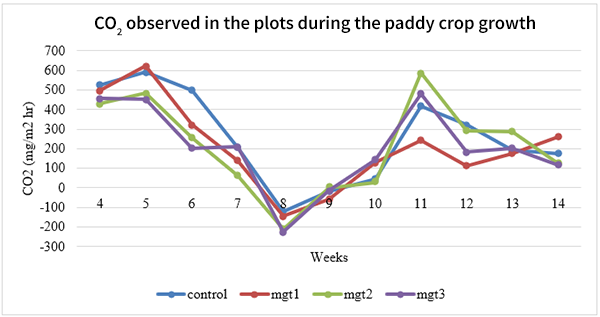
CO2 emissions were observed throughout the rice growth period. High CO2 flux during the initial growth stages could be attributed to high organic carbon. From the panicle initiation stage to flowering stage CO2 emission decreased due to the rapid increase in the rate of photosynthesis which eventually decreased towards the harvesting stage (Figures 6 and 7).
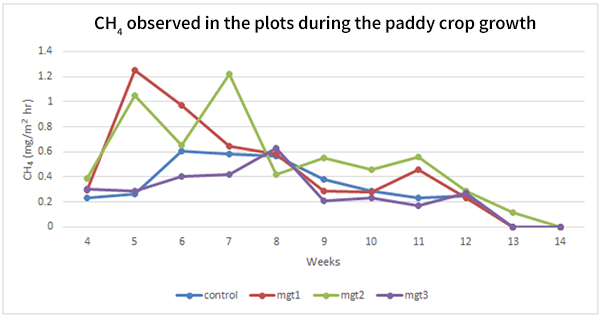
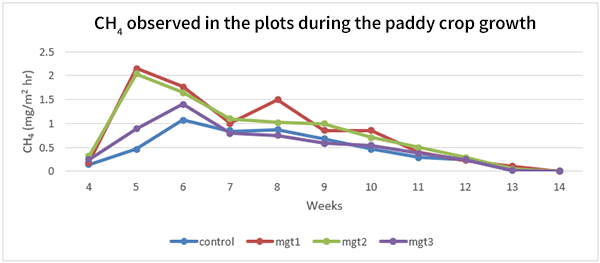
Methane emissions gradually increased until the eighth week and then gradually decreased until the 14th week (Figures 8 and 9). Management options that had flooded irrigation showed the highest emission levels.
Preparation of the final salinity maps of Jaffna and Mannar Districts are underway. These maps will be further improved to indicate different levels of salinity, utilizing site-level EC measurements.
3.2.1 Salinity levels in the wet zone of Sri Lanka
The majority of the saline sites surveyed had high salinity, with EC values greater than 0.6 dS m-1 in 1:5 extract. The highest salinity levels (over 2.8 dS m-1) were observed at the Kahapola site in the Colombo district during the dry period in August and September in 2018.
According to the statistical analyses, there was a significant difference (p <0.05 for t-tests) between the saline and non-saline soils in the sites surveyed for salinity. In general, all of the districts had higher salinity in August, which is considered a dry month, and the salinity levels were low in May and June. Overall, the salinity in the dry period was comparatively higher than the wet period for all the districts. However, there was no statistically significant difference between the salinity during the dry period and wet period across the majority of the sites. Few sites showed a statistically significant difference between the mean salinity in the wet period and dry period (i.e. reference [non-saline] sites of Kalutara, Colombo, Galle, and salinity-affected sites at Godagama, Mahapalana, and Weragoda).
3.2.2 Findings of the socioeconomic survey
According to the results of the socioeconomic survey, the majority of farmers surveyed do not use salt-tolerant varieties even though the salinity levels are high. Instead, many of them use traditional paddy varieties since they believe them to have a high tolerance for salinity conditions. It was observed that in salinity-affected areas the application of chemical (inorganic) fertilizers by farmers is minimal, and they mostly use a combination of paddy husk, Gliricidia (Gliricidiasepium), dried cow dung, and straw to desalinize the land. According to the farmers, leaving rice residue (i.e. straw) in the field after harvesting helps control the salinity levels to a certain extent. Application of gypsum has also helped them reduce salinity levels. Gypsum provides a direct source of calcium ions (Ca2+) to replace exchangeable Na, which can then be leached from the soil with irrigation water or rain (Gharaibeh, Eltaif, & Shra’ah, 2010).
4. Conclusion
Reclamation practices adopted by farmers in the IGP region reduces the salinity and improves the rice yield. Underground water irrigation led to a reduction in salinity whereas salinity increases were observed in canal irrigation practices. Soil with high clay content at MZM, SLM and DHR became water-logged resulting in increased salinity. SLM with the highest salinity displayed maximum Na and sulphate ions. Although rice-wheat and rice-fallow are the most common cultivation sequences of the IGP region, the best sequence is found to be rice-fallow with organic amendments and groundwater irrigation with respect to optimum rice yield and controlled GHG emissions. Screening of rice cultivars for controlling GHGs emissions along with optimum inputs needs to be considered in the future to get better returns in terms of yield under different combinations of reclamation strategies.
The salinity levels in non-saline and saline sites studied in Sri Lanka, particularly those in the wet zone, showed a statistically significant difference. The yield losses under saline conditions were significant compared to the non-saline ones but organic amendments have helped to improve the soil conditions and yield as observed at DHR site, India, and some sites in Sri Lanka, as confirmed from the farmer surveys.
Application of inorganic fertilizers alone increases GHG emissions. However, organic amendments seem to be the best option in improving salinity and farmers seem to have realized this, and the application of chemical fertilizers was minimum in most salinity-affected soils. Although rice-wheat and rice-fallow are the most common cultivation sequences in the IGP region, with respect to rice yield and GHG emissions, the best sequence is rice-fallow with organic amendments and appropriate irrigation practices.
Based on the findings for Sri Lanka, transplanting seedlings is the most effective way to minimize crop loss. Rearing nurseries in low salinity soil and then transplanting to saline-affected soil has been one of the sustainable BMPs. Of all the management combinations, the combination that had transplanting, the addition of organic matter, and intermittent irrigated water levels was identified as the BMP in terms of net GHG emissions and overall productivity (i.e. yield) and providing socioeconomic benefits.
Acknowledgements
Asia-Pacific Network for Global Change Research for providing financial support for this regional study.
References
- Abedin, Md. A., & Shaw, R. (2013). Agriculture adaptation in coastal zone of Bangladesh. In R. Shaw, F. Mallick, & A. Islam (Eds.) Climate Change Adaptation Actions in Bangladesh (pp. 207-225). Springer Japan. doi: 10.1007/978-4-431-54249-0_12
- Abrol, I. P., Yadav, J. S. P., & Massoud, F. I. (1988). Saline soils and their management. In Salt-Affected Soils and their Management. Rome: FAO. Retrieved July 16, 2019 from http://www.fao.org/3/x5871e/x5871e04.htm
- De Alwis, K. A. & Panabokke, C. R. (1972). Handbook of the soils of Sri Lanka, J. Soil Sci. Soc. Ceylon. 2, 1-97.
- Dharmakeerthi, R.S., Indrarathne, S .P., & Kumaragamage, D. (2007). Manual of soil sampling and analysis. Special Publication. No. 10, Soil Science Society of Sri Lanka. Pp 51-53.
- FAO. (2015). The state of food and agriculture 2015 (SOFA): Social protection and agriculture: Breaking the cycle of rural poverty. Retrieved from http://www.fao.org/3/a-i4910e.pdf
- Gharaibeh, M. A., Eltaif, N. I., & Shra’ah, S. H. (2010). Reclamation of a calcareous saline-sodic soil using phosphoric acid and by-product gypsum. Soil Use and Management, 26(2), 141–148. doi:10.1111/j.1475-2743.2010.00260.x
- Harron, W. R. A., Webster, G. R., & Cairns, R. R. (1983). Relationship between exchangeable sodium and sodium adsorption ratio in a solonetzic soil association. Canadian Journal of Soil Science, 63(3), 461-467.
- Hutchinson, G. L., & Livingston, G. P. (1993). Use of chamber systems to measure trace gas fluxes. Agricultural ecosystem effects on trace gases and global climate change, 55, 63-78. doi: 10.2134/asaspecpub55.c4
- Islam, M., Salambr, M., Hassanbr, L., Collardbr, B., & Gregorio, brR. (2011). QTL mapping for salinity tolerance at seedling stage in rice. Emirates Journal of Food and Agriculture, 23(2), 137. doi:10.9755/ejfa.v23i2.6348
- Karmakar, R., Das, I., Dutta, D., & Rakshit, A. (2016). Potential effects of climate change on soil properties: A review. Science Int. 4(2), 51-73. doi: 10.17311/sciintl.2016.51.73
- Lokupitiya, E., & Paustian, K. (2006). Agricultural Soil Greenhouse Gas Emissions. Journal of Environmental Quality, 35(4), 1413–1427. doi:10.2134/jeq2005.0157
- Pandey, D., Agrawal, M., & Bohra, J. S. (2013). Impact of four tillage permutations in rice–wheat system on GHG performance of wheat cultivation through carbon footprinting. Ecological Engineering, 60, 261–270. doi:10.1016/j.ecoleng.2013.07.020
- Rasmussen, R. A., & Khalil, M. A. K. (1981). Atmospheric methane (CH4): Trends and seasonal cycles. Journal of Geophysical Research, 86(C10), 9826. doi:10.1029/jc086ic10p09826
- Richards, L. A. (1954). Diagnosis and improvement of saline and alkali soils. Agriculture Handbook No. 60. United States Department of Agriculture.
- Senanayake, R.M.N.H., Herath, H.M.V.G., Wickramesinghe, I.P., Udawela, U.A.K.S., & Sirisena, D.N. (2017). Phenotypic screening of rice varieties for tolerant to salt stress at seed germination, seedling and maturity stages. Tropical Agricultural Research, 29(1): 90–100. doi: 10.4038/tar.v29i1.8300
- Setia, R., Marschner, P., Baldock, J., Chittleborough, D., & Verma, V. (2011). Relationships between carbon dioxide emission and soil properties in salt-affected landscapes. Soil Biology and Biochemistry, 43(3), 667–674. doi:10.1016/j.soilbio.2010.12.004
- Shahbaz, M., & Ashraf, M. (2013). Improving Salinity Tolerance in Cereals. Critical Reviews in Plant Sciences, 32(4), 237–249. doi:10.1080/07352689.2013.758544
- Singh, Y. P., Arora, S., Mishra, V. K., Dixit, H., & Gupta, R. K. (2019). Plant and soil responses to the combined application of organic amendments and inorganic fertilizers in degraded sodic soils of Indo-Gangetic Plains. Communications in Soil Science and Plant Analysis, 50(20), 2640-2654. doi: 10.1080/00103624.2019.1671446
- Sirisena, D. N., Rathnayake, W. M. U. K., & Herath, H. M. A. (2010). Productivity enhancement of saline paddy fields in Angiththamkulam Yaya, Sri Lanka: A case study. Pedologist, 53(3), 96-100.
- Tejada, M., Garcia, C., Gonzalez, J. L., & Hernandez, M. T. (2006). Use of organic amendment as a strategy for saline soil remediation: Influence on the physical, chemical and biological properties of soil. Soil Biology and Biochemistry, 38(6), 1413–1421. doi:10.1016/j.soilbio.2005.10.017
- Tenuta M, & Beauchamp, E. G. (2003). Nitrous oxide production from granular nitrogen fertilizers applied to a silt loam soil. Canadian Journal of Soil Science, 83(5), 521–532. doi:10.4141/s02-062.
- Walkley, A., & Black, I. A. (1934). An examination of the Degtjareff method for determining soil organic matter, and a proposed modification of the chromic acid titration method. Soil science, 37(1), 29-38.