Tracking influences of Asian urban greenhouse gas emissions for sustainability policies: Preliminary report
Keywords
Asia · Greenhouse gas emissions · Low carbon policies · Urban energy use
Highlights
- Asian cities are significant contributors to global GHG emissions.
- The influence on GHG emissions from cities varies.
- Reduction strategies must fit individual cities and will vary across the region.
1. Introduction
Through the Paris Agreement of COP 21, 12 December 2015, a legally binding international treaty on climate change signed by 196 world leaders representing the various parties, the international community recognised the importance of climate change and committed their economies, through Nationally Determined Contributions (NDCs), to address anthropogenic causes. The agreement reflects concern over current dramatic changes in planetary systems resulting in violent weather-related extreme events (fires, heat waves, typhoons, storm surges), rising seas, glacier melt, changes in precipitation patterns and other impacts. Furthermore, findings from the Intergovernmental Panel on Climate Change (IPCC) indicate that the net damage costs of climate change are likely to be significant and will increase over time if nothing is done to change emissions levels ( IPCC, 2022).
Despite national commitments, however, there remains a significant “emissions gap”, which is the difference in the total greenhouse gas (GHG) emissions projected by 2030 and the level that is necessary to keep global warming limited to 2°C (or under 1.5°C) and those under the current trajectory. The necessary trends in GHG emissions have been estimated by the IPCC and published in a Special Report on Global Warming of 1.5°C ( IPCC, 2018) and its underlying studies. Estimates suggest that the gap for GHG levels by 2030 under the NDCs is approximately 15 Gt CO2e (range: 12–19 Gt CO2e) for below 2°C scenarios and about 32 Gt CO2e (range: 29–36 Gt CO2e) for below the 1.5°C scenarios ( UNEP, 2020).
As the world continues to urbanise, cities have become the focus of concern for the emissions gap as well as the potential solution to emissions reductions. This is because urban areas are responsible for around 70% of global CO2 emissions. The high total share of CO2 emissions from cities is due to a number of factors, including, inter alia, the large number of urban residents, the higher wealth found in cities compared to national non-urban counterparts and the fossil fuel use-related activities found largely in and around cities (i.e., transportation). Among the entire urban population, those living in the largest cities and wealthiest cities are responsible for the largest share of total GHG emissions ( Seto et al., 2014).
At the same time, spatially organising societies around dense settlements can help to address climate change as urban residents in wealthy nations are typically more energy efficient than their suburban and rural counterparts; they have lower carbon footprints ( Marcotullio, Sarzynski, Albrecht, Schulz, & Garcia, 2013). This is due to, inter alia, sharing housing stock (i.e., living in apartment buildings), using less transportation energy and working in commercial rather than industrial sectors. Some suggest that this results in an increasing energy efficiency potential with the size of cities ( Bettencourt & West, 2010).
Moreover, governance of urban areas can respond more quickly to climate change demands than national political units ( Bulkeley & Kern, 2006). Scholars are placing much hope in implementing effective mitigation policies to promote low-carbon cities ( Wiedmann & Allen, 2021). These hopes have been supported by evidence, as within the past few decades, there has been an uptick in city or municipality-level climate action, with cities coming up with their own policies to mitigate their emissions ( Gouldson et al., 2016).
Given the importance of cities in climate change mitigation, many eyes are on the Asian region, as it is undergoing rapid urbansation and economic restructuring. China has emerged as the largest global GHG contributor, accounting for approximately 30% of annual emissions ( Gouldson et al., 2016). The entire Asian region, as defined by the UN, contributes over 57% of annual emissions ( Andrew & Peters, 2020). According to the World Bank, fast-growing cities in the East Asia and Pacific region will define the region’s energy future and its GHG footprint ( Ostojic, Bose, Krambeck, Lim, & Zhang, 2013). As the region urbanises, Asian urban residents can take advantage of the lessons learned in other countries and avoid locking into energy-intensive infrastructure and behaviours ( Gouldson et al., 2016). There are significant opportunities for low-carbon energy futures for Asian cities, but measures need to be taken immediately.
This paper briefly reviews studies of urban GHG emissions studies in the Asian region and provides the results of a recent APN-funded study that examines drivers of GHG emissions and potential low-carbon strategies. The review findings suggest that studies have moved from examining the city as a black box to examining specific sectors and geographic locations within cities. The APN-funded studies presented in this paper continue this trend by examining the complex drivers of urban GHG emissions at the sub-urban scale and identify pathways for low-carbon urban futures. The results provide leverage for low-carbon actions to meet the Paris Agreement.
The first part of this paper presents an overview of Asian urban GHG emissions research. The next section briefly reviews the methods used in the different urban studies of the APN project. The fourth section summarises the results from each study team and the last section discusses the results. The paper concludes by providing key themes identified across Asian cities.
2. Literature review
2.1 Asian GHG regional urban emissions studies
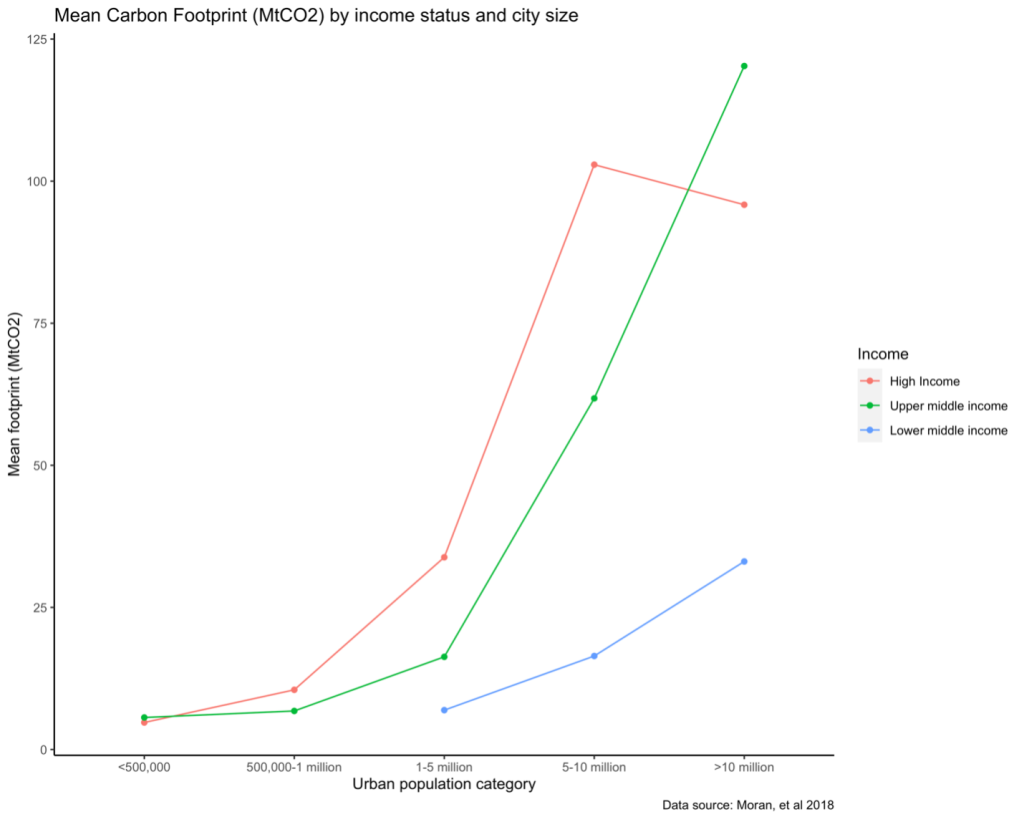
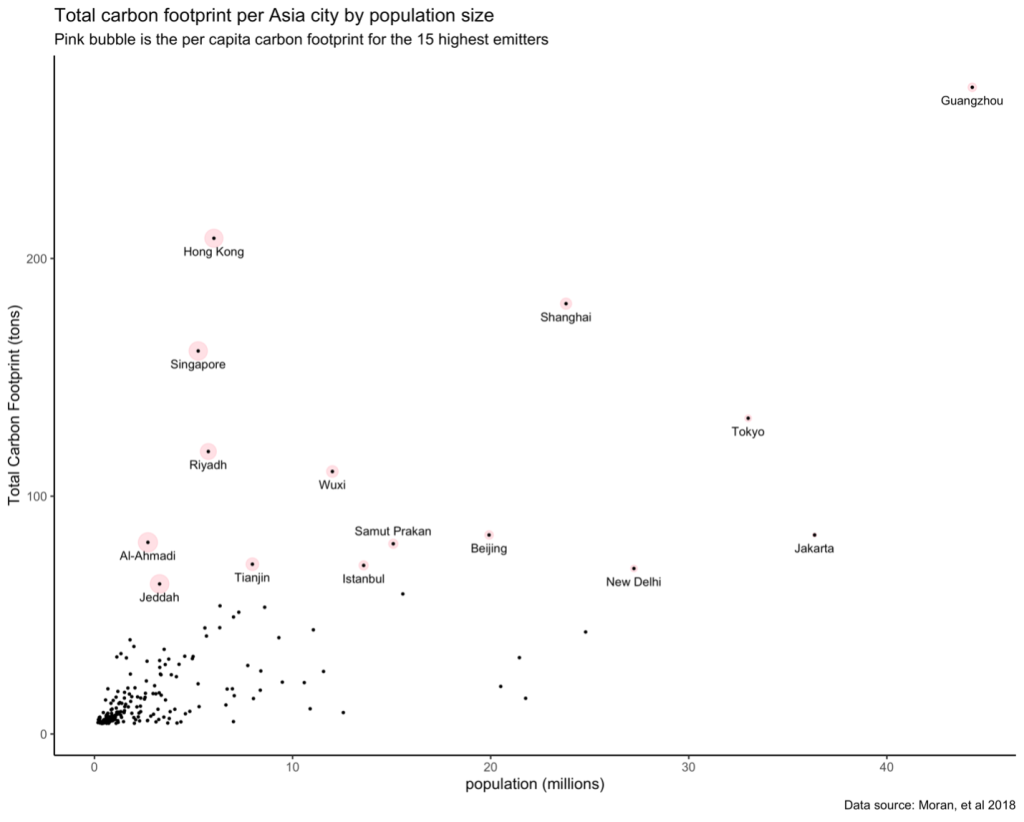
Due to local data limitations, many urban analysts perform urban GHG analysis at the provincial or larger geographic regional levels ( Long et al., 2020) . Regional studies have applied similar protocols across a limited number of different cities. For example, Marcotullio, Sarzynski, Albrecht, and Schulz (2012) estimated urban GHG emissions in the Asian region using a top-down approach with data from the Emission Database for Global Atmospheric Research (EDGAR) and a consistent method. A more recent study created a globally consistent, top-down, gridded global model of city footprints (GGMCF) by downscaling national carbon footprints (CFs) into 250 m gridded cells and included Asian cities ( Moran et al., 2018). From the data made available by Moran et al. (2018), we can see that the largest and wealthier cities in the region are responsible for the most GHG emissions Figure 1. Using their template for Asian cities, it is also evident is that per capita emissions vary among urban emitters Figure 2.
2.2 Asian GHG local urban emissions studies
Local Asian urban GHG inventories have largely been generated for megacities or provincial capital cities, particularly in China ( Huang, Zhang, & Liu, 2018; Zhao & Li, 2016). Many city governments implement GHG inventories to help determine how to mitigate emissions and which policies might be most effective. Though some governments have a long-standing record of their annual GHG emissions, other localities neither have the time nor resources (and particularly the data) to build a fully-fledged inventory. Therefore, most of the local GHG inventories are from the major metropolitan centres in the region.
The Seoul Metropolitan Government (SMG) reports that 2019’s total emissions were approximately 46.3 Mt CO2e. Energy-related activities made up 90% of emissions ( Government, 2021). For 2020, SMG reports that total GHG emissions were 45.2 tons. The inventory includes details for different sectors. For example, the building sector, which accounts for the largest share of GHG emissions, accounted for 68.9%, which is similar to 2019 (68.8% estimated). Within the building sector, GHG emissions from households have been increasing (1.4% year-on-year between 2019 and 2020), while emissions from the commercial sector have been decreasing (1.2% year-on-year, between 2019 and 2020) ( Government, 2021). Research confirms the importance of the building sector’s contribution to Seoul’s GHG emissions. Kim and Jeong (2018) estimated around 25.0–26.0 Mt CO2e for Seoul in 2015.
The Tokyo Metropolitan Government (TMG) has made its inventories accessible since 2012. In 2018, Tokyo’s total GHG emissions were approximately 63.9 Mt CO2e and have demonstrated a declining trend since 2012 ( Environment, 2021). Tokyo’s commercial and residential sector emissions continued to increase while transportation and industrial decreased. The share of commercial and residential emissions in Tokyo is larger than that of Japan overall, demonstrating the importance of the buildings sector in Asian cities. Using a city-scale multi-regional input-output table, Long and Yoshida (2018) examined the difference in direct and indirect emissions for Tokyo. They point out that the transportation sector accounts for the largest share of direct emissions in Tokyo, while the energy supply, construction and private service sectors account for the largest share of indirect emissions.
In their climate action plan, the city of New Taipei announced that they emitted approximately 18 Mt CO2e in 2014, with 72.6% from stationary energy sources and 24.9% from transportation, 1.96% from waste, 0.02% from industrial processes and 0.06% from agriculture, forestry and land use ( New Taipei City Government, 2015). The residential, commercial and institutional building sectors have the highest share of emissions, with 7.4 Mt CO2e, accounting for 56.0% of the emissions of the stationary energy sector.
The Government of the Hong Kong Special Administrative Region reports that their 2018 emissions totalled 40.6 Mt CO2e, with electricity generation and town gas production making up 65.6% of the total ( Bureau, 2021). Zhou, Shan, Liu, and Guan (2018) use the IPCC territorial emission accounting approach to estimate 2016 emissions for the Guangzhou-Hong Kong-Macao Bay Area. They suggest that Hong Kong’s emissions are 47 Mt CO2. Guangzhou emissions are higher at 66 Mt CO2. As landfill area is becoming scarce in Hong Kong, Dong, An, Yan, and Yi (2017) focus specifically on the waste sector, reporting that in 2013 emissions were about 2.0 Mt CO2e from this sector or over 4% of total emissions. The Hong Kong transportation sector emissions levels are estimated by To (2015) at 35.8 Mt CO2e. Electricity consumption is approximately 30.8 Mt CO2e ( To & Lee, 2017).
The Singapore National Climate Change Secretariat, in their 2020 report, stated that Singapore’s GHG emissions in 2017 totalled 52 Mt CO2e, which is a 34.8% increase from 2000 levels ( Agency, 2020). Primary emissions came mainly from the industry sector (46% of the total), followed by the power sector (39% of the total). Singapore stands out for its high share of industrial emissions compared to other large Asian metropolitan centres of medium to high income.
In Bangkok and Ho Chi Minh City (HCMC), The Japan International Cooperation Agency (JICA) has helped to create a GHG inventory. The Bangkok Metropolitan Administration (BMA) estimates that its year 2013 emissions suggest that the energy sector is the highest source of GHG emissions energy (25.6 Mt CO2e), followed by transportation (13.8 Mt CO2e), waste and wastewater (4.55 Mt CO2e), and green urban planning (-0.045 Mt CO2e). Total emissions are 43.9 Mt CO2e ( Bangkok Metropolitan Administration, 2015). In a more recent review, the BMA reported for 2016 that emissions for energy are 25.8 Mt CO2e, while transportation emissions have decreased to 12.4 Mt CO2e. Waste and wastewater remain at approximately 4.5 Mt CO2e, and green urban planning is -0.045 Mt CO2e ( Bangkok Metropolitan Administration, 2017). According to a research report, however, the BMA is underestimating the importance of the waste sector. For example, Thitanuwat, Polprasert, and Englande (2017) suggest that this sector is emitting 7.1 Mt CO2e annually. The CO2 emissions for HCMC’s stationary energy and transportation sectors are approximately 17 Mt CO2e ( Bangkok Metropolitan Administration, 2017). Together these sectors’ emissions comprise 91% of total emissions and removals from the city. The total GHG emissions are 38.5 Mt CO2e per year. As in many major metropolitan centres, emissions from HCMC account for a disproportionate share of national emissions. While HCMC’s population share is 9% of the total national population, emissions from the city account for 16% of national GHG emissions.
In South Asia, Gouldson et al. (2016) estimate that 2014 emissions for Kolkata are between 23 and 24 Mt CO2e, with the residential sector contributing most to the total emissions. These estimates include energy use and emissions from the metropolitan area, using direct consumption of fuels and waste facilities (Scope 1 emissions) and those produced while generating the electricity consumed within the city (Scope 2 emissions). Using the GAINS model, Majumdar et al. (2020) report that in 2015, the Kolkata Metropolitan City (KMC) emitted approximately 20.3 Mt of CO2, 74.8 kt of N2O, and 25.2 kt of CH4. The power plant sector contributed the largest share (66%) of CO2 emissions, followed by light- and heavy-duty vehicle exhaust (15%) and residential combustion (10%). The agriculture sector contributed the majority of N2O and CH4 emissions, 97% and 87%, respectively.
Sharma and Dikshit (2016) calculated Delhi’s 2014 GHG emissions load to be 37.9 Mt CO2e, with electricity generation/consumption contributing 43% and vehicles contributing 32% of the total. Nagar, Sharma, Gupta, and Singh (2019) estimate 2014 emissions to be at 41.6 Mt, with major contributions from power plants (46.8%), vehicles (29.7%), municipal solid waste burning (7.6%) and domestic cooking (6%). Transportation emissions in Delhi and Bangalore contribute the largest share of total emissions (32% and 43.5%, respectively), and the domestic sector emissions are most important in Mumbai and Kolkata (32.7% and 42.78%, respectively).
2.3 Asian intra-urban emissions levels
While it is well documented that the major metropolitan centres of nations, particularly those in Asia, are responsible for a large part of the emissions for their country, the distribution of these emissions by source, sector and urban location are less understood. Specifically, the spatial layout of a city, the fuels as part of the primary supply, the energy-consuming industrial processes as well as other characteristics, which are responsible for varying levels of emissions within the city, require further exploration. Few previous studies have examined urban emissions at the sub-city scale and, particularly spatially, even fewer distinguish among spatial emissions by sector. Indeed, research in these areas is only beginning to be published ( Yang, Wang, Sun, Wang, & Zheng, 2018; Zhu et al., 2019). For example, examining 38 Beijing residential communities, ( Yang et al., 2018) estimate residential and transportation emission levels for each community, separating out the levels into electricity, cooking and heating emissions for residential emissions and private car and taxi for transportation emissions. Wang, Shi, Fang, and Feng (2019) analysed CO2 emissions for the manufacturing industry, transportation, service industry and housing sectors, as well as the total emissions for the entirety of the metropolitan area using a downscaling analysis.
Increasingly, satellite remote sensing is used to detect atmospheric CO2 concentration, with the advantage of enabling a stable, continuous and large-scale observation ( Goldberg et al., 2019; Park, Jeong, Park, Yun, & Liu, 2021). Zhu et al. (2019) used a high-resolution carbon emission spatially gridded (1 km2) dataset for Shanghai from 2010 to 2015 to generate fossil fuel emissions. Pan, Li, Zhu, and Dang (2017) used a similar method to study CO2 emissions in Shanghai by energy type, usage type, and facilities. Sun et al. (2021) also used a 1km2 resolution CO2 emission gridded data for a number of Asian megacities: Seoul, Busan, Incheon, Daegu, Tokyo, Kyoto, Osaka, Chiba, Beijing, Tianjin, Shanghai and Chongqing.
3. Review of methods
The present research examined the drivers of GHG emissions at the sub-city scale and different ways to promote low-carbon futures. Each team picked a different focus, method and used different data. The study was not intended to compare GHG emission results, which typically are different, but rather to identify areas where Asian cities could enhance low-carbon pathways. In this section, we briefly review the different methods used to help identify drivers of GHG emissions.
3.1 Bangkok
Thailand developed its first national GHG inventory report in 1994, followed by subsequent inventory reports in 2000 and 2011. However, comprehensive sub-city level inventories have only started to be explored ( Ali, Pumijumnong, & Cui, 2018). The Bangkok team developed a historical inventory of GHG emissions at the sub-city level with a focus on the residential, commercial, industrial and transportation sectors. The team used secondary data to calculate the associated sectoral emissions from 2008 to 2016 by province. It is important to note that the study has estimated only electricity-based emissions from residential and commercial sectors (due to data limitations) and only focused on CO2 emissions. The team used fuel consumption, the net calorific value of the fuel and emission factors to calculate emissions. For electric use, the method was to multiply the electric consumption by the local emission factor. For all sectors except electricity, calorific values and emissions factors for fuels were collected from the IPCC 2006 guidelines. The factor for power generation was collected from the Thailand Energy Policy and Planning Office.
3.2 Beijing
The Beijing team developed comprehensive indexes using the stochastic frontier parametric approach (SFA) to measure relative carbon emission reduction efficiency ( Feizabadi, Bagherian, & Moghadam, 2019) in order to study the carbon emission performance and mitigation potential of 39 industrial sectors in the Beijing city, Tianjin city and Hebei Province (BTH) region, China. According to data from the National Bureau of Statistics of China, the BTH region covers an area of 0.22 million km2, with a population of more than 110 million persons in 2017 (21.3 million persons in Beijing, 15.6 million persons in Tianjin and 75.2 million persons in Hebei), accounting for 8.06% of the total population of China. In 2017, the GDP was approximately 8.06 trillion Chinese Yuan (CNY), accounting for 9.74% of the nation’s total. Industrial development has been an important part of regional economic growth in recent years and, by 2017, accounted for 30.9% of the regional GDP. In Hebei, in 2017, the industrial share of GDP exceeded 40%.
Variables for the analyses included capital, labour, energy use, GDP (desirable outputs) and CO2 emissions (undesirable outputs) ( Guo, Liu, & Wang, 2013; Lin & Wang, 2015). The inputs were classified as belonging to 1 of 39 sectors. The original data was derived from the Beijing Statistical Yearbook, the Tianjin Statistical Yearbook, the Hebei Economic Yearbook and the China Statistical Yearbook (2011–2017). The economic data from each sector was converted to 2010 price levels, including capital and GDP. Estimates of the capital stock for each sector were based on the perpetual inventory method. Energy consumption was converted into standard coal equivalents (Tce). The carbon emissions were calculated according to the IPCC method ( Wang, Zhan, Li, Zhang, & Zhang, 2019). The team captured the total factor carbon emission performance (TFCP) and carbon emission mitigation potential (CMP) for 39 industrial sectors in each of the three sub-regions from 2010 to 2016. The study also calculated the carbon emissions from residential consumption in the BTH region and analysed the influence of impact factors on the indirect residential carbon emissions. Details of the methods can be found in Wang, Zhan, Bai, Chu, and Zhang (2019) and Wang et al. (2019) .
3.3 Seoul
The Seoul team evaluated the progress of green growth policy in Seoul and the Republic of Korea with suggested methods for improving the effectiveness and enforcement of policies that respond to climate change. The team first conducted an analysis of the CO2 emissions in the building sector, focussing on socioeconomic driving forces. Energy consumption is calculated per year per building from natural gas use. The emissions were spatialised using a kernel density function. The spatial distribution of emissions data was then compared visually to the spatial distribution of population, number of buildings (houses), number of businesses, local GDP, and other factors. The team then reviewed national and local plans for low carbon development for the province and city, including actions by sector for energy production, air quality, transportation, resource recycling, water use, local ecology, and urban agriculture. The team analysed the focus of policy and the related emissions to identify ways to enhance the low-carbon development of the city.
3.4 Taipei
The Taipei team identified the CO2 emissions within the building stock of the city using emergy analysis to calculate embodied energy ( Brown & Buranakarn, 2003). Emergy is an accounting technique that quantifies all forms of energy in terms of their equivalent ability to do work when used in the system of which they are a part. This includes natural factors (rain, wind, sunlight, etc.) as well as anthropogenic energy (primary fuels, electricity, heat). Emergy is typically expressed in solar emjoules (sej). The Taipei team divided all buildings in the city into five types classified in accordance with the building materials used and the years the structures were built (red brick buildings – before 1945, 1-5 story buildings 1946-1974, 6-12 story buildings 1975-1995, and 12-24 story and 25 story and above buildings 1996 to present). They calculated densities of emergy storage (sej/m2) and CO2 emissions for the different building types through an analysis of the raw construction materials. Estimates were developed based on the “Building Material Production and Transportation CO2 Emission Chart” issued by the Architecture and Building Research Institute of Taiwan’s Ministry of the Interior (MOCA), delineating the building types of high and low CO2 emissions. In order to analyse the spatial distribution of emergy storage and building CO2 emissions in Taipei City, this study used both district and neighbourhood scale mappings. Presenting results from the different scales allowed for the identification of distinctions between daily consumption CO2 emission and urban development intensity. Complete details of the study can be found in Huang, Huang, and Marcotullio (2019).
3.5 Tokyo
The Tokyo team examined the change in energy use, GHG emissions from 2000 to the present, and national and local energy-related policies during that period (20 different energy-related mitigation policies). The analysis used data obtained at various levels, including local emissions levels published by the Tokyo Metropolitan Government (TMG) for different fuels (gasoline, fuel oil, LPG, city gas, electricity) and sectors (industrial, commercial, residential and transport). The focus was on evaluating the differences in policies at different levels of government, particularly after the 2011 earthquake, and to assess the effect of these policies on energy use and emissions. This was performed through a historical analysis of changes in energy use and GHG emissions, given the timing of implementation and enforcement of specific policies. Details of the methods can be found in ( Aleksejeva, Voulgaris, Long, & Gasparatos, in press).
3.6 New York City
The New York City team used a variety of online data sets at the national level to generate a historical spatialised map of residential energy use from 1993 to 2009 for the New York metropolitan area, as defined by the Regional Plan Association (RPA) (34 counties in and around New York City). The analysis of the data included three major steps, including developing regression equations for the four different residential energy end uses (space heating, water heating, cooling and appliance use), spatialising the outputs of these regressions using census data and then generating emissions based upon fuel use (using national conversion factors). The spatialised residential energy use was then aggregated into different urban units (core, inner suburban, outer suburban and exurb) and compared. The results were validated by comparing the total energy use and GHG emissions data to state databases. Details of the methods can be found in ( Rio, Lu, & Marcotullio, in press).
4. Review of results
4.1 Bangkok
The Bangkok team identified five major findings for GHG emissions and four suggested drivers for lower emissions levels. The first major finding is that for the BMA overall, there is a trend of total CO2 emissions increase from 2008 to 2016 at a rate of 0.94% per annum. The second finding is that the transportation sector had the highest levels of emissions, followed by the industrial sector, then the commercial sector and finally, the residential sector. Transportation accounted for 43% of total emissions in the Bangkok Metropolitan region and within the transportation sector, the largest fuel source was diesel. The third finding is that there was a significant decrease in energy use and emissions during 2011, which was due to flooding experienced across the country but largely experienced within the Bangkok region. This flooding was most severe in the Ayutthaya and Pathumthani provinces. As a result of the flooding, electricity-related emissions dropped significantly. Finally, the rate of increase in electricity consumption was higher (3% increase for buildings) than the rate of increase in electricity-related emissions (approximately 1% increase in emissions) from 2008 to 2016. This suggests an energy and or carbon intensity efficiency during this period. From these results, the team suggested that the drivers for future low-carbon actions are to increase the share of renewable energy in power generation, increase energy efficiencies, particularly in the buildings sector, continue to develop mass transit to encourage less private vehicle use and promote electric vehicles.
4.2 Beijing
The major findings of the Beijing team include identifying the trend of total carbon emissions in the BTH region, which increased from 542 Mt CO2 in 2010 to 649 Mt CO2 in 2016. Carbon emissions in Hebei increased from 439 Mt CO2 in 2010 to 565 Mt CO2 in 2016 and contributed the largest proportion (87%) of the increase during this period. Carbon emissions in Tianjin increased slightly from 44 Mt CO2 in 2010 to 48 Mt CO2 in 2016, while those in Beijing decreased slightly from 59 Mt CO2 in 2010 to 36 Mt CO2 in 2016.
The sub-regional CMP of most industrial sectors decreased from 2010 to 2016. Processing of Food from Agricultural Products, Manufacture of Foods, Manufacture of Beverages, Manufacture of Nonmetallic Mineral Products, Smelting and Pressing of Ferrous Metals, Manufacture of Transport Equipment, Production and Distribution of Electric Power and Heat Power in Beijing have the greatest potential for reducing carbon emissions. The total residential carbon emissions increased from 257.50 Mt CO2 in 2002 to 673.34 Mt CO2 in 2012 in the BTH region, reflecting an increase of more than 150%. In addition, carbon emissions in Hebei were 3.86 times that of Beijing and 10.58 times that of Tianjin in 2012. Residential carbon emissions from urban areas were far higher than that from rural areas, with urban carbon emissions being 1.51 times higher in 2002, 2.66 times higher in 2007, and 2.79 times higher in 2012. Moreover, indirect carbon emissions were higher than direct ones. The contribution of indirect emissions to total emissions comprised more than 60% in Beijing and Tianjin, and more than 70% in Hebei. Three impact factors exhibited positive effects on the growth of indirect emissions in the three sub-regions; intermediate demand, consumption, and population size.
4.3 Seoul
The Seoul team suggest that the Seoul Metropolitan Government’s green growth policies were developed before the national policies, demonstrating that Seoul leads the country in low carbon mitigation strategies. Moreover, the Seoul Metropolitan Government supplemented its existing green policies, seeking to facilitate citizen participation, and to divide action plans between citizens, companies and the government. However, the achievement was not found to be inclusive.
From the GHG emissions analysis, the team identified a number of potential policies for low carbon futures. First, the city must establish a spatially organised system that connects differences across space, the environment, energy and resource cycling. Green growth plans need to reflect differences in socioeconomic and physical factors across the city. Plans must be specialised to take advance of physical spaces, environment, energy, resource cycling, transportation, infrastructure and climate change. Second, policy must focus on urban restoration. For example, the decline of the old downtown area of Seoul had been a persistent problem which was addressed by the Cheonggyecheon Stream project, which subsequently led to the revitalisation of central Seoul. The authors suggest that when selecting green-city-model target areas, urban revitalisation areas must be a priority, and the sites need to reflect various examples of applied planning elements. Third, low-carbon green policy must focus on spatial planning for local energy. Local energy plans can help to identify the current conditions of energy consumption and GHG emissions status. This requires a local energy consumption inventory and enhanced demand estimations. Finally, policy must enhance governance systems, which start with guidelines to provide solutions by forming consultative groups that are inclusive of stakeholders.
4.4 Taipei
The Taipei team found that among the five building types studied, 13 to 24 story steel-reinforced, concrete buildings have the highest emergy density (7.59E+15 sej/m2) and brick buildings (the oldest building type) have the lowest emergy density (1.25E+15 sej/m2). The results show a correlation between emergy densities of different building types and the density and height of the buildings. Using emergy density, the growth of the city is evident, which brick buildings located close to Tamsui River and higher emergy density buildings located in consecutive circles, moving east from the river. Buildings with higher emergy density and stories tend to use greater amounts of construction materials with higher unit emergy value UEVs (transformity values) (i.e., reinforced, concrete and steel), which results in higher emergy density. These results suggest that the building types with higher emergy densities are also responsible for higher building–CO2 emissions.
The total CO2 emissions embedded in buildings in the city surpasses 1.47 Mt CO2, of which approximately 71% is embedded in the building structure, while approximately 20% is embedded in the foundations. They also note that given the newer building have higher emergy density and CO2 emissions, further building can rapidly increase total embedded CO2 emissions. This suggests the importance of building re-use, particularly for newer developed structures.
The team also argued that by calculating the correlation between the emergy of different building types and the building-CO2 emissions during the construction process, the team was able to identify the positive correlation between accumulated emergy storage and CO2 emissions. They conclude that emergy synthesis can effectively assess CO2 emissions derived from building construction.
4.5 Tokyo
The Tokyo team found that the Tokyo Metropolitan Government has been a clear frontrunner in energy consumption and GHG emission reduction efforts within Japan, possibly even influencing the agenda of the national government towards the adoption of more ambitious targets and individual initiatives. Apart from consistently setting more ambitious emission reduction targets than the national government, the Tokyo Metropolitan Government has enacted some truly innovative policies and initiatives ahead of the rest of the country. Some examples include the local Cap-and-Trade program, the rapid switch to LEDs, and the energy-labelling scheme, among others. These policies have helped to reduce energy use and emissions in the city.
Given the results of the study, the authors suggest that in some cases, city governments can be more ambitious and proactive in emission reduction targets than national governments, even in the wake of unanticipated events. They also argue that despite good intentions and clear efforts, many of the factors affecting the effectiveness of energy consumption and emission reduction policies are beyond the reach of city governments. That is, localities need to cooperate with national governments to provide effective mitigation strategies. Both of the findings have major ramifications for managing energy consumption and meeting emissions reduction targets both at the national and city levels.
4.6 New York City
The New York team identified a number of findings. First, the tri-state region’s total residential energy use was about the same from the start to the end of the period (although there were fluctuations), but there were dramatic changes in energy services. For example, the residential energy for space heating dropped by approximately 16.4% from over 1.06 quad to 880 trillion BTU. At the same time, residential energy for cooling increased from 840 billion to 21 trillion BTU or by over 2400%. Energy for appliance use also increased by 80% from 160 trillion to 289 trillion BTU during the period. Second, total energy use shifted by geographic region. Residential space heating energy dropped across all geographic areas. At the same time, residential energy for water heating, cooling and appliances all increased. Residential energy for cooling increased by the greatest amount relatively across sectors. The greatest absolute total increase in residential energy end use was for cooling in the outer suburbs, which increased from 720 billion to 15.8 trillion BTU. Energy for appliance use also increased differentially across geographies during the period. The greatest increases were experienced by the inner and outer suburban areas, where appliance energy use increased by 80.5% and 85.6%, respectively. Finally, the energy use per household also changed over time, demonstrating differences across space. In terms of household residential energy, the only geographic area that didn’t change was the outer suburban metropolitan areas. All other regions experienced drops in average total household energy use. The authors argue that emissions reduction strategies should include a geographic component, as residential emissions are significantly different across metropolitan areas.
5. Discussion and conclusion
5.1 Asian urban GHG emissions
From the review of the literature, we find that GHG emissions from the region are significant and the major metropolitan centres are large and growing contributors. In most cases, national and urban emissions are increasing, although the APN-funded research teams identified stable emissions over the past few years for Tokyo.
Although it is difficult to directly compare results of the different city research teams due to differences in research focus, methods and data used, there are some generalities that can be identified in terms of the drivers of emissions. First, confirming the literature review, in the rapidly developing cities and urbanising areas such as Bangkok and the BHT, China, important activities related to the growth of emissions include: 1) the building of cities and subsequent creation of concrete-related CO2 emissions; 2) vehicle (passenger and freight) use; 3) industrial manufacturing energy use and industrial processes and 4) low but growing residential consumption. Within these urban areas, there is a significant difference among sub-city units. For example, the BHT industrial centres and new commercial centres have the highest emissions levels. This is probably due to the economic activities and demand for transportation. That is, industry and transportation are important sectors of GHG emissions in these types of Asian cities.
The Bangkok and BHT studies suggest that cities of rapid growth and industrial development require policies to regulate industries. Industrial development, particularly in cities that are industrial centres, is an important contributor to economic wealth, but emissions from industrial processes can be regulated to help reduce emissions. In this case, both urban planning and city regulations requiring lower emissions are possible. Enhancing laws that encourage energy efficiency in both energy use and industrial processes could help here.
Second, in the more developed cities (Seoul and Tokyo), large shares of emissions are largely from transportation and residential energy use and not from industry. Emissions from these cities are lower per capita than those of some rapidly developing cities. For example, Tokyo’s per capita emissions are lower than those of Beijing.
The Taipei study is different in that the team examined embedded energy and CO2 emissions. The findings, however, suggest the importance of embedded energy in the building sector. This translates into the importance of building re-use rather than demolition and construction of new structures as a means to reduce overall emissions levels. Importantly, the newer buildings have high embedded energy and CO2 emissions and should be considered for re-use when their current uses are outdated.
Third, some of the major Asian metropolitan centres are leading national low-carbon efforts. The studies in this project identified Tokyo and Seoul as national leaders in carbon reduction strategies. Taipei and Bangkok are also implementing policies, although whether they are leading national efforts was not studied. Low-carbon policies across cities in the region vary, and rightly so. Certainly, all cities share the need to reduce emissions from growing passenger car use, but other priorities vary. Many Asian cities are already dense and compact, facilitating high transit and non-passenger car mobility. For those cities that can sprawl, such as Bangkok, other policy alternatives, such as the electrification of motor vehicles, as pointed out by the Bangkok team, are necessary.
In conclusion, Asia will remain the centre of industrial activity, population growth and increasing CO2 emissions over the next few decades. It is therefore urgent to identify ways in which the region’s cities can become more efficient and less polluting. There are both hopeful and threatening trends emerging. Whether cities in the region can leap-frog over the problems experienced by the developed world remains uncertain. Work on urban GHG emissions will continue to play an important role in helping to understand GHG trends and provide valuable assistance to policymakers.