Spatial variability of nutrient sources determining phytoplankton Chlorophyll-a concentrations in the Bay of Bengal
Keywords
Atmospheric deposition · Chlorophyll-a · Nutrient entrainment · Remote sensing · Upwelling
Highlights
- We mapped the nutrient sources that determine chlorophyll-a in the Bay of Bengal.
- River-borne nutrients are important for phytoplankton in coastal waters.
- Deep-ocean nutrients are important for phytoplankton in the south-west and west bay.
- Atmospheric nutrients are important for phytoplankton in the central/eastern bay.
1. Introduction
The Bay of Bengal, located in the northeastern Indian Ocean, is one of the world’s biggest large marine ecosystems (LMEs). Eight national governments in the region (those of India, Bangladesh, Sri Lanka, Myanmar, the Maldives, Thailand, Malaysia, and Indonesia) have agreed to build a consensus on a strategic action program to solve existing socio-economic issues in the bay ( Elayaperumal, Hermes, & Brown, 2019). Geographically, the Bay of Bengal is bounded by the Asian continent to the north, the eastern coast of India to the west, and the Andaman Sea to the east. In the south, the bay is open to the South Indian Ocean.
One of the key factors influencing socio-economic issues in the Bay of Bengal LME is primary production, which refers to the production of organic matter by phytoplankton through photosynthesis. Primary producers are the base of the marine food web, and their production supports the biomass and secondary production of higher trophic levels. Previous reports have identified a strong relationship between phytoplankton biomass or primary production and fisheries production in various coastal and pelagic ecosystems ( Nixon & Buckley, 2002; Nixon & Thomas, 2001). Particularly in the Bay of Bengal, the production of the tropical hilsa fishery, which contributes to the economies of India, Bangladesh, and Myanmar, is controlled by primary production ( Hossain, Sarker, Sharifuzzaman, & Chowdhury, 2020).
Besides inorganic nutrients, light is also an important factor for primary production ( Kumar et al., 2010), especially in the northern Bay of Bengal, because of the high turbidity associated with large sediment inputs from the Ganges and Brahmaputra rivers (GBR). Furthermore, because of the large flux of freshwater from the GBR in this region, the water column is strongly stratified, inhibiting inorganic nutrient input from the deep ocean to the euphotic zone, especially in the central bay and during summer ( Kumar et al., 2002). However, in regions of the bay where light is not a limiting factor, inorganic nutrient input is thought to be the main determining factor for primary production.
At least three main sources of inorganic nutrients are thought to determine primary production in the Bay of Bengal: riverine inputs, upwelling or vertical mixing from the deep ocean, and atmospheric dust deposition (DD). In this study, we used phytoplankton chlorophyll-a (CHL) concentration as an indicator of ocean primary production. Freshwater discharge from the GBR and nutrient inputs from ocean upwelling and mixing change seasonally due to reversing monsoon winds, resulting in seasonal changes in marine productivity patterns in different areas of the bay (e.g., Gomes, Goes, & Saino, 2000; Martin & Shaji, 2015).
Previous studies have identified how inputs of inorganic nutrients from rivers and the deep ocean determine seasonal CHL concentrations in the Bay of Bengal (e.g., Gomes, Goes, & Saino, 2000; Levy et al., 2007; Vinayachandran, 2009). The supply of riverine nutrients from river discharge elevates CHL concentrations mainly in coastal areas during the boreal summer (e.g., Vinayachandran, 2009; Kay, Caesar, & Janes, 2018), especially in the northern bay, where the Ganges–Brahmaputra–Meghna river system ranks fourth globally in freshwater outflow to the sea (average: 1032 km3 year–1; Dai & Trenberth, 2002). By contrast, inputs of deep-ocean nutrients due to upwelling and vertical mixing elevate CHL concentration mainly in the south-western bay during the boreal winter (e.g., Martin & Shaji, 2015; Vinayachandran & Mathew, 2003).
Besides nutrient inputs from rivers and the deep ocean, atmospheric DD can also be a potent source of inorganic nutrients to the bay. Grand et al. (2015) have reported that the concentration of nutrients in the surface water of the Bay of Bengal is highly consistent with the distribution of mineral atmospheric DD, except in the northern bay, where the GBR largely supplies nutrients. Yadav, Sarma, Rao, and Kumar (2016) have recently confirmed that atmospheric DD increases CHL concentrations in September even in coastal areas, where the input of riverine nutrients is quite high.
To date, however, the impact of various nutrient sources on CHL has not been mapped in detail across the entire Bay of Bengal. Identifying the main sources of nutrients that determine CHL concentrations is a prerequisite to fully understanding the impacts of climate change on primary production in the Bay of Bengal and hence on the Bay of Bengal LME overall. This is because climate patterns such as the El Niño/Southern Oscillation (ENSO) and the Indian Ocean Dipole (IOD) do not drive ocean primary production directly. Instead, they affect productivity indirectly through nutrient inputs by modifying river discharge, ocean upwelling and downwelling, and atmospheric circulation. Understanding the impacts of climate change on primary production in the Bay of Bengal is particularly important given the strong relationship between phytoplankton primary productivity and fisheries production, meaning that this knowledge is needed to take action toward climate change adaptation in fisheries. In this study, we used multi-year satellite-derived CHL concentrations, in situ GBR discharge, and modelled DD to assess the spatial extent of the influence of nutrients from various sources (i.e., rivers, deep ocean layers, and the atmosphere) on CHL concentrations in the Bay of Bengal.
2. Methods
2.1 Region of study
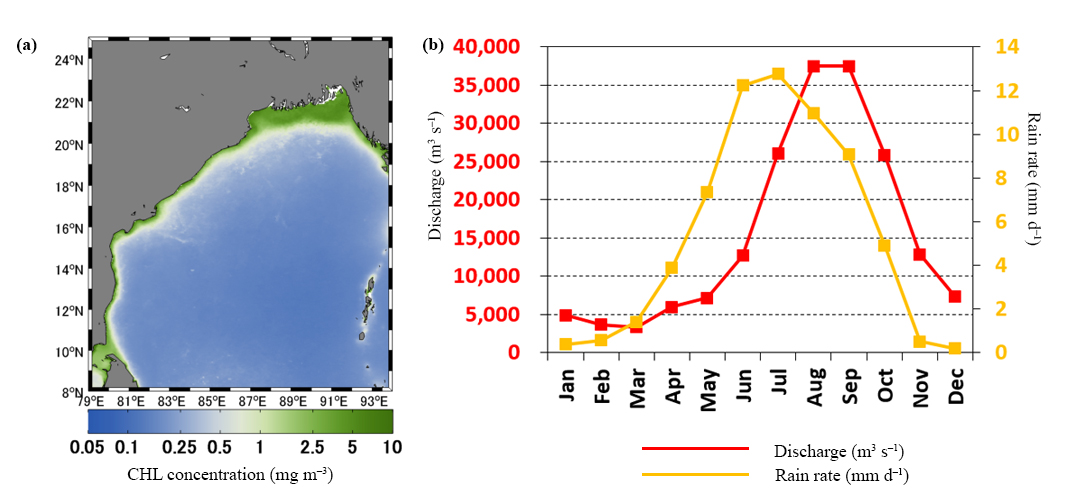
The study region selected for this study ( Figure 1a) is characterized by relatively low offshore satellite-derived CHL concentrations (< 0.5 mg m–3) but high coastal CHL concentrations (> 2 mg m–3) associated with terrigenous inputs from adjacent river systems. A large area of high CHL concentration is apparent along the northern coast and is attributable to discharge from large river systems such as the GBR (e.g., Gomes, Goes, & Saino, 2000).
On average, freshwater discharge from the GBR peaks in mid-to-late summer (August to September, Figure 1b). These high freshwater discharges are associated with peaks in precipitation that occur 1–2 months prior (in June or July). The discharged freshwater contains high suspended sediment loads, increasing turbidity along the northern coast. Additionally, large freshwater inputs strengthen water-column stratification, which can restrict nutrient input from the deep ocean (Kumar et al., 2002; Madhupratap et al., 2003).
2.2 Data sources and analysis
We downloaded satellite-derived, blended monthly CHL concentration at 4-km resolution from the ESA Ocean Colour Climate Change Initiative (https://esa-oceancolour-cci.org), monthly sea surface height anomaly (SSHA) at 25-km resolution from the AVISO+ Satellite Altimetry Database (https://www.aviso.altimetry.fr), monthly rain rate from the Asia-Pacific Data-Research Center (http://apdrc.soest.hawaii.edu), and daily sea surface temperature (SST) at 4-km resolution from NOAA (https://www.nodc.noaa.gov). Daily SST data were then averaged to produce monthly mean SSTs. Changes in SST and SSHA are widely used to assess nutrient inputs from the deep ocean associated with physical oceanographic processes such as upwelling and vertical mixing (e.g., Rao, Smitha, & Ali, 2000; Latha et al., 2015; Singh, Gandhi, Ramesh, & Prakash, 2015 ; Siswanto, 2015; Honda et al., 2018). In this study, we used satellite data from 1997 to 2016. Detailed descriptions of the algorithms used to calculate CHL concentration, SSHA, and SST can be found on the websites for each data source.
As a proxy for riverine nutrient input, we used in situ GBR discharge data from the Bangladesh Water Development Board (https://www.bwdb.gov.bd). Atmospheric DD data were derived from the Spectral Radiation-Transport Model for Aerosol Species ( Takemura et al., 2000; Takemura, Nakajima, Dubovik, Holben, & Kinne, 2002; Takemura, Nozawa, Emori, Nakajima, & Nakajima, 2005), a numerical model developed by the Research Institute for Applied Mechanics at Kyushu University (http://sprintars.riam.kyushu-u.ac.jp). To represent ENSO variability, we used the index Nino3.4 from the NOAA Climate Prediction Center (https://www.cpc.ncep.noaa.gov). To ensure consistency with satellite data, particularly for spatiotemporal and linear regression analysis, we analyzed river discharge, DD, and climate indices from 1997 to 2016.
Multiple linear regression analysis (MLRA) based on the methods described in Siswanto (2015) and Nathans, Oswald, and Nimon (2012) was used to relate CHL concentration to other environmental variables and determine where inorganic nutrients from the deep ocean or atmosphere were more important. The analytical procedure included removing seasonal variations and trends and standardizing variables to a mean of zero and standard deviation of one. Standardization allowed each variable’s effect on CHL concentrations to be compared against that of other variables.
To carry out the MLRA, it was first necessary to fill any spatiotemporal gaps in the data. Unlike the SSHA and DD data, CHL and SST data were observed by satellite-borne optical and infrared sensors and contained data gaps caused by clouds and rain belts. Thus, interpolation and data reconstruction were needed to fill the missing data pixels. We used the data interpolating empirical orthogonal functions (DINEOF) method (e.g., Alvera-Azcarate, Barth, Rixen, & Beckers, 2005) to do so. The binary code used to run the DINEOF method can be found on the DINEOF website (https://github.com/aida-alvera/DINEOF).
Another requirement of MLRA is that the spatial dimensions (in latitude and longitude) of the dependent variable (CHL concentration) and independent variables (SST, SSHA, and DD) be the same. Therefore, prior to MLRA, re-gridding with linear interpolation was applied to the SST, SSHA, and DD data to resize their spatial dimensions. A p-value of 0.05 was used as the threshold for significance in all statistical comparisons.
3. Results and discussion
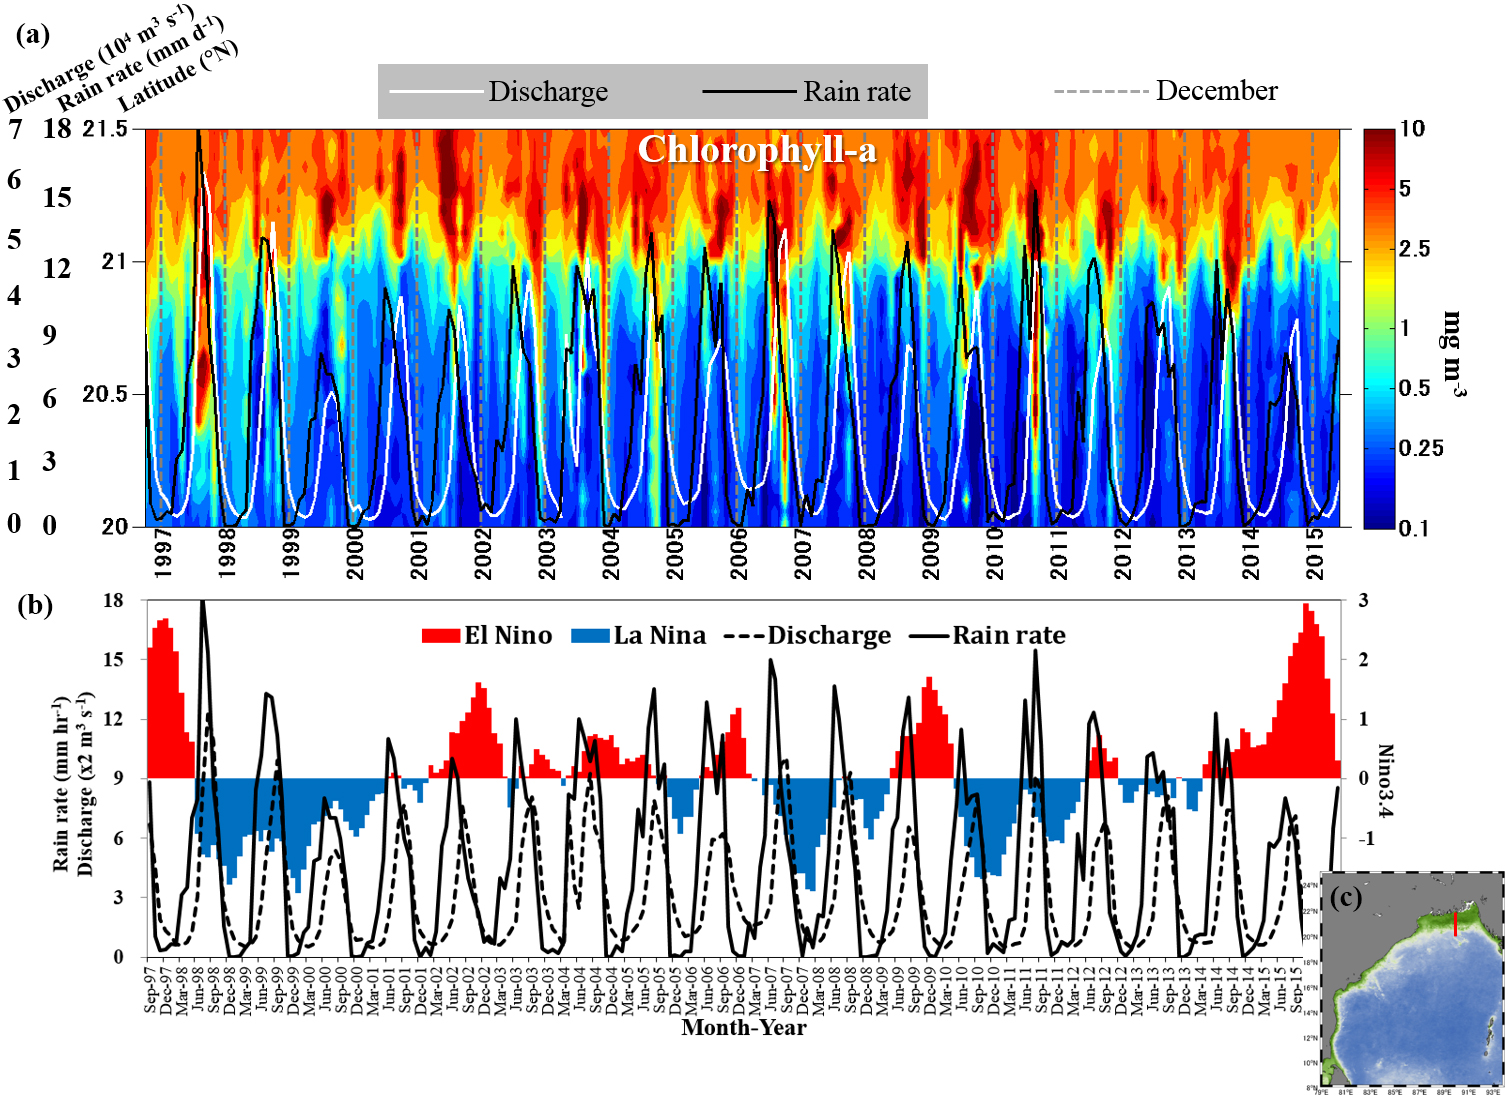
To assess the maximum distance offshore that riverine nutrients from the GBR affect primary production, we calculated a time series of CHL concentration ( Figure 2a) across a north-south transect (Figure 2c ). Offshore dispersions of high CHL concentration were particularly obvious during summer and fall (Figure 2a and b) and were related to GBR discharge. Particularly during the summer and fall of 1998, 2007 and 2011, we observed extremely high rain rates over the catchment area and high discharge from the GBR (Figure 2b) associated with La Niña conditions (Figure 2b). However, even during these extreme high-rainfall, high-discharge events, the southernmost latitude where elevated CHL concentrations could be observed was about 20°N. This implies that river-borne nutrients are only important in determining CHL concentrations in coastal areas (approximately 200 km from the coastline). This conclusion is consistent with the results reported by (Madhupratap et al., 2003).
Thus, other nutrient sources (i.e., the deep ocean and atmosphere) might be more important in determining CHL concentrations offshore and in the open ocean. We used MLRA to assess the dependencies of CHL concentration on DD (i.e., atmosphere-borne nutrients) and SSHA and SST (proxies for nutrient input from the deep ocean). SST co-varies with nutrient supply from the deep ocean because upwelling and/or vertical mixing of nutrient-rich deep waters transfers the low water temperatures at depth to the surface. Upwelling also tends to decrease SSHA. Therefore, falling SSTs or low SSHA is usually associated with high nutrient supply to the surface from depth.
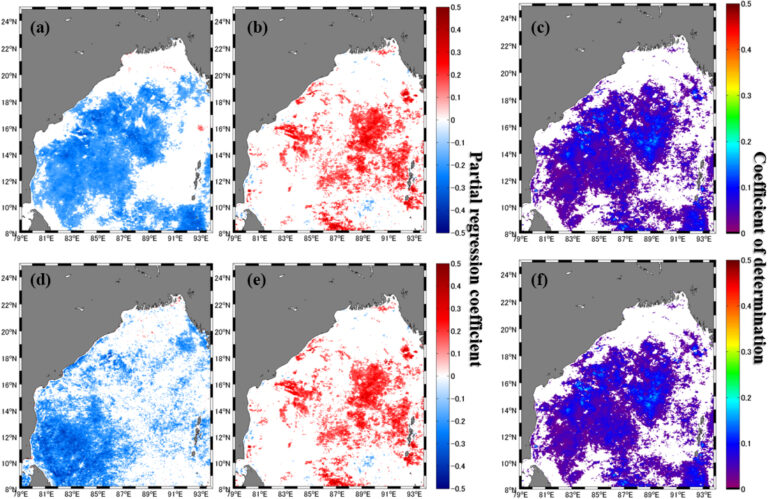
We estimated partial regression coefficients of SSHA (βSSHA) and DD (βDD) by relating CHL concentrations to SSHA and DD in an MLRA ( Figure 3a and b). Similarly, we estimated partial regression coefficients for SST (βSST) and DD (βDD) by relating CHL to SST and DD (Figure 3d and e). Based on the coefficient of determination of these partial regressions (Figure 3c and f), it appears that nutrients from both the deep ocean and atmosphere are important for phytoplankton growth in offshore waters.
βSSHA and βSST were significantly negative, especially in the south-western and western parts of the bay ( Figure 3a and d). This indicates that CHL concentrations increased with proxies of stronger upwelling and vertical mixing, such as low SSHA and low SST. The implication is that nutrients from deep waters seemed to be more important than DD in determining CHL variation in these areas. By contrast, the fact that βDD was significantly positive over the central and eastern parts of the bay (Figure 3b and e) indicated that CHL concentrations tended to increase with higher DD. This suggests that atmospheric dust-borne nutrient deposition is more important than nutrient supply from deep water (by upwelling and mixing) in determining CHL variation in these areas.

As previously reported, the upwelling and vertical mixing that pumps nutrients from deep to surface waters (thereby triggering phytoplankton blooms) in the south-western and western Bay of Bengal can be driven by mesoscale cyclonic eddies and the passage of cyclones ( Chen et al., 2013; Sarma et al., 2016). Although increases in CHL concentration can also be observed in the central bay after the passage of cyclones, mesoscale eddy formation is rare in this area (in comparison to the western bay), and the presence of a barrier layer formed by freshwater influx from the GBR means that the central bay is less sensitive to upwelled nutrients than the south-western and western areas of the bay. The barrier layer extends to depths of 25–30 m from the surface and restricts the entrainment of nutrients from depth ( Vinayachandran, Murty, & Babu, 2002). Based on these results, we suggest that any attempt to understand the impact of nutrients from a certain source (e.g., atmospheric DD) should also consider the possible impacts of nutrients from other sources (e.g., upwelling).
Although the influence of ENSO on river discharge rates and hence on CHL concentrations was detected in coastal waters in our study ( Figure 2), climate is also expected to affect nutrient inputs to the Bay of Bengal in other ways. For example, climate variations are expected to affect the dryness of terrestrial environments and hence the intensity of atmospheric DD. Also, seasonal surface currents from the Arabian Sea to the western Bay of Bengal have been affected by anomalous wind patterns and changes in ocean surface circulation in the equatorial Indian Ocean (especially related to the IOD). Because these ocean surface currents are important drivers of mesoscale eddy generation, these changes in surface currents are also expected to influence CHL concentrations. More work is needed to identify how ENSO and IOD will influence CHL concentrations in the Bay of Bengal through these mechanisms.
4. Conclusion
Nutrients supplied from river discharge, deep ocean waters, and atmospheric deposition affected CHL concentrations in different regions of the Bay of Bengal. Nutrients supplied by river discharge appear to be important only in waters within approximately 200 km of the coast, whereas nutrients supplied from the deep ocean influenced CHL concentrations in the south-western and western areas of the bay, and atmospheric nutrient input was most important in the central and eastern bay. Because of the large number of factors that can determine CHL concentrations in this region, any attempt to understand the impact of nutrients from a certain source should consider the potential impacts of other sources. Although we were able to identify the impact of climate on CHL through river discharge, future studies should investigate how climate change might affect CHL concentrations by modifying atmospheric aerosols and mesoscale eddy generation.