Riverine carbon flux from the Red River system (Viet Nam and China): a modelling approach
Keywords
Carbon flux · Climate change · Human activity · Red River · Riverstrahler · Seneque
Highlights
- The Seneque/Riverstrahler was successfully applied to the Red River system
- Riverine OC export of the Red River at Son Tay site was 327 GgCyr-1 in 2014
- The Red River is a strong source release of CO2 to the atmosphere
- OC both point and non-point sources contribute to high heterotrophic situation of the Red River
1. Introduction
Tropical rivers which contribute 66% of freshwater outflow, 73% of sediment loads and approximately 61% of terrestrial net primary production, have a critical role in the total global fluvial carbon flux (Huang et al., 2012). However, for many large Asian rivers, river water discharge and sediment loads have been altered dramatically over the past decades as a result of reservoir impoundment, land use, population, and climate changes. It is known that changes in land use (deforestation and agricultural intensification) have resulted in accelerating soil erosion (Tian et al. 2014; Vanwalleghem et al., 2017), leading to increase in sediment loading (Bagalwa et al., 2015) whereas reforestation and dam impoundment can significantly reduce sediment loads (Lu et al., 2015; Strehmel et al., 2016). The changes in sediment loads of these river systems may affect their carbon fluxes to estuaries, coastal regions and even continental shelf areas (Galy et al., 2015; Tamooh et al., 2014).
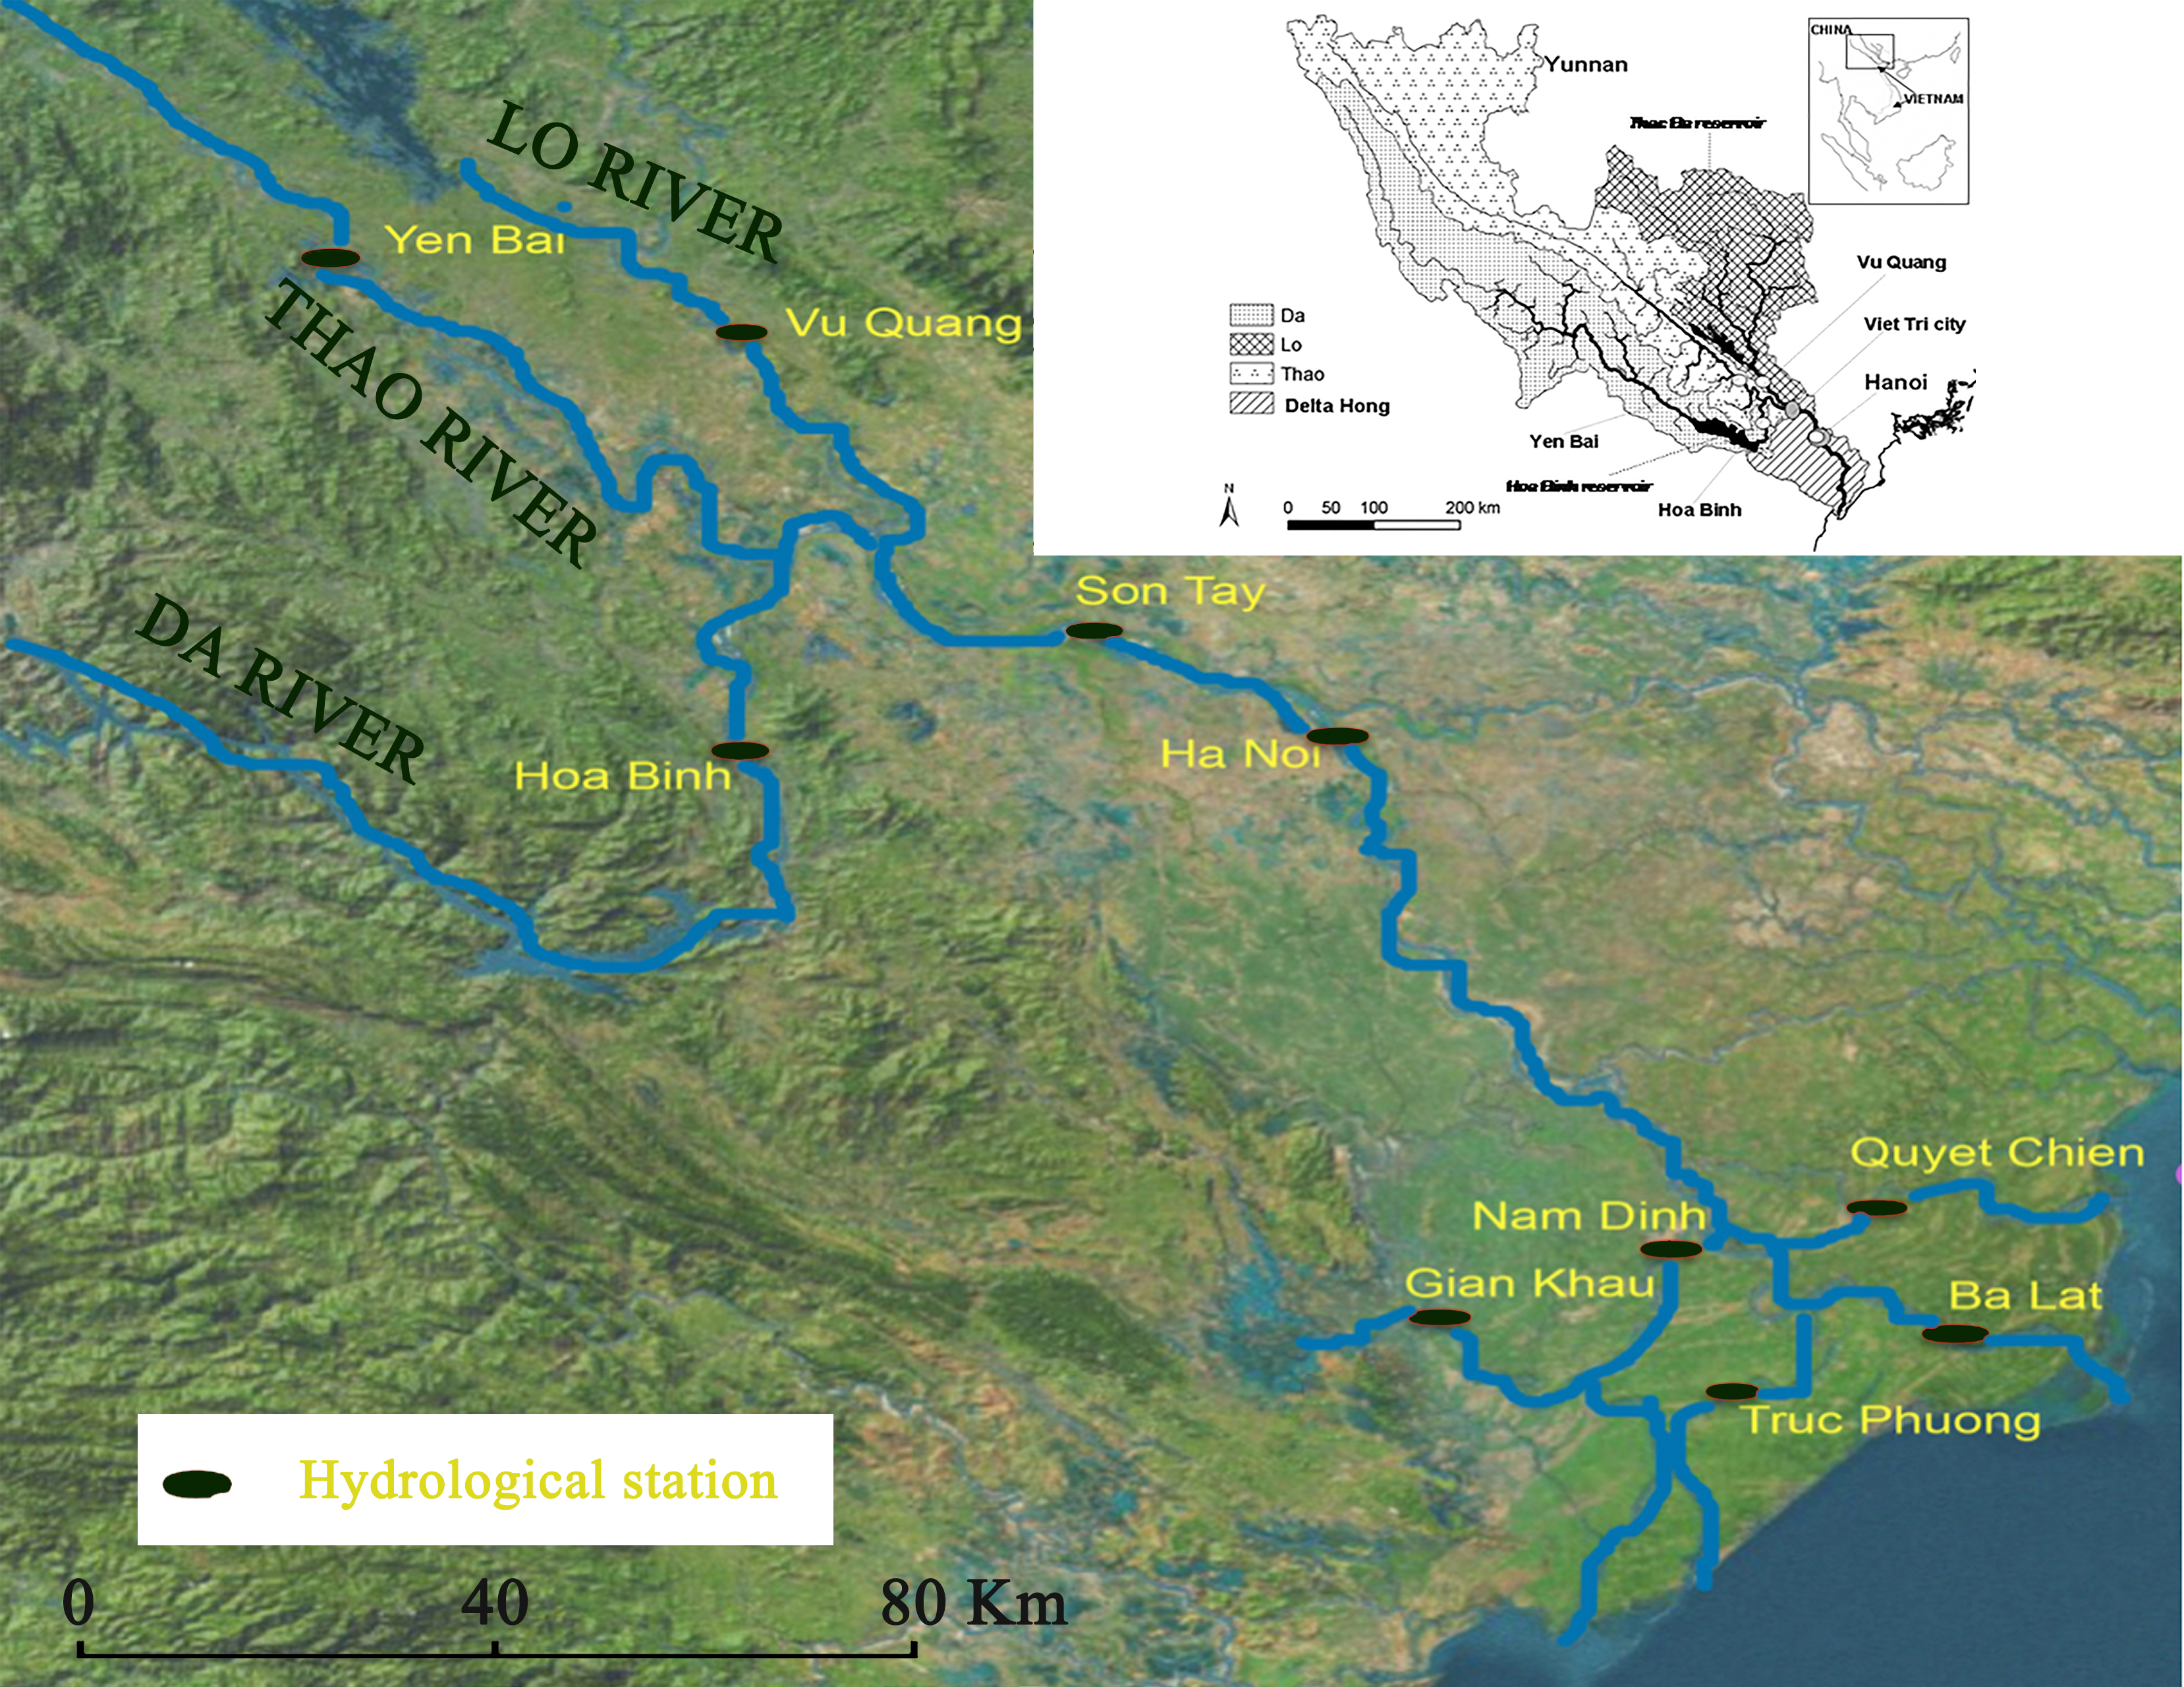
The Red River (basin area: 156,450 km2) (Figure 1) is a typical example of South East Asia rivers strongly affected by climate and human activities. Previous studies focused on hydrology, suspended sediment load, nutrients and water quality of the Red River (Le et al., 2015; Dang et al., 2010). This study is structured around the Seneque/Riverstrahler model for relating the carbon transfer and outgassing of the whole Red River drainage network to human activities and natural conditions in its watershed. The model is tested and validated to describe the carbon transfer and emission in the system for the present situation and then is employed to explore scenarios of changes in human activities at the 2050s horizon.
2. Methodology
2.1 The Seneque/Riverstrahler Model
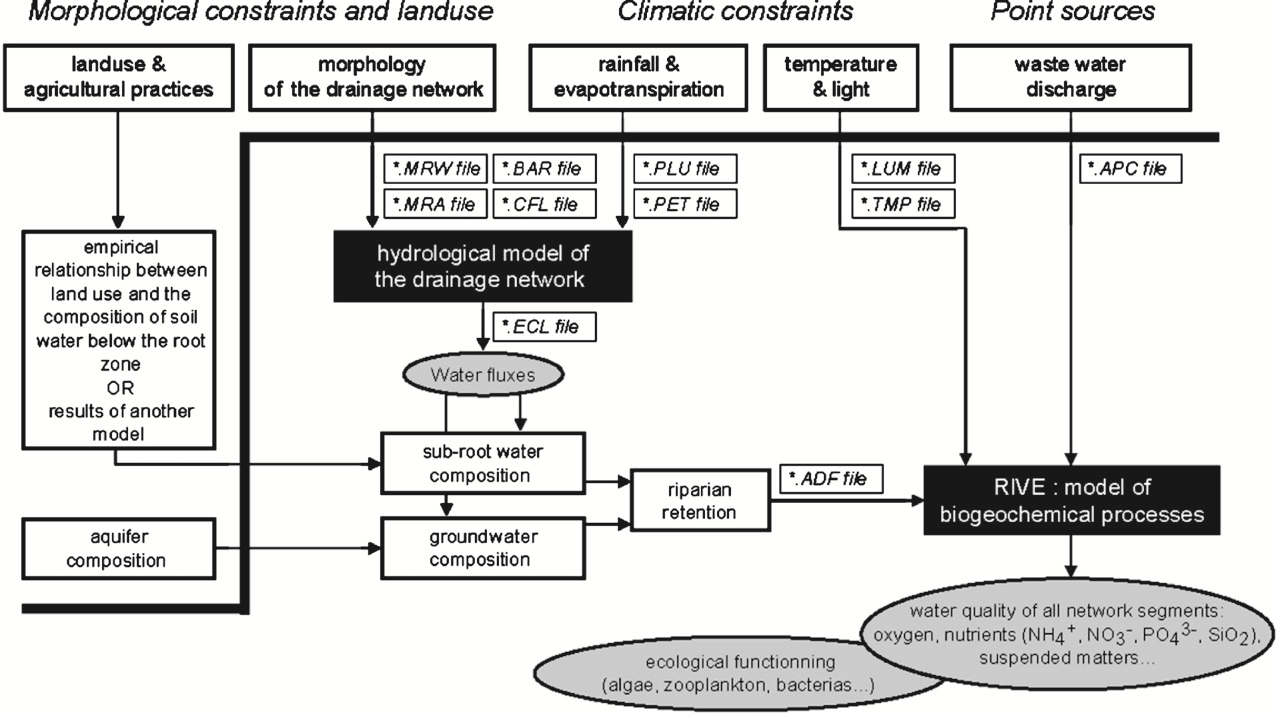
The Seneque/Riverstrahler model (Billen and Garnier, 1999), a biogeochemical model (RIVE) of in-stream processes embedded within a GIS interface (Seneque), providing a generic model of the biogeochemical functioning of the whole river systems (from 10 to >100,000 km2), is designed to calculate the seasonal and spatial variations of water quality (Ruelland et al., 2007).
The model uses drainage network morphology, meteorological conditions, and land-use, point, and non-point sources, to calculate geographical and seasonal variations of the water quality variables at a 10-day time step (Figure 2). It was developed for describing nutrient transfer in large drainage networks in France (Billen et al., 2007), central Europe (Garnier et al., 2002), in Belgium (Servais et al., 2007), in Viet Nam (Le et al., 2010). Recently, the model has been adapted to investigate the transport of FIB in France (Ouattara et al., 2013) and in Laos (Causse et al., 2015). Here the model was applied to the Red River to simulate riverine OC concentrations and fluxes and to estimate the carbon metabolism.
In this study, the Seneque/Riverstrahler model was developed using the data from the Red River basin for the period 2008–2015. The river discharges at different stations were calculated by the model based on specific discharge measured at three upstream stations, separated into a base flow and surface runoff owing to the recursive digital filter of Eckhardt (2005), and the rules of dam operation.
2.2 Data Collection
The Red River: The three major tributaries: Thao, Da, and Lo, originate from Yunnan (China), then flow into Viet Nam, join at Viet Tri and form a large delta before flowing into the South Asian Sea.
Climate: The climate in the basin is influenced by the Asian tropical monsoon. There are two distinct seasons: the rainy season, from May to October and dry season occurs from November to April. The rainy season accumulates 85–90% of the total annual rainfall. The average daily temperature varied from 14–27 °C. Relative humidity was high throughout the year, averaging 82 – 84%.
Hydrology: The river discharge varies seasonally as a consequence of seasonal differences in rainfall. High flow (July to September) represent around 50–65% of the annual flow whereas the dry season flow accounts for 20–30% of annual flow. The daily river discharges at the outlets of the Thao (Yen Bai station), the Da (Hoa Binh station) and the Lo (Vu Quang station) and of the downstream Red river at Hanoi station as shown in Figure 1 averaged at 720 ± 159 m3. s-1; 1670 ± 284 m3. s-1; 1020 ± 227 m3. s-1 and 2500 ± 477 m3. s-1 respectively (MONRE, 1960 – 2015). The details of hydrological changes for the long-term period 1960–2010 was presented in Le et al (2015). There are four large reservoirs in the Red river basin in Viet Nam: The Hoa Binh and Son La across the Da River; the Tuyen Quang and Thac Ba across in the Lo River. Their characteristics were presented in (Le et al., 2015).
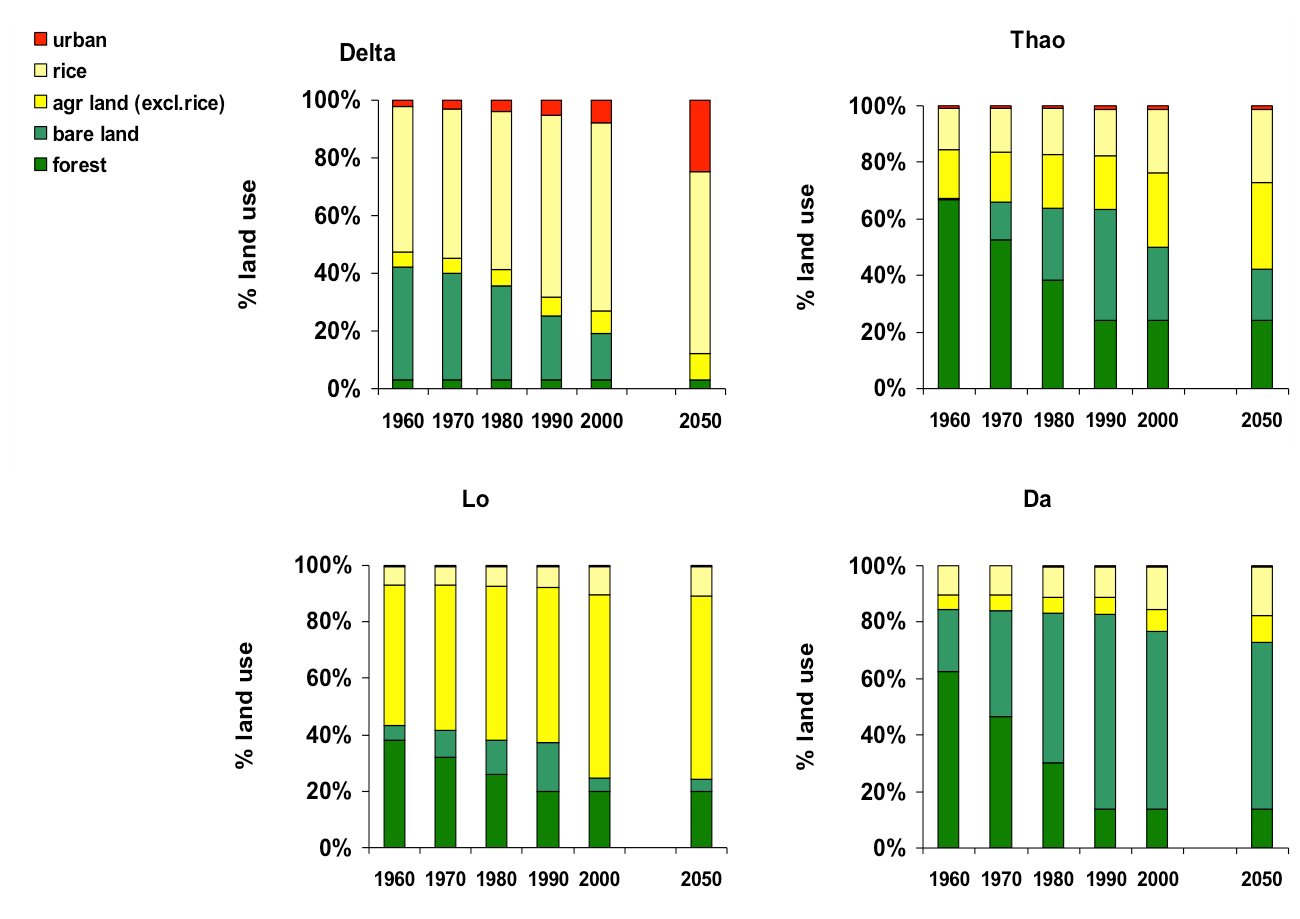
Land use: The forest area in the Red River delta has been quite stable for several centuries but the deforestation in the plateau and mountainous regions dramatically accelerated during the war years (the 1970s), followed by a period of rapid population growth and economic development (the 1990s). Economic development and structural change lead to considerable changes in land use with the expansion of planted forests and urbanization at the expense of rice paddies, mangroves and other non‐production forests, and shrublands (Figure 3).
The GIS land use coverage information and the OC concentrations in small rivers, streams, and ditches drain of homogeneous land cover types were used to characterize OC concentrations in surface runoff and in base flow (Baric and Sigvardsson, 2007).
Population: Administratively, the Red River basin covers 25 provinces with a population of 32 million people. At present, about half of the inhabitants in the Red River basin live in rural areas with the rest living in cities, towns, and townships. However, the process of urbanization is accelerating due to rural exodus. The population density in the urban areas is expected to rapidly increase in the 2050s.
The OC point sources such as the discharges of domestic and industrial wastewater were taken into account in the model. Based on the census of urban population and industrial activities (Le et al., 2005), taking into account waste management type such as centralized wastewater treatment, direct discharge into rivers or agricultural recycling are adopted.
Validation data: In order to validate the modelling results, water quality data (including particulate organic carbon POC and dissolved organic carbon DOC) from the monthly monitoring surveys at the ten stations along the Red River (Figure 1) during 2008 – 2015 were used. Field sampling, laboratory analysis, and statistical analysis have been presented in (Le et al, 2017 a, b).
3. Results and Discussions
3.1 Modelling Using Seneque/Riverstrahler Model for Present Situation
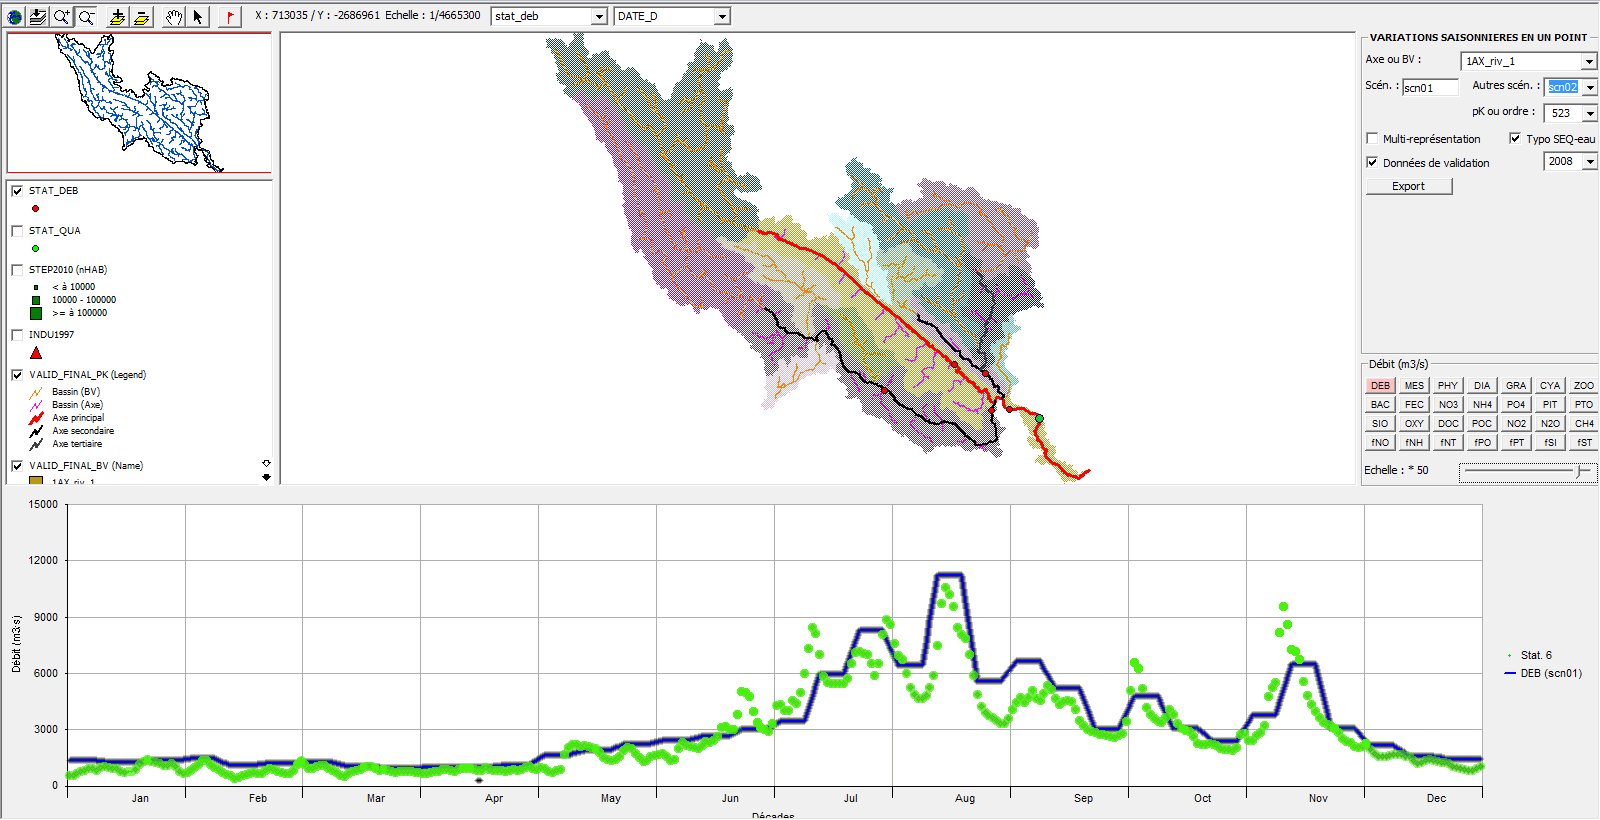
The Seneque/Riverstrahler model was firstly used for calculating river discharge at all sites observed. The modelling results were in good agreement with the observed values at all stations, as confirmed by the Nash and Sutcliffe values (1970) (≥0.7). Figure 4 gives a snapshot of the Seneque/Riverstrahler software for observation and modelling results of the river discharge at Hanoi station.
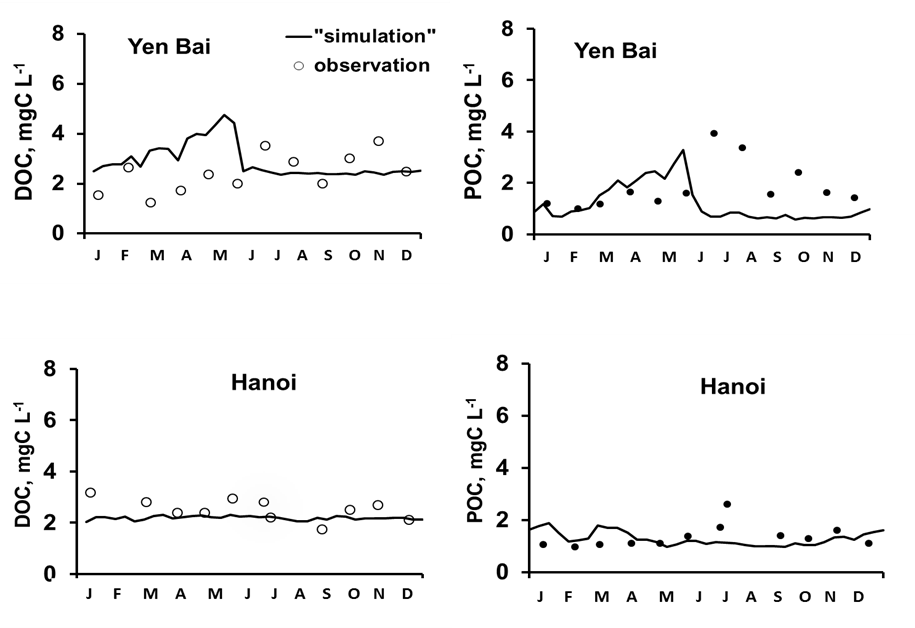
The model was then used to calculate the concentrations of water quality variables, especially OC (POC + DOC). The modelling results were compared that of in-situ measurements and showed a rather good performance similar seasonal and temporal variations all sites, as confirmed by the Nash and Sutcliffe values of 0.6 (Figure 5).
The riverine OC export of the Red River at Son Tay site, estimated from the calculated OC concentrations and river discharges for the year 2014, was 327 GgCyr-1, equivalent to 2200 kgCkm2yr-1. This value was very close to the ones observed in 2008–2010 (Le et al., 2017a) and some Asian rivers such as the Yangtze, the Pearl and the Luodingjiang Rivers (China), the Godavari River (India), but much lower than the Ayeyarwady–Thanlwin River (Myanmar) (Table 1).
TABLE 1. OC loading of some Asian rivers
Using the model, the rates of primary production P and respiration R in the Red River for 2014 were determined. The results showed that respiration (270 GgCyr-1) was considerably higher than primary production (57.5 GgCyr-1). This means that the Red River is a significant source of CO2 to the atmosphere from outgassing across the water-air interface as many rivers in the World which is also noted by (Richey et al., 2002). This strong heterotrophic character of the Red River is due to the high allochthonous OC inputs from both point and non-point sources. Note that these results did not include CO2 outgassing from dissolved inorganic carbon from the watershed.
3.2 Exploring Scenarios
We used the model to predict future OC concentrations in the Red River system for a “business as usual” 2050 scenario based on the present hydrological data of the 3-year period 2012–2014 and future demographics and land use in the Red River system for the 2050 horizon.
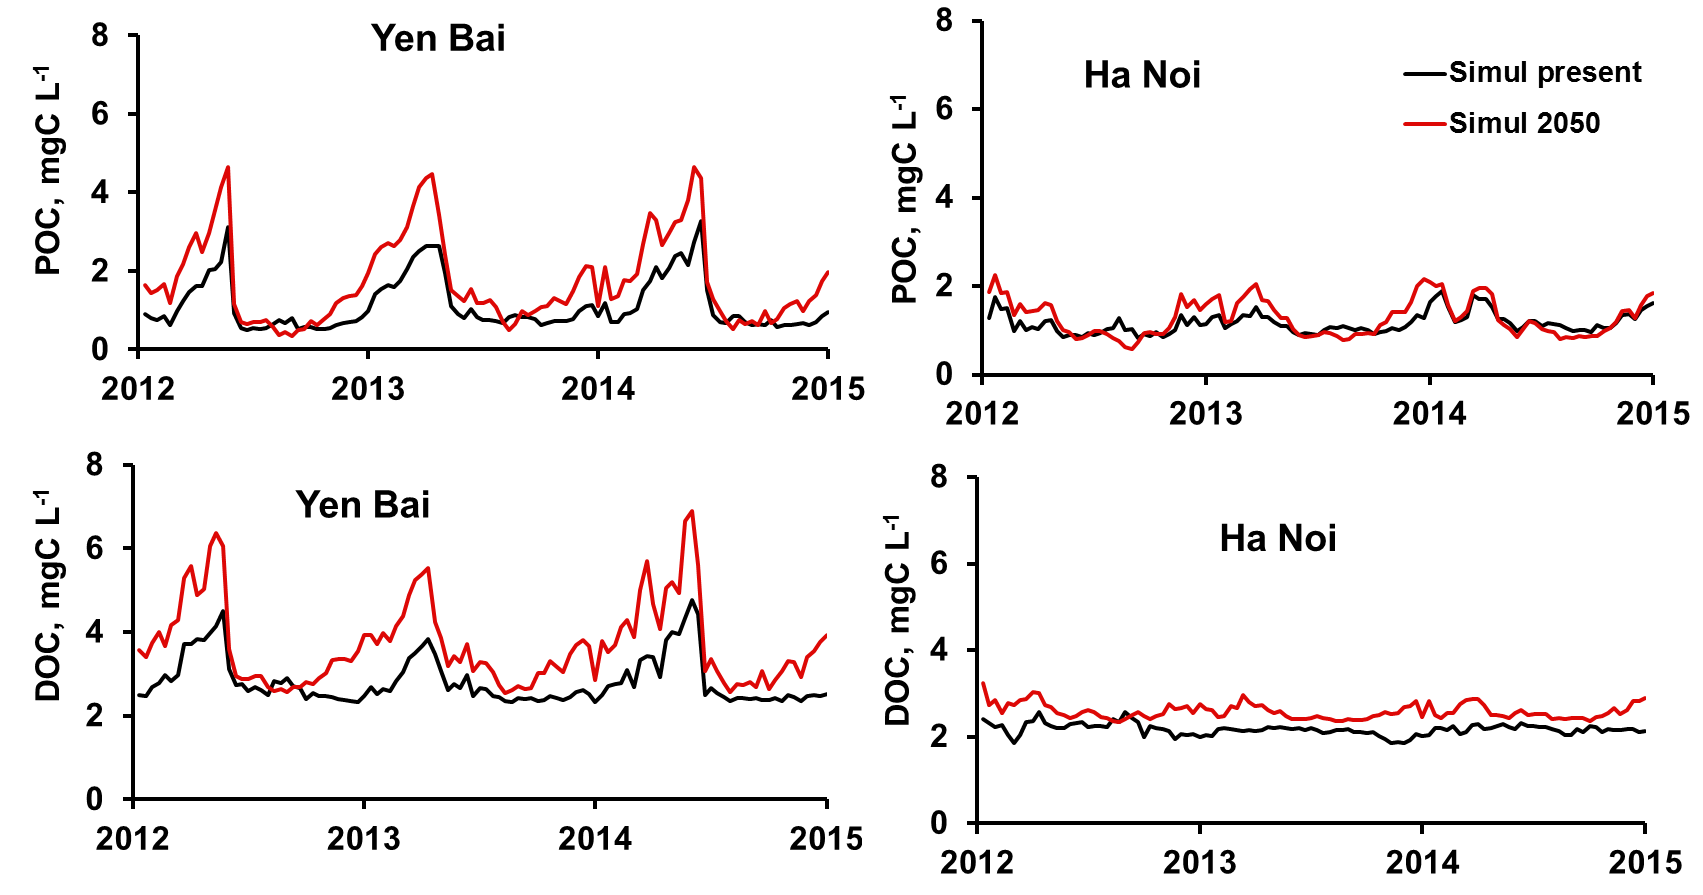
The scenario results showed that a limited increase of OC concentrations compared with the present situation at two stations Yen Bai and Hanoi (OC concentrations in 2050 scenario increased by 36% and 16%, respectively) was found (Figure 6). This was particularly the case in Hanoi even though the population is expected to triple by 2050. The reason may be due to the different stability of various components and sources for riverine OC inputs. Indeed, the study on the Haihe River (in China) showed that OC in a tributary, the Majia, was relatively stable by strong of OC in sediments and riverbank soils whereas it was complicated and influenced by humans and surroundings for another tributary, the Tuhai (Cao et al., 2015). Besides, this perhaps surprising result further underlines the difficulties that many developing countries are facing in terms of water quality. On the one hand, such a result can be considered as being relatively positive i.e. slightly increase in OC loads despite a large increase in population. On the other hand, it also means that water quality will not be improved in the future unless efforts are made to control diffuse sources in the basin. However, the setting up and running of such program requires extremely large investments, strong legislation, and effective education programs.
As mentioned above, with the high inputs of allochthonous OC from both point and diffuse sources, the Red River system was a strongly heterotrophic system, which means that the Red River was a strong source of CO2 to the atmosphere. As presently documented, the scenario for 2050 of OC would show that an increase of 24% in OC concentrations for the whole Red River will occur in the future, in response to large increases in the urban populations. Therefore, it appears that this system will remain a strong source of CO2 to the atmosphere in the future.
4. Conclusion
The Seneque/Rivershtrahler model was successfully applied to a large Asian river, the Red River for describing the natural and human impact on riverine carbon transfer and emission. In the present situation, the model successfully simulated the seasonal and temporal variations and the levels of riverine carbon concentrations for all the sites observed in the Red River system. An OC riverine export of 327 GgCyr-1 for the year 2014 was calculated for the Red River at Son Tay site. This value was closed with that some Asian rivers. Due to the high allochthonous OC inputs from both point and diffuse sources, the Red River system is a strongly heterotrophic system. The 2050s scenario results showed that an increase of 24% in OC concentrations in the future will occur in response to large increases in the urban populations and that this system will remain a strong source of CO2 to the atmosphere in the future.
5. Acknowledgement
We thank the financial support of the Asia-Pacific Network for Global Change Research (APN). We highly appreciate the support from the Institutions where the project participants involved, especially, the INPC, VAST for providing us excellent administrative support. We thank numerous generous persons who helped on local samplings, in-situ sample treatment, and laboratory analysis.
6. References
- Baric, D., Sigvardsson, E. (2007). Distribution and mobilization of arsenic in Red river delta aquifers, Viet Nam. Department of Earth Sciences, Goteborg, Sweeden, 84pp.
- Billen, G., Garnier, J. (1999). Nitrogen transfers through the Seine drainage network: a budget based on the application of the ‘Riverstrahler’ model. Hydrobiologia 410, 139-150.
- Billen, G., Garnier, J., Mouchel, J.M., Silvestre, M, (2007). The Seine system: Introduction to a multidisciplinary approach to the functioning of a regional river system. Sci. Total Environ. 375, 1-12.
- Bird, MI, Robinson, RAJ, Win, ON… (2008). A preliminary estimate of organic carbon transport by the Ayeyarwady (Irrawaddy) and Thanlwin (Salween) Rivers of Myanmar. Quaternary International, 186 (1): 113–122. DOI: 10.1016/j.quaint.2007.08.003.
- Bagalwa, M., Majaliwa, J.G.M., Kansiime, F., Bashwira, S., Tenywa, M., Karume, K., (2015). Sediment and nutrient loads into river Lwiro, in the Lake Kivu basin, Democratic Republic of Congo. Int. J. Biol. Chem. Sci., 9(3), 1678 – 1690.
- Causse, J., Billen, G., Garnier, J.…(2015). Field and modeling studies of Escherichia coli loads in tropical streams of montane agro-ecosystems. J Hydro-Environ. Res. 9, 496-507.
- Cao, Q.Q., Wang, R.Q., J.Liu J. (2015). Composition and Distribution of Organic Carbon in River Sediments: a Case Study of Two Northern Chinese Rivers. Pol. J. Environ. Stud. 24(3), 969-975. DOI: 10.15244/pjoes/37552.
- Eckhardt, K. (2005). How to construct recursive digital filters for baseflow separation. Hydrol Process, 19, 507-515.
- Dang, T.H., Coynel, A., Orange, D…(2010). Long-term monitoring (1960–2008) of the river-sediment transport in the Red River Watershed (Vietnam): Temporal variability and dam-reservoir impact. Science of the Total Environment, 408, 4654 – 4664.
- Garnier, J., Billen, G., Hannon, E., Fonbonne, S… (2002). Modelling the transfer and retention of nutrients in the drainage network of the Danube River. Estuar. Coast. Shelf Sci. 54, 285-308.
- Huang, T.H., Fu, Y.H., Pan, P.Y… (2012). Fluvial carbon fluxes in tropical rivers. Curr. Opin. Environ. Sust. 4, 162-169.
- Le, T.P.Q., Billen, G., Garnier, J… (2005). Nutrient (N, P) budgets for the Red River basin (Vietnam and China). Glob. Biogeochem. Cycl. 19, GB2022.
- Le, T.P.Q., Billen, G., Garnier, J.,…(2010). Nutrient (N, P, Si) transfers in the subtropical Red River system (China and Viet Nam): Modelling and budget of nutrient sources and sinks. J. Asian Earth Sci. 37, 259-274.
- Le, T.P.Q., Billen, G., Garnier, J… (2015). Long-term biogeochemical functioning of the Red River (Vietnam): past and present situations. Regional Environmental Change, 15(2): 329 – 339. DOI: 10.1007/s10113-014-0646-4.
- Le, T.P.Q., Dao, VN., Rochelle-Newall, E….(2017a). Total organic carbon fluxes of the Red River system (Vietnam). Earth surface processes and landforms. DOI:10.1002/esp.4107.
- Le, T.P.Q et al. (2017b). Final project report «Carbon fluxes and emission from the Red River (Vietnam and China): human activities and climate change«, project ARCP2014-03CMY-Quynh project, APN publication, APN E-Lib,71 pages.
- Lu, X.X., Oeurng, C., Le, T.PQ., Duong, T.T. (2015). Sediment budget as affected by the construction of a sequence of dams in the lower Red River, Viet Nam. Geomorphology, 248, 125–133. https://doi.org/10.1016/j.geomorph.2015.06.044
- MONRE, (1960 – 2015). Vietnam Ministry of Environment and Natural Resources. Report Annual on Hydrological Observation in Vietnam.
- Nash, JE and Sutcliffe, JV. (1970), River flow forecasting through conceptual models part I A discussion of principles, Journal of Hydrology, 10, 282-290.
- Ni, HG, Lu, FH, Luo, XL… (2008). Riverine inputs of total organic carbon and suspended particulate matter from the Pearl River Delta to the coastal ocean off South China. Marine Pollution Bulletin 56, 1150–1157.
- Pham, M.H., Nguyen, T.N., Nguyen, H.M… (2010). Recent levels of organochlorine pesticides and polychlorinated biphenyls in sediments of the sewer system in Hanoi, Vietnam. Environ. Pollut. 158, 913–920.
- Ran, L.S., Lu, X.X., Sun, H… (2013). Spatial and seasonal variability of organic carbon transport in the Yellow River, China. Journal of Hydrology 498: 76–88
- Richey, J.E., Melack, J.M., Aufdenkampe … (2002). Outgassing from Amazonian rivers and wetlands as a large tropical source of atmospheric CO2. Nature, 416, 617-620.
- Ruelland, D., Billen, G., Brunstein, D., Garnier, J. (2007). SENEQUE: A multi-scaling GIS interface to the Riverstrahler model of the biogeochemical functioning of river systems. Sci. Total Environ. 375, 257-273.
- Sarin, M.M., Sudheer, A.K., Balakrishna, K. (2002). Significance of riverine carbon transport: a case study of a large tropical river, Godavari (India). Science in China – Series C 45, 97–108.
- Servais, P., Billen, G., Goncalves, A… (2007). Modelling microbiological water quality in the Seine river drainage network: past, present, and future situations. Hydrology and Earth System Sciences 11, 1581-1592.
- Strehmel, A., Schmalz, B., Fohrer, N. (2016). Evaluation of Land Use, Land Management, and Soil Conservation Strategies to Reduce Non-Point Source Pollution Loads in the Three Gorges Region, China. Environmental Management 58, 906. doi:10.1007/s00267-016-0758-3.
- Ouattara, N.K., De Brauwere, A., Billen, G., Servais, P., (2013). Modelling fecal contamination in the Scheldt drainage network. Journal of Marine Systems 128, 77-88.
- Tamooh, F., Meysman, F.J.R., Borges, A.V… (2014). Sediment and carbon fluxes along a longitudinal gradient in the lower Tana River (Kenya), J. Geophys. Res. Biogeosci., 119, 1340–1353, doi:10.1002/2013JG002358.
- Tian, H., Kamaljit, B., Tao, B. et al … (2014). History of land use in India during 1880–2010: Large-scale land transformations reconstructed from satellite data and historical archives. Global and Planetary Change. 121, 78–88. https://doi.org/10.1016/j.gloplacha.2014.07.005
- Vanwalleghem, T., Gómez, J.A., Amate, J.I. … (2017). Impact of historical land use and soil management change on soil erosion and agricultural sustainability during the Anthropocene. Anthropocene. 17, 13–29.
- Valier, G., Peucker-Ehrenbrink, B. & Eglinton, T. (2015). Global carbon export from the terrestrial biosphere controlled by erosion. Nature 521, 204–207. doi:10.1038/nature14400
- Wang, X, Ma, H, Li, R… (2012). Seasonal fluxes and source variation of organic carbon transported by two major Chinese Rivers – The Yellow River and Changjiang (Yangtze) River. Global Biogeochemical Cycles, 26: GB2025. DOI:10.1029/2011GB004130.