Mapping of dengue vulnerability in the Mekong Delta region of Viet Nam using a water-associated disease index and remote sensing approach
Keywords
Highlights
- Mapping vulnerability to dengue in Viet Nam by exposure and susceptibility components
- Extensive use of remote sensing data for vulnerability mapping
1. Introduction
Under the impact of global climate change on human health, there is an increasing number of infectious disease cases (Patz, Campbell-Lendrum, Holloway, & Foley, 2005), including mosquito-borne diseases such as dengue, one of the most climate-sensitive diseases. Climate factors, in addition to multiple human, biological and ecological determinants, influence the emergence and re-emergence of infectious diseases (Patz & Balbus, 1996). In Southeast Asia, a study by Sia Su (2008) has shown that there was a significant correlation between rainfall and dengue incidence in metropolitan Manila, the Philippines, from 1996 to 2005. Promprou, Jaroensutasinee and Jaroensutasinee (2015) also found a correlation between temperature, rainfall and dengue incidence in southern Thailand using multiple regression analysis. Dom, Hassan, Latif and Ismail (2013b) generated a temporal model using climate variables for the prediction of dengue in Malaysia and showed that climate variables affect dengue incidence in multiple ways. On a regional scale, a review of the impacts of climate change on human health by Patz, Campbell-Lendrum, Holloway and Foley (2005) provided more evidence of the burden of climate change-attributable diseases and emphasized the uncertainty in attributing diseases to climate change, owing to a lack of long-term and high-quality data. However, climate change is certainly not the only factor. The land cover of the area might also have an impact on dengue fever. Cheong, Leitão and Lakes (2014) showed an important correlation between the number of dengue cases and land cover, with human settlements and water body types having higher probabilities of infection than other land types. Besides land cover, dengue incidence occurred higher in the residential area, followed by commercial and industrial area (Dom, Ahmad, Latif, Ismail, & Pradhan, 2013a).
Analysis of vulnerability has popularly been applied to assess health hazards related to climate change (Patz & Balbus 1996; Dickin, Schuster-Wallace, & Elliott, 2013). Mapping health vulnerability to climate change with three components of exposure, sensitivity and adaptive capacity is a popular assessment approach, which includes 3 phases: problem formulation, analysis, and integration (Kovats et al., 2003). Patz and Balbus (1996) proposed a framework for the assessment of health vulnerability due to climate change. Dickin, Schuster-Wallace and Elliott (2013) developed the Water-Associated Disease Index (WADI) approach to provide a “practical tool” and vulnerability map in support of dengue prevention and control in Southeast Asia and South America and on a global scale. Khormi and Kumar (2011) reviewed and highlighted the advantages of geospatial data and techniques in the issue of mapping mosquito-borne diseases where satellite images provide good data with high temporal and spatial resolution to estimate various parameters (rainfall, temperature, soil moisture, land cover type, etc.) to identify mosquito habitats. Geographic information systems (GIS) will merge such information with socio-economic factors and disease incidence, applying spatial statistical analysis to map and model diseases with high accuracy. Recent application of GIS and spatial union analysis in Malaysia was successful in visualizing and predicting dengue hotspot and dissemination pattern (Dom, Ahmad, Latif, & Ismail, 2013c, 2017). The flexibility of the WADI framework allows the ability to adapt multi-dimensional data at different temporal and spatial scales, which can be applied with geospatial data (Louis et al., 2014).
This study focuses on the mapping of dengue vulnerability to the above-mentioned factors for the MRD of Viet Nam. The extensive use of remote sensing data for presenting climate variables in the WADI framework is described in the data and methodology section. GIS-based analyses are applied for processing the outputs, and mapping correlation, temporal and spatial variations are presented in the results and discussion section, followed by the conclusion section.
2. Data and Methodology
2.1 Study site
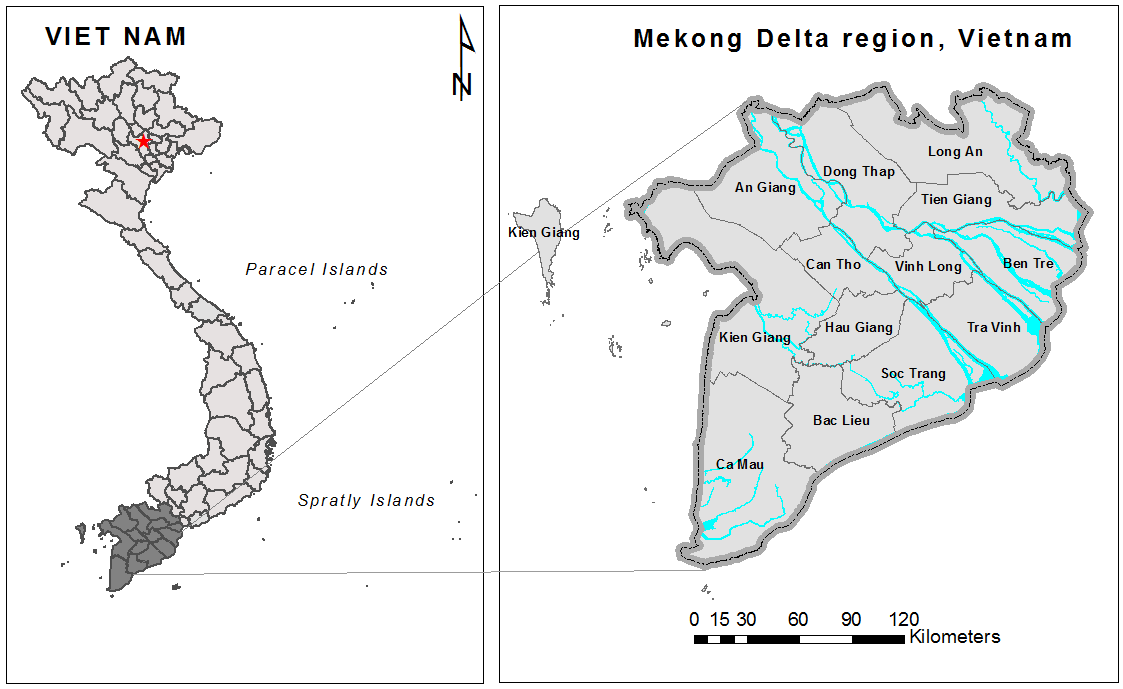
The study was conducted in the lower MRD in southern Viet Nam, the area most affected by dengue fever, with up to 65% of cases recorded during 1998-2015. Moreover, dengue fever has been reported as the second most frequent cause of hospital admissions among communicable diseases in this region (Phung, Talukder, Rutherford, & Chu, 2016). The MRD is a flat and low-lying area with a very complex network of rivers, channels and floodplains, supporting agriculture fields (Figure 1). The climate is tropical monsoon with a wet season from May to October and a dry season from November to April, and the average air temperature in the coldest months is approximately 18-20°C.
2.2 Mapping method – WADI application
This study applies the WADI conceptual framework developed by Dickin, Schuster-Wallace and Elliott (2013), which is described in Figure 2. In this framework, the vulnerability index is composed of only the exposure and susceptibility indicators, where the exposure describes conditions that are conducive to the survival and transmission of dengue in the environment. Susceptibility describes the existing sensitivity of a population to dengue. The susceptibility indicator also includes conditions that impact resilience, a concept described as the capacity to prevent, respond to and cope with disease.
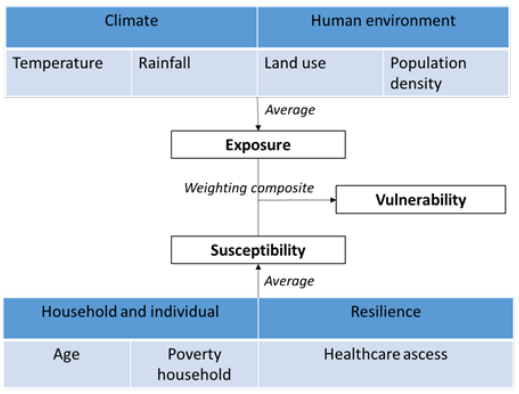
We use two components of climate and human environment for the exposure indicator, while the susceptibility indicator comprises components indicating age, poverty, and healthcare access. The climate factor includes the two important variables of temperature and rainfall, and human environment consists of land cover and population density. Exposure and susceptibility scores were scaled between 0 and 1, representing a range from low to high exposure or susceptibility and were based on the proposed threshold of Dickin, Schuster-Wallace and Elliott (2013), with modification by Cheong, Leitão and Lakes (2014) for land use.
Dickin, Schuster-Wallace and Elliott (2013) proposed 5 components, including population age, housing quality, water and sanitation, health care access, and female education level. Based on the availability of collected data, we were able to use 3 of these factors, as listed in Table 1. Louis et al. (2014) reviewed the 26 published papers on mapping dengue risk and found that age and income are two of the most commonly used factors for predicting dengue risk.
| Component | Data sources | Threshold |
| Age under 15 years | The General Statistics Office of Viet Nam (2009 census dataset) | % population under 15 years by province |
| Health care access | Actual data from the General Statistics Office of Viet Nam | Density health facilities per square km area |
| Poverty | Annual data from the General Statistics Office of Viet Nam | % poverty household per province |
Table 1. Summary of the susceptibility components used for calculation
2.3 Remote sensing data
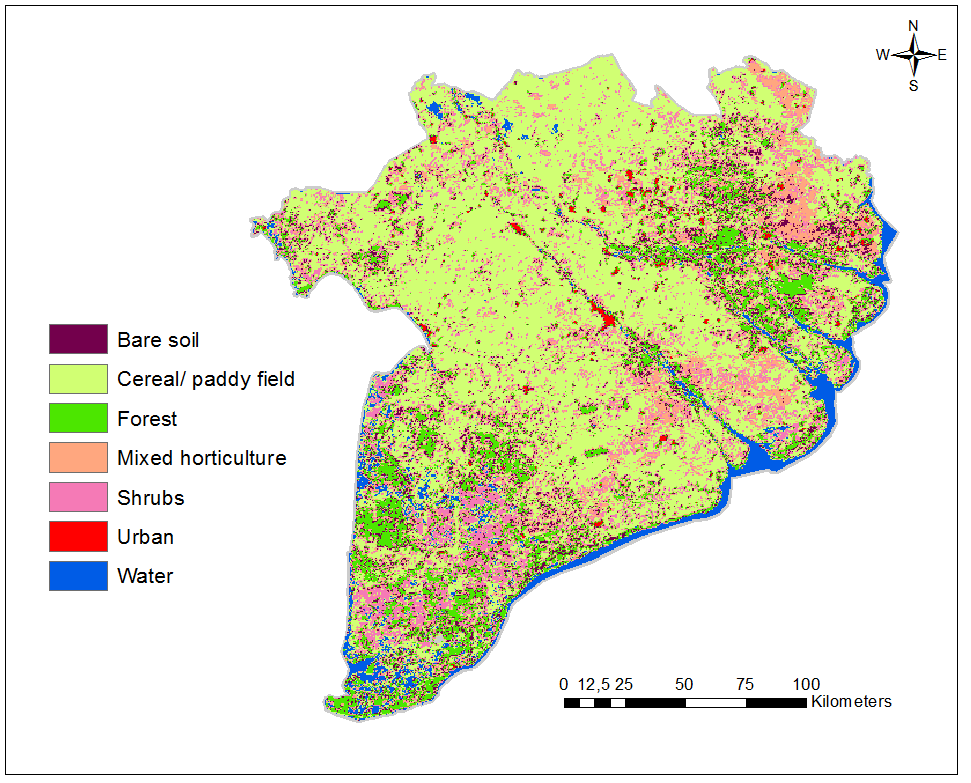
In this study, land cover data were extracted from a satellite-based secondary product, MODIS Land Cover Type yearly L3 global (MCD12Q1) product (Friedl et al., 2010; Friedl & Sulla-Menashe, 2015), and mapped with areas of standard Land Use Map of year 2010, with the scale of 1:100.000, provided by the Ministry of Natural Resources & Environment (MONRE), as in Figure 3.
In an attempt to extensively use remote sensing data, with the advantages of spatial coverage with high resolution and temporal availability, we used GSMaP data as an alternative for surface rainfall measurement. The daily GSMaP/MVK (version 6) data with a spatial resolution of 0.1 x 0.1 degrees (Ushio et al., 2009), were extracted for the MRD and accumulated to calculate the monthly amount. We used monthly Land Surface Temperature data from MODIS LST (MOD11A2) with a 1 km x 1 km resolution (Wan, 2007) as a proxy for air temperature.
3. Results and Discussion
3.1 The vulnerability maps
Monthly maps of overall vulnerability were produced by combining raster layers of susceptibility and exposure indicators. The selection of weighting schemes for each indicator to the total vulnerability index was based on an approach in which different weightings were tested to find the best correlation coefficient of the WADI index with monthly dengue rates from 2002 to 2014 for each province. In fact, the vulnerability is more sensitive to exposure than the susceptibility indicator because the climate components clearly show monthly variations, while the others change at a yearly scale. Based on correlation results, we decided to use weightings of 1 for the susceptibility and 3 for the exposure indicator, so that the final vulnerability index was weighted more heavily on the exposure indicator. In addition, monthly data for temperature and rainfall were used in a time-lagged manner based on their best correlation with monthly dengue incidences for each province. This approach is similar to the approach used by Vu, Okumura, Hashizume, Tran and Yamamoto (2014), where weather components strongly affected dengue transmission at a lag time of 0 to 3 months, with considerable variation in their influence among different areas in Viet Nam due to the delay between the onset of weather conditions and the impact on mosquito populations. Yearly vulnerability maps were produced by averaging monthly maps and aggregated to maps by district and provincial administrative boundaries by using GIS software as shown in Figure 4 (a & b).
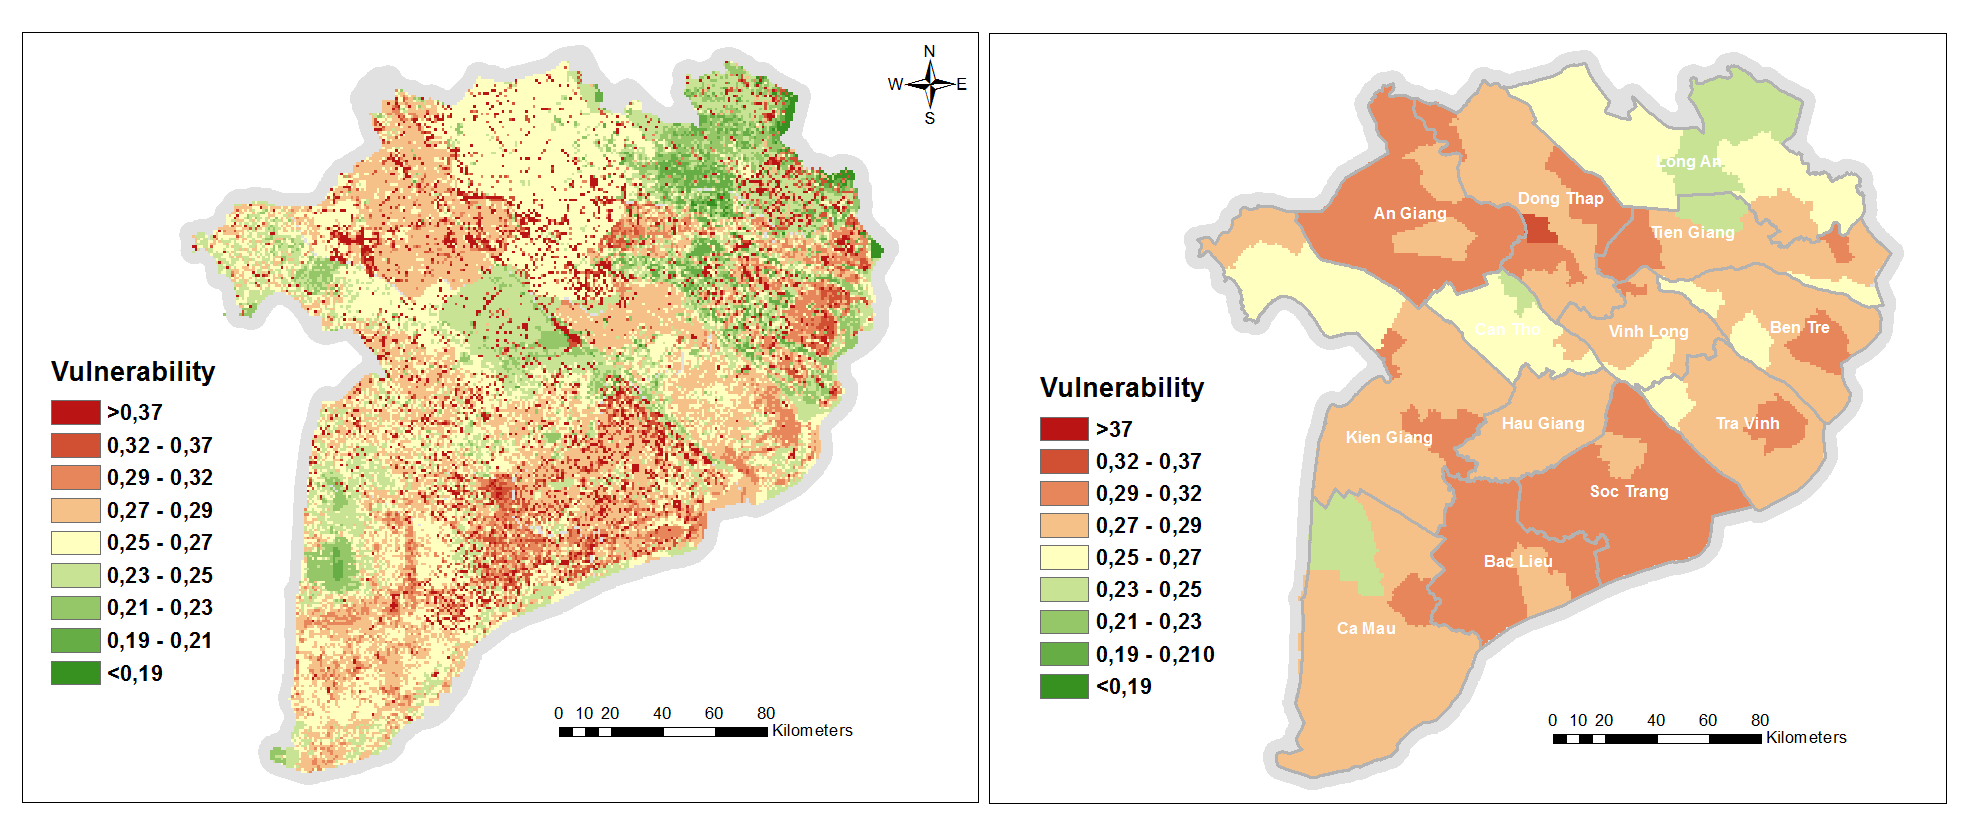
The results suggest that vulnerability to dengue over the Mekong Delta region of Viet Nam varies greatly across spatial and temporal dimensions. The highest vulnerability is clearly observed in the scattered areas of urban and mixed horticulture land use while the lowest vulnerability is observed in the remote and sparse populations covered by forest and bare soil land types. Overall, this finding agrees well with the weighting of land use for calculating the exposure indicator (Table 1). We found that aggregated vulnerability concentrated higher in the provinces of An Giang, Dong Thap, Tien Giang, Ben Tre, and Soc Trang, corresponding to a high-risk cluster of dengue in the Mekong Delta area (Phung, Talukder, Rutherford, & Chu, 2016).

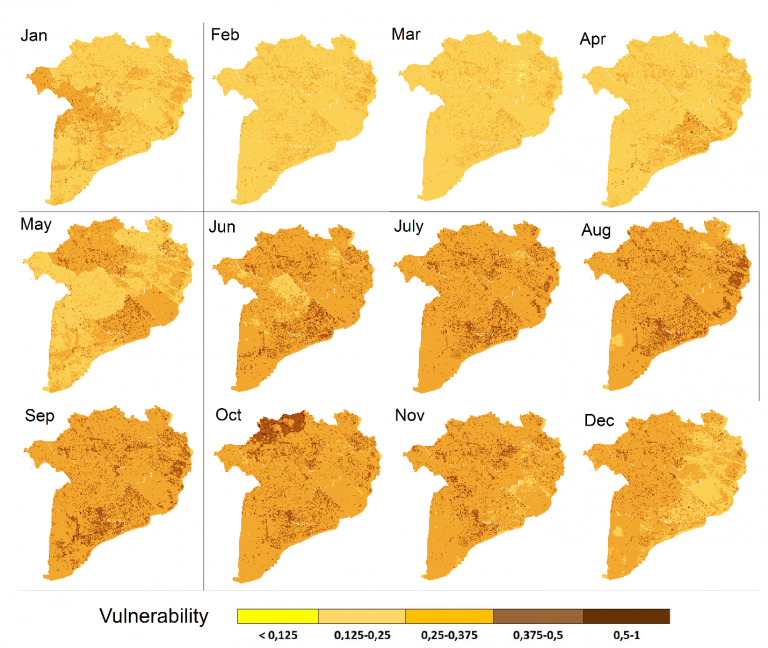
At a temporal scale, the monthly average data in Figure 5 clearly shows the seasonal variation of vulnerability with the lowest values in February-March, increasing towards the highest values in August-November. Obviously, this seasonal cycle is mainly affected by the seasonal variation in climate in this region, as other factors remained unchanged throughout the year. Generally, increased temperature and rainfall are associated with increased dengue transmission (Johansson, Dominici, & Glass, 2009); therefore, higher vulnerability is related to the rainy season during May-November. This trend was widely reported in many regions in Southeast Asia in tropical environments (Wai et al., 2012). This seasonal cycle also varies at a spatial scale, shown in Figure 5, which shows that higher vulnerability occurred in Bac Lieu, Soc Trang, and Ben Tre provinces in September, while it occurred in An Giang and Dong Thap provinces in October. Apparently, exposure to dengue heavily varies throughout the year, depending on the changes in climate conditions over the region.
3.2 Assessing the correlation of vulnerability with dengue incidence
We evaluate an association between monthly vulnerability indicators and dengue incidence by calculating Pearson’s correlation for both the training data period of 2001-2014 and the last two years of 2015-2016 data. To avoid variance in dengue counts, the data was stabilized by log transformation to the same scale as vulnerability score. The regressions of vulnerability and dengue for the 2001-2014 training data are presented in Figure 6 for provinces with highly correlated cases. Again, we found that better regressions were associated with provinces with a high dengue rate.
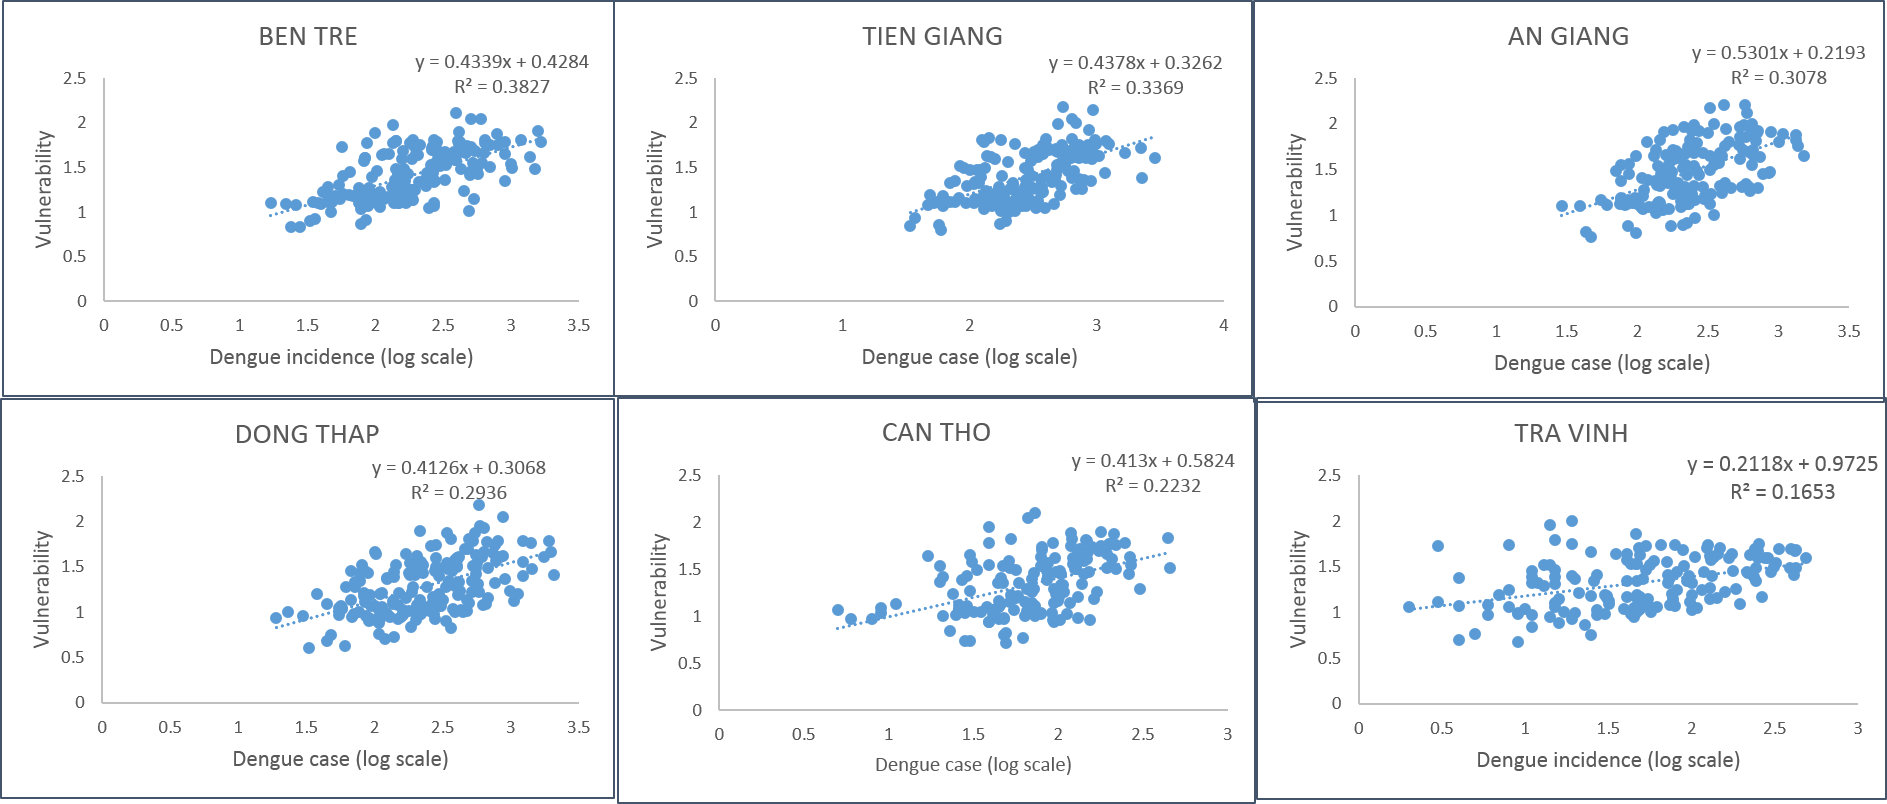
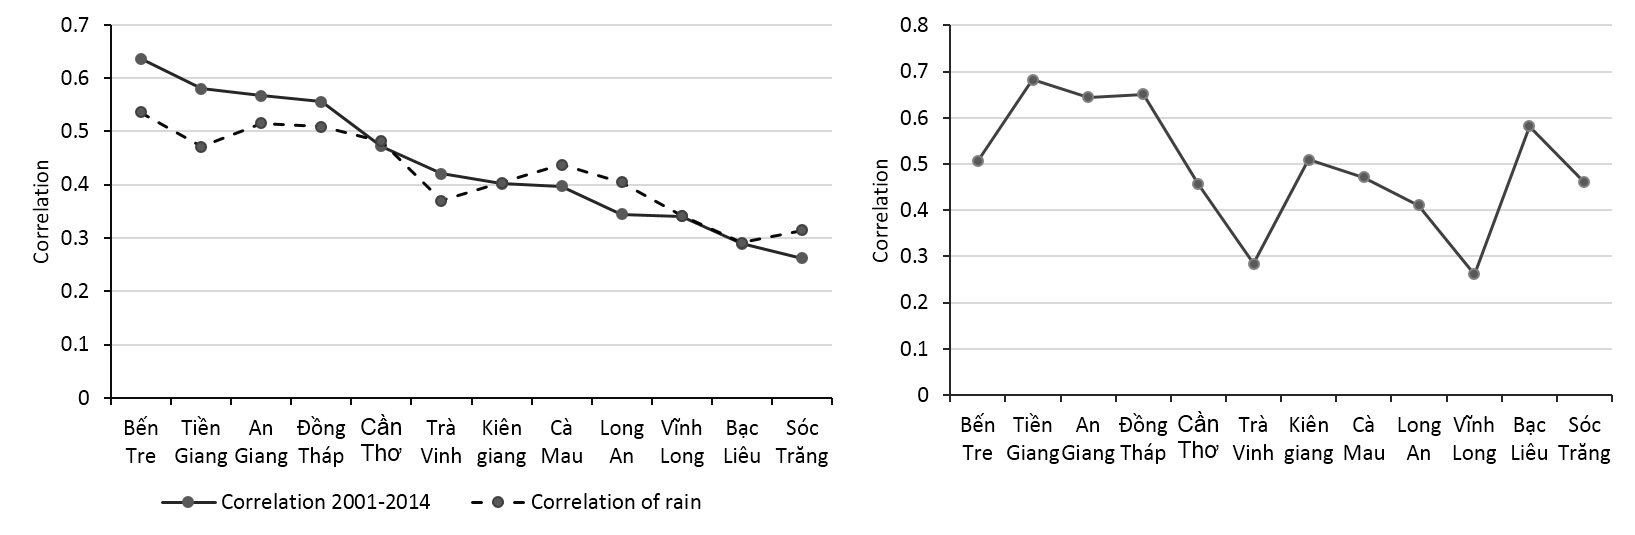
The correlation varies significantly from 0.26 to 0.63 (with p<0.05) for different provinces, and a high correlation was only found in provinces with a high dengue rate. The most seasonal factor in this region that contributes to the exposure of vulnerability is rainfall; therefore, we also evaluated the association between monthly rainfall amount and dengue incidence for each province with Pearson’s correlation. We compared two correlations, as in Figure 7a, which show a similar trend in their variations: the higher correlation of dengue with rain and the better correlation of dengue with estimated vulnerability. This finding indicates that seasonal trends in exposure are highly sensitive to climate variables, as mentioned in the review of climate change and dengue with the modelling approach by Naish et al. (2014). Validation result for the 2015-2016 years of data also presented correlation above 0.5 in provinces of high-risk cluster of dengue towards the north-eastern part of the region (Figure 7b).
3.3 Discussion
With the extensive use of satellite remote sensing data for eco-environmental factors of rainfall, temperature, and land use, we have limited the inconsistency of data sources over the whole region for index calculating. As mentioned before, the vulnerability was weighted more heavily on the exposure indicator; therefore, changes in exposure resulted in greater changes in vulnerability. Because all index approaches are restrained by the weighting selection (Dickin & Schuster-Wallace, 2014), different weighting schemes were tested in this study, and the weight was assigned based on the best correlation of dengue incidence and vulnerability for the training data (2001-2014). Nevertheless, the result of validation showed the different performance of the WADI over the region; a high correlation of vulnerability with dengue incidence was found in provinces with high dengue risk. We anticipate a better correlation of dengue incidence with rain as one possible reason. However, as mentioned by Fekete (2009) dengue vulnerability includes conditions of exposure and susceptibility that can occur without virus transmission. Therefore, the high potential transmission areas or habitat are generally the areas with the densest human and vector population (Hasnan, Dom, Latif, & Madzlan, 2017).
The vulnerability maps could be constructed in raster grids with a high spatial resolution of environment variables but still be limited in social variables at the provincial and district scale levels. These data had been rasterized into grids comparable to environment variables for the input to WADI calculation. However, the availability of dengue cases at the provincial level limits the validation to that level, providing results in vulnerability relating to large-scale patterns but not processes occurring at smaller scales. Undoubtedly, a combination of socio-environmental factors affects the transmission of dengue disease at different scales: larger scale factors, such as climate, are responsible for the influence of dengue transmission over the region, while local factors relate to community activities to prevent human infection (Thai et al., 2010). Dickin & Schuster-Wallace (2014) considered that a stronger weighting for exposure is attributable to larger scale factors, while susceptibility plays a role at the local level. Therefore, detailed data on social information and dengue reports at community levels are important for studying the combined effects of exposure and susceptibility at regional and local levels.
4. Conclusion
This study focused on presenting socio-environmental influences and climate factors on the vulnerability to dengue fever in the MRD, which has the highest dengue rate in Viet Nam. This research is the first application of the WADI approach to dengue in Viet Nam to enhance the understanding of dengue burden by exposure and susceptibility components rather than the mathematical modelling of epidemic transmission used in previous studies. Monthly and yearly maps of vulnerability to dengue in the MDR were produced by using extensive remote sensing data for climate and environment variables at high spatial resolution. The results showed that provinces along the Mekong River with higher population density are more vulnerable to dengue. There is a clear seasonal variation in the vulnerability over the whole region following variability of the climate factor, such that there is the lower vulnerability during the dry season from January to May and higher vulnerability during the rainy season from June to December. The correlation between the estimated vulnerability with dengue incidence significantly varies among MRD provinces, depending on their local condition of climate variables and land cover as well as population distribution. The validation results revealed that the WADI performed better in provinces with a high-risk cluster of dengue, where dengue has a greater correlation with rain.
The remote sensing data provides detailed information on climate and environment variables for vulnerability mapping that are advantageous over standard surface observation. However, the challenge of existing approaches in mapping dengue risk is to improve the accuracy in describing the spatially localized dengue distribution influenced by human activities. In addition, the validation of the mapping was limited to the provincial level due to the lack of dengue data at the community level in this study. Influences of combined exposure and susceptibility at regional and local scales is subject for further research in other regions of Viet Nam. Finally, all monthly and yearly vulnerability maps, as the outcome of this study, can be accessed at the GIS-based website http://www.apn-climateandhealth.com.
Acknowledgement
This study is funded by the Asia-Pacific Network for Global Change Research (APN) – CAF2016-RR11-CMY-Pham. We greatly thank the reviewers for their useful comments, which significantly helped to improve the manuscript.
References
- Cheong, Y. L., Leitão, P. J., & Lakes, T. (2014). Assessment of land use factors associated with dengue cases in Malaysia using Boosted Regression Trees. Spatial and spatio-temporal epidemiology, 10, 75-84.
- Dickin, S. K., & Schuster-Wallace, C. J. (2014). Assessing changing vulnerability to dengue in northeastern Brazil using a water-associated disease index approach. Global Environmental Change, 29, 155-164.
- Dickin, S. K., Schuster-Wallace, C. J., & Elliott, S. J. (2013). Developing a vulnerability mapping methodology: applying the water-associated disease index to dengue in Malaysia. PLoS One, 8(5), e63584.
- Dom, N. C., Ahmad, A. H., Latif, Z. A., & Ismail, R. (2017). Integration of GIS-based model with epidemiological data as a tool for dengue surveillance. EnvironmentAsia, 10(2), 135-146.
- Dom, N. C., Ahmad, A. H., Latif, Z. A., Ismail, R., & Pradhan, B. (2013a). Coupling of remote sensing data and environmental-related parameters for dengue transmission risk assessment in Subang Jaya, Malaysia. Geocarto International, 28(3), 258-272.
- Dom, N. C., Hassan, A. A., Latif, Z. A., & Ismail, R. (2013b). Generating temporal model using climate variables for the prediction of dengue cases in Subang Jaya, Malaysia. Asian Pacific Journal of Tropical Disease, 3(5), 352-361.
- Dom, N. C., Ahmad, A. H., Latif, Z. A., & Ismail, R. (2013c). Measurement of dengue epidemic spreading pattern using density analysis method: Retrospective spatial statistical study of dengue in subang jaya, Malaysia, 2006-2010. Transactions of the Royal Society of Tropical Medicine and Hygiene, 107(11), 715-722
- Fekete, A. (2009). Validation of a social vulnerability index in context to river-floods in Germany. Natural Hazards and Earth System Sciences, 9(2), 393-403.
- Friedl, M. A., Sulla-Menashe, D., Tan, B., Schneider, A., Ramankutty, N., Sibley, A., & Huang, X. (2010). MODIS Collection 5 global land cover: Algorithm refinements and characterization of new datasets. Remote Sensing of Environment, 114(1), 168-182.
- Friedl, M., Sulla-Menashe, D. (2015). MCD12Q1 MODIS/Terra+Aqua Land Cover Type Yearly L3 Global 500m SIN Grid V006 [Data set]. NASA EOSDIS Land Processes DAAC. doi: 10.5067/MODIS/MCD12Q1.006
- Hasnan, A., S. N., Dom, N. C., Latif, Z. A., & Madzlan, F. (2017). Surveillance of Aedes mosquitoes in different residential types in central zone of Shah Alam, Selangor. Asian Pacific Journal of Tropical Disease, 7(6), 332-340.
- Johansson, M. A., Dominici, F., & Glass, G. E. (2009). Local and global effects of climate on dengue transmission in Puerto Rico. PLoS Negl Trop Dis, 3(2), e382.
- Khormi, H. M., & Kumar, L. (2011). Examples of using spatial information technologies for mapping and modelling mosquito-borne diseases based on environmental, climatic and socio-economic factors and different spatial statistics, temporal risk indices and spatial analysis: A review. J Food Agr Environ, 9, 41-49.
- Kovats, R., Ebi, K., Menne, B., Campbell-Lendrum, D., Canziani, O., Githeko, A., . . . McMichael, A. (2003). Methods of assessing human health vulnerability and public health adaptation to climate change: WHOHealth CanadaUNEPWMO.
- Louis, V. R., Phalkey, R., Horstick, O., Ratanawong, P., Wilder-Smith, A., Tozan, Y., & Dambach, P. (2014). Modeling tools for dengue risk mapping-a systematic review. International journal of health geographics, 13(1), 50.
- Naish, S., Dale, P., Mackenzie, J. S., McBride, J., Mengersen, K., & Tong, S. (2014). Climate change and dengue: a critical and systematic review of quantitative modelling approaches. BMC Infect Dis, 14(1), 167.
- Patz, J., Campbell-Lendrum, D., Holloway, T., & A Foley, J. (2005). Impact of Regional Climate Change on Human Health. Nature 438: 310-317 (17 November) (Vol. 438).
- Patz, J. A., & Balbus, J. M. (1996). Methods for assessing public health vulnerability to global climate change. Climate Research, 113-125.
- Phung, D., Talukder, M. R. R., Rutherford, S., & Chu, C. (2016). A climate-based prediction model in the high-risk clusters of the Mekong Delta region, Vietnam: towards improving dengue prevention and control. Tropical Medicine & International Health, 21(10), 1324-1333.
- Promprou, S., Jaroensutasinee, M., & Jaroensutasinee, K. (2005). Climatic Factors Affecting Dengue Haemorrhagic Fever Incidence in Southern Thailand.
- Sia Su, G. L. (2008). Correlation of climatic factors and dengue incidence in Metro Manila, Philippines. AMBIO: A Journal of the Human Environment, 37(4), 292-294.
- Thai, K. T., Cazelles, B., Van Nguyen, N., Vo, L. T., Boni, M. F., Farrar, J., . . . de Vries, P. J. (2010). Dengue dynamics in Binh Thuan province, southern Vietnam: periodicity, synchronicity and climate variability. PLoS Negl Trop Dis, 4(7), e747.
- Ushio, T., Sasashige, K., Kubota, T., Shige, S., Okamoto, K. i., Aonashi, K., . . . Kachi, M. (2009). A Kalman filter approach to the Global Satellite Mapping of Precipitation (GSMaP) from combined passive microwave and infrared radiometric data. Journal of the Meteorological Society of Japan. Ser. II, 87, 137-151.
- Vu, H. H., Okumura, J., Hashizume, M., Tran, D. N., & Yamamoto, T. (2014). Regional differences in the growing incidence of dengue fever in Vietnam explained by weather variability. Trop Med Health, 42(1), 25-33.
- Wai, K. T., Arunachalam, N., Tana, S., Espino, F., Kittayapong, P., Abeyewickreme, W., . . . Koyadun, S. (2012). Estimating dengue vector abundance in the wet and dry season: implications for targeted vector control in urban and peri-urban Asia. Pathog Glob Health, 106(8), 436-445.
- Wan, Z. (2007). Collection-5 MODIS land surface temperature products users’ guide. ICESS, University of California, Santa Barbara.