
Mapping groundwater resilience to climate change and human development in Asian cities
Keywords
Asian cities · Climate change · Groundwater resiliency · Human development
HIGHLIGHTS
- We estimated groundwater resiliency to climate change and human development in four Asian cities.
- Modelling method assessed climate change and human development influence on groundwater.
- All four Asian cities will be warmer in future, which is in line with the global temperature trend.
- Groundwater resources in the outskirt part of cities will be resilient to climate change and human development.
- Groundwater in the central part of all four cities will not be resilient to climate change and human development.
1. INTRODUCTION
Groundwater makes up 94% of the world’s freshwater supplies and is portrayed as the true hidden wealth of the planet (Koundouri & Groom, 2010). The most ideal resource of water supply is groundwater since it is less susceptible to drought and quality deterioration than surface water (Schwartz & Ibaraki, 2011). Groundwater is one of the main drinking water sources for around 2 billion people residing in rural and urban areas (Kemper, 2004; Foster, 2022). It accounts for 32% of the drinking water supply (Morris et al., 2003). Major Asian cities rely entirely or partially on groundwater for their daily water supply, and groundwater plays a very vital role in the sustainable development of the major Asian cities. For instance, groundwater dependency in Bangkok and its vicinity, Thailand, is nearly 30%; in Ho Chi Minh City, Vietnam is 45%; in Lahore, Pakistan, is 100% and in Kathmandu Valley, Nepal, is 50% (Basharat, 2015; Gautam & Prajapati, 2014; Khatiwada, Takizawa, Nga, & Inoue, 2002; Lorphensri, Nettasana, & Ladawadee, 2016; Shrestha, Neupane, Mohanasundaram, & Pandey, 2020; Vuong, Long, & Nam, 2016). Future climate change and human development (population growth and rapid urbanisation) are projected to have a greater impact on groundwater availability for the city’s water supply (Ghimire, Shrestha, Neupane, Mohanasundaram, & Lorphensri, 2021). The risks posed by intense climate change events are observed to be enormous, even with a 1°C increase in maximum temperature. In several tropical and subtropical regions, water availability is projected to change (IPCC, 2022). Under these conditions, the hydrological cycle experiences erratic changes in precipitation and evaporation, which will have a serious impact on surface and groundwater resources. Therefore, evaluating the groundwater’s resilience to climate change and anthropogenic growth is crucial to strategically plan and manage the city’s water supplies.
Mapping groundwater resiliency, as defined by National Groundwater Association [NGWA] (2016) is the capability of the groundwater system to endure either long-term shocks (e.g., climate change) or short-term shocks (e.g., drought) can be a useful tool for comprehending the groundwater system, which will ultimately help with groundwater resource management. The ability of an ecosystem to tolerate long-term harm and recover swiftly from disruptions is referred to as resilience (Gunderson, 2000). In the context of climate change, the ability of a system to absorb disturbances while preserving its essential structure and ways of functioning, as well as its capability to adjust to stress and change, is widely explored (IPCC, 2007). Peters, van Lanen, Torfs, and Bier (2004) defined resilience as “how quickly a system is likely to recover once a failure has occurred, while vulnerability is the severity of the failure”. Sharma and Sharma (2006) defined groundwater resilience as the “ability of a system to maintain groundwater reserves despite major disturbances”.
Climate change and human growth significantly impact water resources and the environment, which also results in changes to the hydrological cycle, the surface energy budget, and water yield (Wada, 2016). According to Mirchi, Madani, Roos, and Watkins (2013), the main factor affecting water availability is climate change, and the significant increase in the global population has raised water demand globally. This has further pressured the water supply (Gain & Giupponi, 2015). In many places, groundwater is the main water supply, disappearing at an alarming rate (Li, Rodell, & Famiglietti, 2015). For better water management, measuring how human growth and climate change have affected groundwater supplies is crucial. Further, the impacts of climate change and variabilities have risen as challenging issues to the present generation, which are likely to worsen in the future due to anthropogenic interventions with nature (Guptha, Swain, Al-Ansari, Taloor, & Dayal, 2021, 2022; Swain, Mishra, Pandey, & Dayal, 2022a; Swain, Mishra, Pandey, & Kalura, 2022b).
Despite the importance of groundwater for the sustainable development of major Asian cities, there has not been as much study done on it as on surface water resources in scenarios involving human development and climate change. This is also true for Asian cities like Bangkok and its vicinity, Ho Chi Minh City, Lahore, and Kathmandu Valley. Therefore, there is an urgent need to research how human growth and climate change affect the groundwater system in Asian cities to evaluate the existing situation and foresee potential future developments. Mapping groundwater resources to climate change and anthropogenic growth in Asian cities can be an effective tool for analysing areas where preventive actions are required and comprehending groundwater system behaviours, which eventually aids in managing and conserving groundwater resources and developing strategies for sustainable use.
The research aims to analyse the groundwater system’s resilience to climate change and anthropogenic growth and design the adaptation solutions to minimise the vulnerability of groundwater resources in Asian cities, namely Bangkok and its vicinity, Thailand, Ho Chi Minh City, Vietnam, Lahore, Pakistan, and Kathmandu Valley, Nepal.
1.1. Objectives
The study’s overarching goal is to analyse the resilience of groundwater systems in Asian cities to climate change and anthropogenic development.
The specific objectives are:
- To evaluate regional climate models (RCMs) for projections of future climate change in Asian cities.
- To forecast future land usage and land cover in Asian cities and examine possible future climatic scenarios.
- To assess the spatiotemporal distribution of groundwater recharge in Asian cities under several climatic change scenarios and anthropogenic development.
- To estimate the aquifers’ groundwater levels in Asian cities under various scenarios of climatic change and anthropogenic development.
- To develop groundwater resiliency indicators that consider climate change and human growth scenarios and analyse groundwater resiliency in Asian cities.
2. METHODOLOGY
2.1. Study area
The study area includes four rapidly expanding Asian cities: Bangkok and its vicinity, Ho Chi Minh City, Lahore, and Kathmandu Valley (Figure 1). The four Asian cities were selected based on their groundwater dependence which ranges from 30–100%.
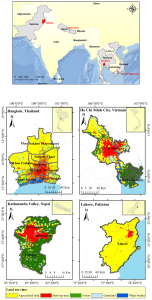
Bangkok and its environs comprise seven provinces in Thailand: Bangkok, Samut Prakan, Samut Sakhon, Nakhon Pathom, Nonthaburi, Pathum Thani, and Phra Nakhon Si Ayutthaya. Bangkok is in the humid tropics and has a tropical wet-and-dry climate throughout the year. The average temperature is 30°C, and the annual rainfall is 1500 mm. The water supply for the city’s demand comes from both surface and groundwater sources. Groundwater is mostly used in the water supply systems near Bangkok. In the study area, 11.3 million (in 2015) people are living at a density of 300 to 3,600 people/km2. Eight confined aquifers exist in Bangkok and its environs, with Phra Pradaeng, Nakhon Luang, and Nonthaburi being the most exploited because of their higher production, accessibility, and excellent water quality. In the mid-1950s, the extensive use of groundwater was started, and there was a continuous increase in groundwater use until 1997. Land subsidence (1.0 cm/yr between 2006 and 2012), groundwater level depletion and recovery, and groundwater quality deterioration are the main groundwater-related problems.
Ho Chi Minh City (HCMC), the biggest city in Vietnam, is located 1760 kilometres south of Hanoi. HCMC had a population of around 7.35 million (in 2015) and a total area of 2095 km2, making up roughly 8.79% of its total populace and 0.6% of Vietnam’s total land. The average humidity is 75%, and the average temperature is 27°C. The climate is classified as tropical, more precisely tropical wet and dry. The total annual rainfall is 1946 mm, 1130 mm, lost due to evaporation. Both the surface and groundwater resources are used to deliver water. The fast growth in groundwater abstraction began in 1990 when Vietnam’s economic policies were implemented. It is planned that groundwater’s portion of the overall water supply, which was 44.7% in 2012, will be reduced to 15.5% in 2015 and 2.7% in 2020. Major groundwater-related problems include a decline in groundwater level (rate: 0.5–1.0 m/yr), saltwater intrusion in some areas, groundwater quality degradation (NO3 content is four times the permissible value; iron content is 100 times the permissible value), and land subsidence of a few centimetres per year in heavily pumped areas.
Kathmandu, Nepal’s capital and largest metropolitan city, is in central Nepal and has a total area of 656 km2. The Kathmandu Valley’s population is 2.8 million (in 2015) and the population density is 29 persons per km2, which includes both the urban and rural areas of Kathmandu Valley. Kathmandu Valley is in the mild temperate zone, with an elevation range of 1205–2713 masl and a significant contrast in typical summer (28–30°C) and winter (10°C) temperatures. On average, it receives 1455 mm of rain annually, 65% of which falls from June to August. Kathmandu Valley has a closed reservoir system with a gentle slope towards the Valley’s centre. The groundwater flow is assumed to be slow, particularly in the deeper aquifer. The water supply system is hugely dependent upon monsoon rain, the stream, and the rainfed recharge system, as 25–30% of the water demand is mitigated through groundwater abstraction. Due to an unfavourable geological characteristic of the Valley, surface runoff is high in volume during the monsoon period. The natural recharge in the swallow aquifers during the high monsoon periods occurs along the basin margin, although the presence of the clay bed significantly restricts natural recharge in deep aquifers.
With a total area of 1772 km2, Lahore is one of the largest metropolitan regions in South Asia. The population was 10.37 M in 2015, and a population density of 14,000 persons per km2. Lahore has a subtropical semi arid climate, with an average annual rainfall of 712 mm for the 30 years from 1971 to 2000. The majority of the yearly rainfall (roughly 75%) falls between June and September, recharging the groundwater by around 40 mm on average each year. The average yearly temperature is roughly 24.3°C, with monthly variations between 33.9°C (in June) and 12.8°C (in January). The only source of water in the city is groundwater. The Water and Sanitation Agencies (WASA) tube well infrastructure is used by about 89% of Lahore’s entire land area. These tube wells, which have various capacities and are situated between 150 and 200 m deep, continuously pump 800 cubic feet of water per second (cusecs). Water levels between 2003 and 2011 are falling at a rate of 0.57 m/yr to 1.35 m/yr due to excessive groundwater consumption, and well productivity is also declining.
2.2. Methods and data
The overall methodological framework required to accomplish the stated objectives is shown in Figure 2.
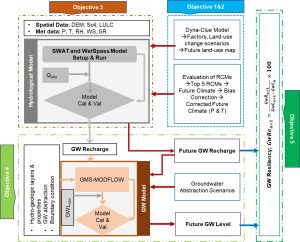
“DEM is a digital elevation model; LULC is land use/cover; P is precipitation; T is Temperature; RH is Relative Humidity; WS is Wind Speed; SR is Solar Radiation; Qobs is Observed River Discharge; Cal is Calibration; Val is Validation; GWLobs is Observed Groundwater Level; GW is Groundwater; RCM is a Regional Climate Model; GwRe is the groundwater resiliency; GwR is groundwater recharge; GwL is groundwater level; and n is the base year”
The key objective of the study is to assess groundwater resiliency in four Asian cities; Bangkok and its vicinity, Ho Chi Minh City, Lahore, and Kathmandu Valley under climate change and human development scenarios Firstly, the evaluation of Regional Climate Models (RCMs) in each city was done based on their ability to replicate the observed climate datasets. The top 5 best-performing RCMs, along with two Representative Concentration Pathway (RCP) scenarios (RCP 4.5 and RCP 8.5), were then used to project the future climate of the study area. From the time perspective, the RCP scenarios differ in radiative forcing and greenhouse gas intensity. The main objective of the RCP scenarios is to identify future uncertainties without forecasting them, with different socioeconomic hypotheses used in their development (Moss et al., 2010; Rogelj, Meinshausen, & Knutti, 2012). RCP 4.5 is described by the Intergovernmental Panel on Climate Change (IPCC) as a moderate emission scenario in which emission peaks around 2040 and then declines. RCP 8.5 is the highest baseline emission scenario in which emission continues to rise throughout the 21st century. RCP 8.5 gives a much more rapid warming and more pronounced change in important indicators such as river flow, temperature, and precipitation. On the other hand, the RCP 2.6 scenario will result in the least amount of global warming and only limited climate change and the difference between RCP 2.6 and 4.5 will remain relatively small until the end of the century. Therefore, in this study, two scenarios: RCP 4.5 and RCP 8.5 are used. A quantile mapping technique was used to remove the bias from the climate data sets. The land use change model Dyna-CLUE was used to project the future land use change of the study area. The baseline climatic data, future projections from climate models, and land use change scenarios conceived by Dyna-CLUE were fed into the hydrological model SWAT and WetSpass to forecast future groundwater recharge. The hydrological modelling of Bangkok and its vicinity was done using the WetSpass model, whereas, for three other Asian cities, the SWAT model was used. The WetSpass model was chosen in Bangkok since it was challenging to include the city within a hydrological watershed. The future groundwater abstraction computed using population and water demand forecasting and future groundwater recharge was then input into calibrated steady-state groundwater model GMS-MODFLOW to obtain future groundwater level. Finally, based on the findings, a groundwater resilience indicator was created, which was then utilised to create a groundwater resilience map for the research region.
The data used for the study include the time series observations (rainfall, wind speed, maximum and minimum temperature, solar radiation, river discharge, relative humidity, groundwater level and groundwater abstraction), physical characteristics of catchments (DEM, soil map, land use map, slope, aspect ratio, distance from road, distance from river, population density), hydrogeologic properties of aquifers (specific storage (Ss), hydraulic conductivity (Kx, Ky), specific yield (Sy)) and future climate projection from climate models (adopted from Neupane, Shrestha, Ghimire, Mohanasundaram, & Ninsawat, 2021).
2.3. Land use change scenarios
Three land use change scenarios, namely: high urbanisation (HU), medium urbanisation (MU) and low urbanisation (LU) scenarios, were considered for all four Asian cities to project the future land use map. In high urbanisation scenarios, there will be a significant increase in built-up land or urban areas. In medium urbanisation scenarios, there will be a medium increment in a built-up area and low urbanisation scenarios, forest conservation is given priority and there will be no change in built-up land. A detailed description of the future land use scenario is presented in Supplementary Table 1.
2.4. Groundwater abstraction scenarios
To calculate future groundwater abstraction, three scenarios (like land use change scenarios) were analysed for all four Asian cities. The groundwater abstraction scenarios for Bangkok and its vicinity, Ho Chi Minh City and Lahore are mentioned below:
- High Urbanisation: Groundwater abstraction will be increased in future by 10%, 20%, 30% and 40% in 2035, 2055, 2075 and 2095, respectively (we assume that there will be very high increase in the built-up areas due to rapid population growth and hence the abstraction will increase in future).
- Medium Urbanisation: Groundwater abstraction will be decreased in future by 10%, 20%, 30% and 40% in 2035, 2055, 2075 and 2095, respectively (we assume that there will be very small increment in urban land and small reduction in agricultural land, and there will be some policies intervention to prevent groundwater abstraction or transboundary water diversion from different river basin).
- Low Urbanisation (safe-yield pumping): Groundwater abstraction will be decreased in future by 15%, 30%, 45% and 60% in 2035, 2055, 2075 and 2095, respectively (we assume that there will be no change in the area occupied by built up land or urban land and agricultural land. This suggests that the area occupied by forest will be increased, therefore in low urbanisation groundwater abstraction will be decreased in future).
Likewise, the groundwater abstraction scenarios for Kathmandu Valley are mentioned below:
- High Urbanisation: Groundwater abstraction meets 40% of overall water demand (is the pessimistic scenario where the groundwater abstraction further increases in future).
- Medium Urbanisation: Groundwater abstraction meets 20% of overall water demand (is the business as-usual scenario).
- Low Urbanisation (optimistic): Groundwater abstraction meets 10% of overall water demand (is the optimistic scenario which designates the reduction in groundwater abstraction for the implementation of policies to prevent groundwater abstraction or transboundary water diversion from different river basins).
The reason behind two different scenarios between Kathmandu and other three Asian cities is because of very less groundwater abstraction in Kathmandu as compared to other three Asian cities. And if we adopt similar methodology as of three Asian cities, there will not be much change in groundwater abstraction volume for Kathmandu.
2.5. Groundwater resiliency indicators
Based on the existing resilience document and definition (as discussed in literature review section) following methods have been suggested for the resilience indicators and resilient index calculation of a groundwater system.
2.5.1. Resilience based on groundwater level data and recharge
Groundwater resilience to climate change and human development is the percentage recuperation to total groundwater depletion at a distinct period and can be expressed as follows:
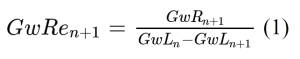
“Where n denotes the base year, GwRe denotes groundwater resilience, GwR denotes groundwater recharge, and GwL denotes groundwater level.”
Groundwater resilience (GwRe) was further classified into 5 categories to create a groundwater resiliency map of four Asian cities (Table 1). The greater the proportion of recovery over overall depletion, the more groundwater resilience.
| Resiliency Indicator (RI) or Percentage of Recovery (%) | Resiliency Class | Interpretation |
|---|---|---|
| 0 to 2 | Not resilient | Less groundwater recharge, higher reduction of groundwater level. |
| 2 to 4 | Fairly resilient | Less groundwater recharge, fair reduction of groundwater level |
| 4 to 6 | Moderately resilient | Moderate groundwater recharge, moderate reduction of groundwater level |
| 6 to 8 | Highly resilient | Higher groundwater recharge, less reduction of groundwater level |
| >8 | Very highly resilient | Higher groundwater recharge and very less reduction of groundwater level |
Groundwater system is very highly resilient if the groundwater level increases in future. Also, for higher groundwater recharge and lesser reduction in groundwater level, groundwater system will be highly resilient (decrease in groundwater level is less than 20 times the groundwater recharge). Similarly, for lesser groundwater recharge and higher reduction in groundwater level, groundwater system is not resilient (decrease in groundwater level is greater than 50 times the groundwater recharge).
2.6. Quantification of uncertainties
In climate change impact assessments studies, uncertainty quantification is an important issue because meteorological variables, such as precipitation and temperature must be projected several decades into the future. It is quite impossible to remove the uncertainties, however we can quantify it using several tools and techniques. This study also follows some uncertainty quantification techniques such as evaluation of regional climate models and finding the best RCMs for the study region. The main source of the uncertainty in climate impact analysis is emission scenarios and climate models and the uncertainty coming from the hydrological and groundwater model is very small compared to it coming from climate models. As we are reducing and quantifying the uncertainties from climate models it also helps in reducing the uncertainties from the models. We have used a physically-based hydrological model and this kind of model helps to reduce the parameter uncertainties. Also, the input data are the main source of uncertainties in modelling work. Since we have used the most efficient input data sets from respective organisations of each city, it also helps to reduce uncertainties.
3. RESULTS AND DISCUSSION
3.1. Evaluation of RCMs
The evaluation of Regional Climate Models (RCMs) in each city was done based on their ability to replicate the observed climate datasets. This study assesses the capability of 21 RCMs from the Coordinated Regional Climate Downscaling Experiment (CORDEX) to simulate climate extremes in the rapidly developing Asian cities (Bangkok and its surroundings, Ho Chi Minh City, Kathmandu Valley, and Lahore) that are highly vulnerable to climate change. A detailed description of the evaluation of RCMs can be assessed by Neupane et al. (2021). Table 2 shows the list of top five better performing RCMs in four Asian cities, which in turn were used to project the future climate of respective Asian cities.
| Rank | Selected RCMs | |||
|---|---|---|---|---|
|
|
|
|
|
|
| Bangkok and its vicinity | Ho Chi Minh city | Kathmandu Valley | Lahore | |
| 1 | WAS44-SMHI-RCA4-IPSL-CM5A-MR | WAS44-SMHI-RCA4-MIROC5 | WAS44-IITM-REGCM4-4-CSIRO-MK3-6-0 | WAS44I-CSIRO-CCAM-MPI-ESM-LR |
| 2 | WAS44-SMHI-RCA4-NCC-NorESM1-M | WAS44-SMHI-RCA4-CCCma-CanESM2 | WAS44-SMHI-RCA4-MIROC5 | WAS44-IITM-REGCM4-4-MPI-ESM-MR |
| 3 | WAS44-SMHI-RCA4-CCCma-CanESM2 | WAS44-IITM-REGCM4-4-MPI-ESM-MR | WAS44-SMHI-RCA4-IPSL-CM5A-MR | WAS44-IITM-REGCM4-4-CERFACS-CNRM-CM5 |
| 4 | WAS44-SMHI-RCA4-ICHE-EC-EARTH | WAS44-SMHI-RCA4-IPSL-CM5A-MR | WAS44-SMHI-RCA4-CCCma-CanESM2 | WAS44-SMHI-RCA4-NOAA-GFDL-ESM2M |
| 5 | WAS44-SMHI-RCA4-MPI-ESM-LR | WAS44-SMHI-RCA4-MPI-ESM-LR | WAS44-IITM-REGCM4-4-MPI-ESM-MR | WAS44-IITM-REGCM4-4-CSIRO-MK3-6-0 |
3.2. Projected future climate of Asian cities
The future climate of four Asian cities is projected using the top five better-performing RCMs obtained from the evaluation study (Table 2) for three future periods: 2010 to 2039 or near future (NF), 2040 to 2069 or mid future (MF), and 2070 to 2099 or far future (FF) relative to the baseline period (1976–2005) under two emission scenarios (RCP 4.5 and RCP 8.5). A quantile mapping technique was used to remove the biases from future climate data.
3.2.1. Temperature trends
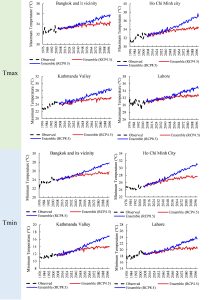
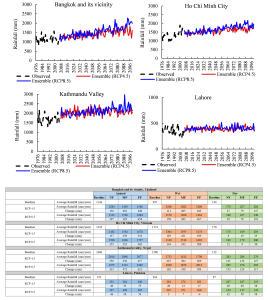
The study’s findings indicate that future temperatures are predicted to rise in all four Asian cities for both RCPs scenarios, which aligns with the global temperature trend. By the end of the twenty-first century, the average annual maximum temperature for Bangkok and the surrounding area is predicted to rise by 0.4°C to 1.5°C under RCP 4.5 and by 0.5°C to 3.1°C under RCP 8.5. Similarly, it is anticipated that the average annual minimum temperature would rise by 0.8°C to 2°C in RCP 4.5 and 0.9°C to 4.3°C in RCP 8.5.
By 2099, the average annual maximum temperature in Ho Chi Minh City, Vietnam, is projected to rise by 0.52°C to 2.71°C under RCP 4.5 and 0.75°C to 5.13°C under RCP 8.5. Similarly, it is anticipated that the average annual minimum temperature would rise by 0.73°C to 5.13°C in RCP 4.5 and 0.97°C to 6.68°C in RCP 8.5.
The average annual maximum temperature is predicted to rise in the Kathmandu Valley by 0.22°C to 2.44°C by the end of the twenty-first century under RCP 4.5 and by 0.60°C to 5.38°C under RCP 8.5. Similar to this, it is estimated that the average annual minimum temperature would rise by 0.48°C to 3.52°C in RCP 4.5 and 0.57°C to 5.60°C in RCP 8.5.
By 2099, Lahore’s average annual maximum temperature is anticipated to rise by 0.16°C to 2.85°C under RCP 4.5 and by 0.31°C to 4.43°C under RCP 8.5. Similarly, it is anticipated that the average annual minimum temperature would rise by 0.46°C to 3.72°C in RCP 4.5 and 0.62°C to 6.07°C in RCP 8.5. The yearly maximum and lowest temperature trend for four Asian cities is shown in Figure 3.
3.2.2. Rainfall trends
As for rainfall, all four Asian cities are expected to receive more rainfall in future. All RCMs and both RCP scenarios agree that rainfall is expected to increase annually throughout all time periods. For Bangkok and its vicinity, the relative increase in future rainfall ranges from 12.04% to 36.64% for RCP 4.5 scenario and 17.19% to 57.42% for RCP 8.5 scenario. For Ho Chi Minh City, the relative increase in future rainfall ranges from 10.18% to 24.83% under RCP 4.5 scenario and 11.52% to 28.40% under RCP 8.5 scenario. Likewise, the relative increase in future rainfall for Kathmandu Valley ranges from 21.44% to 25.12% for RCP 4.5 and 18.97% to 37.41% for RCP 8.5 scenario. For Lahore, the relative increase in future rainfall ranges from 11.39% to 15.67% under RCP 4.5 scenario and 13.1% to 15.38% under RCP 8.5 scenario. The maximum increase in future rainfall is expected for Bangkok and its vicinity, Thailand. Projection shows that the amount of rainfall is going to increase significantly during both dry and wet seasons for all four Asian cities. For four Asian cities, Figure 4 displays the yearly rainfall trend and an overview of the absolute change in annual, dry- and wet-season rainfall.
3.3. Projected future land-use of Asian cities
Future land-use change in all four Asian cities was projected using the Dyna-CLUE model. Three land use scenarios (HU, MU and LU) were developed for Bangkok and its vicinity, Ho Chi Minh City, Kathmandu Valley and Lahore to analyse its impact on groundwater. For Bangkok and its vicinity, in a high urbanisation scenario, agricultural land decreases from 69% of total land area to 33% from 2015 to 2099. Whereas built-up area increases from 15% to 52% of total land area. For medium urbanisation scenario, built up area increases from 15% of total land area to 25% from 2015 to 2099 and in low urbanisation scenario, forest area increases from 7% to 25% of total land area from 2015 to 2099 whereas, built up area is constant in all the future period.
For Ho Chi Minh City, in a high urbanisation scenario, agricultural land decreases from 32% of total land area to 2% from 2015 to 2099. Whereas built-up area increases from 26% to 62% of total land area. For medium urbanisation scenario, built up area increases from 26% of total land area to 35% from 2015 to 2099 and in low urbanisation scenario, forest area increases from 29% to 50% of total land area from 2015 to 2099 whereas, built up area is constant in all the future period.
Likewise for Kathmandu Valley, in a high urbanisation scenario, agricultural land decreases from 10% of total land area to 2% from 2015 to 2099. Whereas built-up area increases from 21% to 51% of total land area. For medium urbanisation scenario, built up area increases from 21% of total land area to 25% from 2015 to 2099 and in low urbanisation scenario, forest area increases from 62% to 75% of total land area from 2015 to 2099 whereas, built up area is constant in all the future period.
In Lahore, agricultural land decreased from 95% of total land area to 75% from 2015 to 2099 under a high urbanisation scenario. In contrast, built-up area rises from 4% to 25% of total land area. Built-up area increases from 4% to 12% of total land area in the medium urbanisation scenario from 2015 to 2099, while forest area increases from 0.1% to 25% of total land area in the low urbanisation scenario from 2015 to 2099.
Figure 5 shows the land use map of four Asian cities in different future periods under a high urbanisation scenario. The land use map of four Asian cities for medium and low urbanisation scenario is represented in Supplementary Figures 1 and 2, respectively.
3.4. Groundwater recharge trends
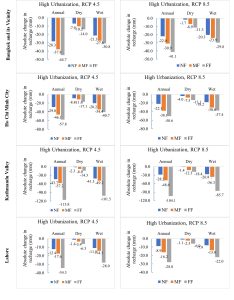
For all four Asian cities, the groundwater recharge for the reference period 2001–2005 (Bangkok and its vicinity), 1989–2002 (Ho Chi Minh City), 1979–2005 (Kathmandu Valley) and 2000–2005 (Lahore) and for three future periods: 2010 to 2039 or near future (NF), 2040 to 2069 or mid future (MF), and 2070 to 2099 or far future (FF) were approximated seasonally and yearly (wet season from May–October and dry season from November–April). In the high and medium urbanisation scenarios, groundwater recharge is predicted to decrease, whereas it will rise in the low urbanisation scenario in both RCP scenarios. Future recharge in groundwater is anticipated to rise further during the dry season. The decline in future groundwater recharge is expected to be significant in the wet season.
For Bangkok and its vicinity, in a high urbanisation scenario, according to RCP 4.5 and RCP 8.5, the rate of fall in groundwater recharge will be between 28.3 mm/yr to 44.7 mm/yr and 22 mm/yr to 41.1 mm/yr, respectively. In a similar manner, future groundwater recharge for the medium urbanisation scenario is anticipated to decrease from 22.6 mm/yr to 33.3 mm/yr for RCP 4.5 and RCP 16.7 to 30.2 mm/yr for the RCP 8.5. In contrast, the expected increase in future groundwater recharge for low urbanisation scenarios ranges from 19.6 mm/yr to 35.8 mm/yr and 27.4 mm/yr to 40.1 mm/yr for RCP 4.5 and RCP 8.5, respectively.
In the high urbanisation scenario for Ho Chi Minh City, according to RCP 4.5 and RCP 8.5, the rate of fall in groundwater recharge will be between 22.1 mm/yr and 50.6 mm/yr and 29 mm/yr to 57.8 mm/yr, respectively. In a similar manner, future groundwater recharge for the medium urbanisation scenario is anticipated to decrease from 18.9 mm/yr to 46.1 mm/yr for RCP 4.5 and from 13.9 mm/yr to 42.1 mm/yr for RCP 8.5. In contrast, the expected increase in future groundwater recharge for low urbanisation scenarios ranges from 16 to 33.9 mm/yr for RCP 4.5 scenarios and 22.4 to 36.8 mm/yr for RCP 8.5 scenarios.
In Kathmandu Valley, for a low urbanisation scenario, the anticipated upsurge in future groundwater recharge ranges from 57.3–104.9 mm/yr and 65.7–116 mm/yr for RCP 4.5 and RCP 8.5, respectively. For the high urbanisation scenario, the drop in future groundwater recharge is anticipated to vary from 43.7–115.8 mm/yr and 28.2–104.1 mm/yr for the RCP 4.5 and RCP 8.5 scenario, respectively. For medium urbanisation scenario, groundwater recharge is expected to increase by 10.3 mm/yr and 1.4 mm/yr in near and mid future, whereas it is expected to decrease by 13.4 mm/yr in far future under RCP 4.5 scenario and for RCP 8.5 scenario, groundwater recharge is projected to increase by 15.1 mm/yr, 5.8 mm/yr and 2.4 mm/yr in near, mid, and far future, respectively.
For Lahore, in a high urbanisation scenario, the drop in future groundwater recharge is anticipated to differ between 12.4–34.3 mm/yr and 8.9–28 mm/yr for the RCP 4.5 and RCP 8.5, respectively. Future groundwater recharge for the medium urbanisation scenario is anticipated to decrease from 6.4 mm/yr to 23.2 mm/yr for RCP 4.5 and RCP 4.8 to 20 mm/yr for RCP 8.5. Whereas, for a low urbanisation scenario, the expected upsurge in future groundwater recharge ranges from 11.3 mm/yr to 27.2 mm/yr for RCP 4.5 scenario and 20.3 mm/yr to 34.4 mm/yr for RCP 8.5.
The findings show a progressive rise in groundwater recharge from the near future to the distant future in low urbanisation scenarios, with the lowest recharge found in high urbanisation scenarios. This is due to increased impervious surface induced by rapid urbanisation (Adhikari, Mohanasundaram, & Shrestha, 2020). It may also be established that changes in land-use patterns contribute much more to or less to groundwater recharge than changes in climate.
Figure 6 depicts the combined consequences of climate change and land use change under RCP 4.5 and RCP 8.5 scenarios and high urbanisation scenario on groundwater recharge across three future time periods: NF, MF and FF relative to the baseline period in four Asian cities. Medium and low urbanisation scenariosis presented in Supplementary Figures 3 and 4, respectively.
3.5. Groundwater level trends
Following a comparison with the baseline year 2001, projections were made for four future periods: 2035, 2055, 2075, and 2095 under two RCP scenarios and three land-use change scenarios (high, medium, and low urbanisation). Three abstraction scenarios (similar to land-use scenarios) were also examined in order to compute future groundwater abstraction, which was then utilised to forecast future groundwater levels in all aquifer layers.
For Bangkok and its environs, the results show that average groundwater levels are anticipated to fall under high urbanisation scenarios and all RCPs scenarios. Whereas, for medium and low urbanisation scenarios and both RCPs scenarios it is expected to increase in future. The amount of change in groundwater level through the Bangkok city is not uniform. All RCPs cause a fall in groundwater level in the city and high urbanisation scenario with the central part experiencing noteworthy reduction in groundwater level as compared to western and eastern part. Under the high urbanisation scenario, the highest fall in groundwater level was 30.5 m and 29.5 m by 2095 in the NB aquifer for RCP 4.5 and RCP 8.5 scenarios, respectively. Under all RCPs, the groundwater level in Bangkok increased for medium and low urbanisation scenario with the increment higher in western and eastern part as compared to central part and maximum increase in groundwater level by 31.06 m and 32.06 m by 2095 was seen in NB aquifer for RCP 4.5 and RCP 8.5 scenarios, respectively under low urbanisation.
In Ho Chi Minh City, the average groundwater level is expected to fall under high urbanisation scenarios and all RCPs. In contrast, it is expected to rise in the future for medium and low urbanisation scenarios, as well as both RCPs. The amount of change in groundwater level is not uniform throughout Ho Chi Minh City. Under all RCPs and high urbanisation scenarios, the city experiences a decrease in groundwater level, with the central part experiencing a significant decrease in groundwater level as compared to the northern (Chu Chi) and southern parts (Can Gio). Under the high urbanisation scenario, the upper middle Pleistocene aquifer experienced the greatest decrease in groundwater level of 56.9 m and 53.5 m by 2095, respectively. Ho Chi Minh City experienced an upsurge in groundwater level for all RCPs, medium and low urbanisation scenarios, with the increase being greater in the northern (Chu Chi) and southern (Can Gio) parts of the city than the central part, and the maximum increase in groundwater level by 21 m and 22.5 m by 2095 was seen in the middle Pleistocene aquifer for RCP 4.5 and RCP 8.5 scenarios, respectively, under low urbanisation.
The average groundwater level in Kathmandu Valley will decline in the future under all three pumping scenarios: high, medium, and low urbanisation, as well as both RCP scenarios. The average decline in groundwater level was greater in the high urbanisation scenario than in the medium and low urbanisation scenarios. The pace of decline in groundwater level is not uniform throughout the Valley. The fall in groundwater level in the Valley’s centre is considerable, and it is considerably greater than in the northern and eastern parts. The maximum decrease in groundwater level of 70 m and 66.7 m by 2095 was seen in well M4 (Lubhoo) for RCP 4.5 and RCP 8.5 scenarios, respectively under high urbanisation scenario. Whereas minimum decrease of 1.5 m and 1.3 m by 2095 was seen in well GK4 (Nayapati) for RCP 4.5 and RCP 8.5 scenarios, respectively under low urbanisation scenarios.
The average groundwater level in Lahore is expected to fall under high urbanisation scenarios and all RCPs. In contrast, it is expected to rise in the future for medium and low urbanisation scenarios, as well as both RCP scenarios. The pace of decline in groundwater level in Lahore is not uniform. The fall in groundwater level in the city’s centre is significant and much greater than in the outskirts. Under the high urbanisation scenario, the maximum decrease in groundwater level was 62.3 m and 57.2 m by 2095 in well Dhobi Ghat for RCP 4.5 and RCP 8.5 scenarios, respectively. Ghazi Mohala Children Park Ghari Shahu saw increases of 16 m and 18.9 m by 2095 for RCP 4.5 and RCP 8.5 scenarios, respectively under low urbanisation scenarios.
These regional disparities in groundwater level may be related to the amount of groundwater pumping caused by the intensity of the pumping wells. The core section of Asian cities is more densely inhabited, has the most abstraction wells, and draws the most water for home, industrial, and other commercial activity. Also, the centre areas of Asian cities are built-up, restricting groundwater recharge to aquifers.
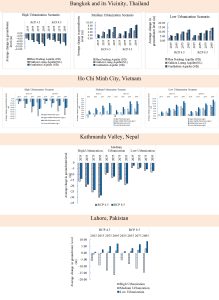
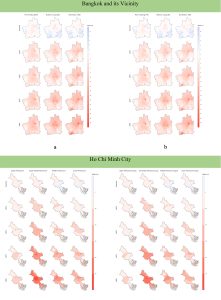
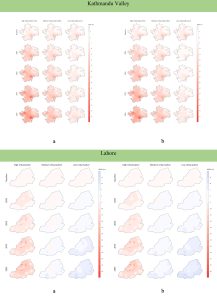
Figure 7 shows the average change in groundwater level for both RCP scenarios (RCP 4.5, RCP 8.5), three land-use change and pumping scenarios (low, medium, and high urbanisation) for four future periods: 2035, 2055, 2075 and 2095 relative to the baseline in four Asian cities and Figures 8 and 9 shows absolute change in future groundwater level with respect to observed groundwater level in 2035, 2055, 2075 and 2095 for aquifer layers under high urbanisation scenario and RCP 4.5 (a) and 8.5 scenarios (b) in Bangkok and its vicinity and Ho Chi Minh City, Kathmandu Valley and Lahore. The results under medium and low urbanisation scenarios for Bangkok and its vicinity and Ho Chi Minh City are presented in Supplementary Figures 5 and 6, respectively.
3.6. Spatial variation in groundwater resiliency
Based on the results of groundwater recharge from hydrological models and groundwater level from groundwater models, a groundwater resilience map of Asian cities was created. In this research groundwater resiliency is specified as the percentage recuperation over total depletion. The groundwater resiliency map of all four Asian cities was developed for five time periods (2025, 2035, 2055, 2075 and 2095) under three land use and pumping scenarios (low, medium, and high urbanisation scenario) and climate change scenarios (RCP 4.5 and RCP 8.5).
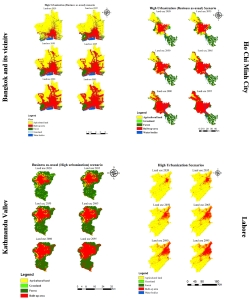
Under high urbanisation scenarios, it is anticipated that less land area will fall into the “very highly resilience class” in Bangkok and the surrounding area, while more land area will fall into the “not resilient class” as time goes on. This is true for all climate change scenarios and for all three aquifer layers. Central part of Bangkok and its vicinity (Bangkok metropolis, Pathum Thani, Nonthaburi, Samut Sakhon, Ayutthaya) are not resilient to climate change and human development. Due to the dense habitation in the city’s centre, the aquifers receive less groundwater recharge. Besides this the central part of the Bangkok consists of underlying clay layer which forbid the water to enter the aquifers. Also, groundwater abstraction in these areas is very high due to high population density and industrial areas. Western part of Bangkok and its vicinity (Nakhon Pathom) is resilient to climate change and human development. Western part of the city is the major groundwater recharge zone for the Bangkok aquifer system. Under medium and low urbanisation scenarios the findings show an expected expansion in proportion of area under “very highly resilient class”.
In Ho Chi Minh City, under high urbanisation scenarios, there is projected diminution in percentage of area under “very highly resilience class” while the area under “not resilient class” is increasing as we move to the future, and this is valid for all climate change scenarios and all four aquifer layers. Central part of Ho Chi Minh City (District 1-12, Binh Chan, Hoc Mon, Binh Tan) is not resilient to climate change and human development. For the Lower Pleistocene aquifer all part of HCMC is not resilient to climate change and human development. Due to the dense habitation in the city’s centre, the aquifers receive less groundwater recharge. Also, groundwater abstraction in these areas is very high due to high population density and industrial areas. Northern part of Ho Chi Minh City (Chu Chi) and Southern part (Can Gio) is resilient to climate change and human development for three aquifer layers. Northern part of the city is the major groundwater recharge zone for HCMC aquifer system. Southern part consists of forest area (conservation area), increasing groundwater recharge to the aquifers. Under medium and low urbanisation scenarios the findings show an expected expansion in percentage of area under “very highly resilient class”.
According to the data, the percentage of the Kathmandu Valley that falls into the “very highly resilient” class is predicted to decline over time, while the percentage of the “not resilient” class is predicted to rise. For areas with high urbanisation compared to those with medium and low urbanisation, there was a considerable decline in the area categorised as “very highly resilient” and an expansion in the area under “not resilient”. Central part of the Kathmandu Valley (Lubhu, Kathmandu airport, Baneshwor, Swayambhu, Patan, Baluwatar) are not resilient to climate change and human development. Due to the dense habitation in the Valley’s centre, the aquifers receive less groundwater recharge. Also, groundwater abstraction in these areas is very high due to high population density and industrial areas. Northern part of the Valley (Budhanilkantha, Sundarijal, Shakhu, Danchi, Gokarna) are resilient to climate change and human development. Northern part of the Valley is the major groundwater recharge zone for Kathmandu aquifer system. This part is a semi urban area with more agricultural area and forest as compared to built-up hence the groundwater recharge in these areas is high.
According to the high urbanisation scenario projections for Lahore, the proportion of area falling into the “very highly resilience” class is anticipated to decline over time, while the percentage of land falling into the “not resilient” category is projected to rise. Central parts of Lahore (Allama Iqbal town, Johar town, Shahadara, Badshahi mosque, Garhi Shahu) are not resilient to climate change and human development. Due to the dense habitation in the city’s centre, the aquifers receive less groundwater recharge. Also, groundwater abstraction in these areas is very high due to high population density and industrial areas. The outskirts of the city (Lokhori, Jahman, Padhana, Wahqa, Manga mandi) are resilient to climate change and human development. Outskirts part of the city is a semi urban area with more agricultural land hence the groundwater recharge in these areas is high.
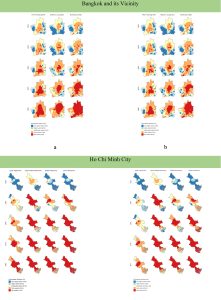
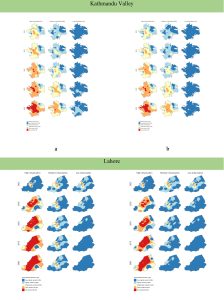
Figure 10 shows the groundwater resilience map of Bangkok and its vicinity and Ho Chi Minh City in five different time periods 2025, 2035, 2055, 2075, and 2095 under high urbanisation scenarios and RCP 4.5 (a) and RCP 8.5 (b) scenarios. For medium and low urbanisation scenarios, the results are presented in Supplementary Figures 7 and 8, respectively. Figure 11 shows the groundwater resilience map of Kathmandu Valley and Lahore in five different time periods 2025, 2035, 2055, 2075, and 2095 under high, medium and low urbanisation scenarios and RCP 4.5 (a) and RCP 8.5 (b) scenarios.
4. DISCUSSION
The results indicate a gradual increase in groundwater recharge in the low urbanisation scenarios from the near future towards the far future, with the lowest recharge observed in high urbanisation scenarios. This is due to a greater increase in the built-up area (impervious surface) caused by high urbanisation (Adhikari et al., 2020, Ghimire et al., 2021). It can also be concluded that land-use pattern changes significantly contribute to the increase or decrease in groundwater recharge in comparison to changes in climate.
Groundwater of good natural quality is an excellent source of drinking water. The reduction in groundwater recharge leads to a drop in the groundwater table, which can have a negative impact on human life by affecting the quality of groundwater. Groundwater is also one of the most important sources of water for irrigation and industrial purposes. Reduction in groundwater recharge may lead to the shortage of water for agricultural and industrial purposes affecting the economy of the whole country, living standard of the people and other social impacts such as displacement of population, loss of scarce agricultural land, etc. Besides this, reduction in groundwater recharge may cause land subsidence resulting in loss of properties and human life. Techniques like rainwater harvesting, artificial recharge techniques in addition to low urban development planning and adopting climate change strategies may lead to the sustainable aquifer in the Asian cities in the future.
The over extraction of groundwater induced by rapid population growth, rapid urbanisation along with climate change may lead to complete depletion of groundwater and other environmental problems like land subsidence, contamination of groundwater table, and depletion of surface water resources. These consequences of groundwater depletion are directly linked with human life. The lowering of the groundwater table causes wells to no longer be able to reach groundwater and hence affecting the availability of water for domestic, agricultural, and industrial purposes. As the water table lowers, the water must be pumped farther to reach the surface, using more energy. In extreme cases, using such a well can be prohibitive. Groundwater and surface water are connected. The depletion of groundwater lever can lower lake levels or in extreme cases intermittent or totally dry perennial streams. These effects can harm aquatic and riparian plants and animals that depend on regular surface flows. Excessive pumping in coastal areas can cause saltwater to move inland and upward, resulting in saltwater contamination of the water supply. The over extraction of groundwater might cause land subsidence and sinkhole formation in areas of heavy withdrawal. These changes can damage buildings, roads, and other structures as well as human life. Techniques like rainwater harvesting, artificial recharge techniques in addition to low urban development planning and adopting climate change strategies along with improving the groundwater governance of respective cities is for the protection and sustainable management of groundwater resources.
Based on the results and variability in terms of climate change and human development, it can be concluded that the groundwater resources in the Asian cities are at risk due to climate change and human development. The reduction in groundwater recharge and depletion of groundwater are both associated with decreasing resiliency of groundwater system in Asian cities. Asian cities are heavily dependent on groundwater resources for their daily water supply. The reduction in groundwater recharge and depletion in groundwater table can have serious impact on socio-economic aspect of the country due to contamination of groundwater, depletion of surface water resources and problem of land subsidence. Therefore, proper monitoring of the groundwater condition and development of adaptation is crucial for sustainable management of groundwater resources in the Asian cities.
5. CONCLUSION
Groundwater resources play a very crucial role in sustainable development of main Asian cities. The over extraction of groundwater caused by rapid growth in population, rapid expansion in urban land, economic development, tourism development alongside with climate change may lead to extensive reduction of groundwater level causing social, environmental, and economic problems. Therefore, this study objects to examine the resilience of groundwater system to climate change and anthropogenic development in Asian cities: Bangkok and its vicinity, Thailand, Ho Chi Minh City, Vietnam, Lahore, Pakistan and Kathmandu Valley, Nepal, which eventually helps in the management and protection of groundwater resources as well as to develop strategies for sustainable use. A unified methodology was used to conduct the study.
To assess groundwater resiliency in Asian cities, twenty-one CORDEX RCMs were evaluated based on their capacity to simulate climate extremes in fast-expanding Asian cities that are especially sensitive to climate change. The top five better performing RCMs along with two RCPs scenarios were used to project future climate in respective Asian cities for three future periods. All RCMs and both RCP scenarios project that the Asian cities are expected to be warmer in future. The maximum increase (by 4.1°C) in maximum temperature and (by 5.6°C) in minimum temperature is expected for Ho Chi Minh City. The results show that all the Asian cities will receive more rainfall under both RCP scenarios with Bangkok and its vicinity experiencing maximum increase in future rainfall by 658 mm.
An empirical land use projection model Dyna-CLUE was used to project the future land use change of the study area. Dyna-CLUE was used to create land-use maps of Asian cities up until 2099 based on three future land-use scenarios: LU, MU, and HU. These scenarios focused on the growth of built-up areas. The effects of climatic change and human development on groundwater recharge and level were also investigated. Groundwater recharge is expected to decline in all four Asian cities under the high urbanisation scenario and both RCP scenarios (by up to 115 mm in Kathmandu Valley), but it is anticipated to increase in all future scenarios under the low and medium urbanisation scenarios and both RCP scenarios. In the case of Bangkok, Ho Chi Minh City and Lahore, the average groundwater level is projected to decrease under high urbanisation scenarios and all RCP scenarios. Whereas, for medium and low urbanisation scenarios and both RCP scenarios it is projected to increase in future. For Kathmandu Valley, on average, the groundwater level will decrease in future for all three pumping scenarios: high, medium and low urbanisation and both RCP scenarios. The average decrease in groundwater level was higher for high urbanisation than medium and low urbanisation scenarios. Spatially, the central part of all the Asian cities experiences maximum decrease in groundwater level. These spatial differences in groundwater level might be linked to the level of groundwater abstraction by the density of the pumping wells. In contrast, the central part of the Asian cities is a highly built-up area, reducing groundwater recharge to the aquifers.
For Bangkok and its vicinity, Ho Chi Minh city and Lahore, the results show a projected increase in percentage of area under “very highly resilient class”, for medium and low urbanisation scenarios, and for high urbanisation scenario, there is projected decrease in percentage of area under “very highly resilience class” while the area under “not resilient class” is increasing, which is valid for all climate change scenario and all three aquifer layers. For Kathmandu Valley, results show a projected decrease in the percentage of area under “very highly resilient” class and a projected increase in the “not resilient” class towards the future periods. The decrease in the area classified as “very highly resilient” and an increase in the area under “not resilient” was significant and higher for high urbanisation than medium and low urbanisation.
According to the findings and variance in climate change and human development, it is possible to conclude that groundwater supplies in all four Asian cities are threatened by climate change and human growth. As a result, appropriate groundwater monitoring and adaptive development are vital for the sustainable management of groundwater resources in Asian cities.
6. ACKNOWLEDGEMENT
We would like to express our sincere gratitude to the Asia-Pacific Network for Global Change Research (APN) for funding the project referenced CRRP2018-01MY-Shrestha. We would also like to express our sincere thanks to Dr Binaya Shivakoti from the Institute for Global Environmental Strategies (IGES), Japan, Dr Oranuj Lorphensri from the Department of Groundwater Resources (DGR), Thailand, Dr Bui Tran Vuong from Division of Water Resource Planning and Investigation for the South of Vietnam (DWRPIS), Vietnam, Dr Muhammad Basharat from the International Waterlogging and Salinity Research Institute (IWASRI), Pakistan, Dr Rabin Malla from the Centre of Research for Environment Energy and Water (CREEW), Nepal and Dr S. Mohana Sundaram from the Asian Institute of Technology (AIT), Thailand. Our special thanks to several researchers, government officials and non-governmental organisations who participated in this project directly and indirectly by providing valuable time, experiences and expertise, datasets, including being part of the workshops, and e-consultations conducted in this project.