
Mapping demographic proxy-based social vulnerability for small island coastal communities in a multi-hazard setting: Reference from Indonesia
Keywords
Coastal Communities · Demographic proxy · Grid Mapping System · Multi-Hazard · Principal Component Analysis · Social Vulnerability · Socioeconomic Factors
1. INTRODUCTION
Indonesia has the third-longest coastline in the world, with over 17,000 islands (Gaborit, 2022) and more than 270 million inhabitants (World Bank, 2022). This geographic condition creates this country’s high exposure to sea-level rise (Nurhidayah, 2021; Setiawati, Chatterjee et al., 2023), flooding (Firman et al., 2011), storms (Haryanto et al., 2019), drought (Aldyan, 2023), wildfires (Gaveau et al., 2026) and other extreme events (Haryanto et al., 2019). Additionally, Vij et al. (2017) found that climate change is expected to increase precipitation, exacerbating flooding issues, including in Indonesia. Despite these climate-related hazards, urban areas in Indonesia are experiencing significant population growth and urbanisation (Mardiansjah et al., 2021; Setiawati et al., 2021). This rapid urbanisation is closely linked to a rising demand for freshwater and unsustainable groundwater extraction (Soekarno et al., 2024; Tirtomihardjo, 2016). As a result, these trends have led to serious environmental issues, including land subsidence (As-syakur et al., 2023), degradation of water quality (Gaborit, 2022), and an increased risk of water scarcity and flooding (Gaborit, 2022). Consequently, the interconnected environmental and socioeconomic factors disproportionately impact vulnerable groups, influencing disaster risk reduction and climate adaptation planning. This situation highlights the necessity for spatially detailed assessments of social vulnerability to inform evidence-based adaptation strategies.
In general, vulnerability can be examined from social and economic perspectives (Ajtai et al., 2023). The economic aspect determines physical susceptibility, resulting in financial loss. Meanwhile, the social aspect defines the population’s susceptibility, which could make the community unable to manage risk. The economic losses that hazards may inflict have been extensively studied, with numerous studies utilising Geographic Information System (GIS) tools and depth-damage algorithms to examine the physical susceptibility (Martínez-Gomariz et al., 2021; Rimba et al., 2017; Sambah & Miura, 2014). Furthermore, many investigations have examined the potential impacts of future hazards on socioeconomic and climatic change (Setiawati et al., 2021; Shoreman-Ouimet et al., 2024). In contrast, social vulnerability at a finer scale for coastal communities has received little spotlight, particularly in Indonesia, and has only recently become prominent. According to this framework, societal vulnerability is the likelihood that people will be affected by coastal hazards, which are elements of change that shift in space and time based on the characteristics of a particular neighbourhood in a specific area Ajtai et al. (2023).
Social vulnerability is a multifaceted concept shaped by social, economic, institutional, cultural, and political processes that influence people’s ability to anticipate, cope with, respond to, and recover from risks (Rashidfarokhi et al., 2026). These underlying processes are frequently mirrored by socioeconomic factors such as age, income or wealth, health conditions, handicap status, gender, race, and ethnicity, which have been regularly employed in vulnerability assessment studies as measurable indicators or proxies of susceptibility, as well as building density, the quality of the structures, the availability of resources, medical care, and the severity of hazards. While social vulnerability includes broader dimensions such as social exclusion, resource access, governance, and power dynamics, many of these factors are difficult to quantify and portray geographically at small geographic scales. Thus, socioeconomic and demographic proxy variables that can be reliably measured and mapped across space are often used in GIS-based vulnerability assessments. In this study, five indicators were used to operationalise this approach: the overall population, the number of women, the number of people living in poverty, the number of elderly individuals, and the number of children. These groups are often considered to be more vulnerable to the impacts of disasters, according to previous studies on vulnerability (e.g., Kim et al., 2011; Setiawati et al., 2021; Wolf & McGregor, 2013). These variables were chosen because of their frequent application in previous research and availability at village and grid levels, allowing for spatially explicit evaluation in small-island settings with data constraints. We recognise that limitations in data availability, especially at the village and grid spatial resolutions used in this analysis, restrict the number of indicators we could include.
Assessing a community’s vulnerability to coastal hazards has become crucial for decision-making. It is vital to pinpoint areas at high risk of the hazards, create effective plans to manage the risks, and enhance non-structural hazard-prevention strategies. Additionally, governments at the local and national levels can forecast the effects of future multidimensional coastal hazards and carry out mitigation strategies and initiatives to strengthen the resilience of the populations that are affected by them using the information supplied by vulnerability assessments (Setiawati et al., 2021; Zhang et al., 2024).
The importance of developing approaches that thoroughly examine social vulnerability has been emphasised in the current context (Krellenberg & Welz, 2017; Rehman et al., 2019). The most commonly used technique for determining coastal vulnerability is a vulnerability index that comprises various variables that may affect it. The indicators describe communities from several angles (social, demographic, economic, built environment/place features, etc.), thereby influencing resilience and primarily focusing on pinpointing the most susceptible areas. A crucial phase in the analysis that significantly impacts the result is choosing the most pertinent indicators. The indications must be location-specific, taking into account the surrounding circumstances of the area under study. Therefore, in this research, we assessed the social vulnerability index that targets specific communities, that is, the communities that live within 1 km of the shoreline, where the grid system will be used as a mapping unit. This grid system will help policymakers target specific areas for prioritising program development, rather than relying on administrative boundaries that sometimes fail to reach coastal communities.
The Social Vulnerability (SoVI) assessment was first developed by Cutter et al. (2003) in the United States of America (USA) using 1990 data. The assessment used country-level socioeconomic and demographic data to generate the SoVi for environmental hazards (Cutter et al., 2003). They used factor analysis to simplify the indicators for the SoVI assessment; however, the weights remain the same across variables. Over time, this approach has evolved to incorporate additional variables and assign different weights (scores) to each variable. Despite the Cutter et al. (2003) approach, which appears simple, this assessment is applied to the decision making process in the USA (UNISDR, 2013) and in various countries, including Indonesia (UNISDR, 2013). In this research, we followed the framework of SoVI developed by Cutter et al. (2003), while modifying it to fit the small islands’ data-constrained environment. As a result, the SoVI developed in this work is a demographic proxy-based assessment of social vulnerability, utilising standard identifiers that are accessible for spatially explicit GIS analysis at the village and grid levels. Also, we modified the site-specific (within 1 km of the coastline) and applied Principal Component Analysis (PCA) to assign different weights to each variable. This PCA approach was used to avoid subjectivity and was commonly applied for vulnerability analysis. For instance, Ajtai et al. (2023), Mafi-Gholami et al. (2022), and Setiawati et al. (2021) employed PCA to assess the heat vulnerability index, SoVI for floods, and SoVI for natural disasters.
Developing a widely used technique for assessing SoVI is challenging due to the geographic and temporal variability of the variables. Research in this area is still challenged by various concerns that receive little attention, including personal decisions regarding indicators, the removal of the hazard dimension, equitable or biased weighting procedures, variable reduction due to data inaccessibility, and administrative boundary mapping units, which make pinpointing the exact area difficult. While several investigations addressed these challenges independently, a few complex methods have also sought to address the above-mentioned gaps. Thus, this study aims to address the primary gaps in the field by developing an extensive index-based approach to establish and evaluate social vulnerability in multi-hazard coastal settings. The term “multi-hazard coastal settings” refers to coastlines that are vulnerable to a range of interacting hazards, such as coastal flooding, rising sea levels, erosion and extreme weather events. However, rather than statistically combining these hazards into a single index, the current analysis focuses solely on the dimension of social vulnerability.
This study used two pilot sites representing small islands in Indonesia: Bintan and the Seribu Islands. The Bintan Islands could be representative islands surrounded by three countries, Singapore, Indonesia and Malaysia, and also face the open ocean, the South China Sea. This condition places Bintan under significant pressure from climate hazards and anthropogenic activities, such as mining, large-scale land conversion and oil spills (Nandika et al., 2023; Setiawati, Nandika et al., 2023). Meanwhile, the Seribu Islands are an archipelago within the Indonesian Capital Province of Jakarta, comprising 114 islands, of which 11 are inhabited (Setiawati, Chatterjee et al., 2023). This archipelagic district also has tiny terrestrial areas, averaging 87000 square metres at low elevation and a generally densely populated island (Setiawati, Chatterjee et al., 2023). Thus, the Seribu Islands are good pilot sites representing very small island states with high anthropogenic disturbance, as they are very close to Jakarta Mega City.
This study employed the social vulnerability framework at resolutions of 250 m and 500 m, compared with the previous index (Cutter et al., 2003; Nasution et al., 2020; UNISDR, 2013), which was developed at the administrative level. The grid resolution was chosen to reflect the physical and settlement characteristics of each study region. A 500 m grid was considered sufficient for Bintan, given that the island is considerably larger and settlements are more spatially separated. A finer grid size could result in many empty or sparsely populated cells, increasing spatial noise and weakening the stability of the social vulnerability representation. On the other hand, the Seribu Islands’ 250 m grid was used to more accurately depict the spatial diversity of extremely small islands and closely spaced coastal communities. This approach enables more detailed identification of vulnerable populations within 1 km of the coast. Additionally, it can distinguish between inhabited and uninhabited areas and identify islands with higher population density and greater vulnerability. The gridded technique is particularly important in coastal districts that contain several small islands within the same village boundary (e.g., Seribu Islands). With this more precise geographical resolution, local governments can prioritise disaster mitigation and adaptation efforts in specific coastal areas, armed with targeted information.
2. DATA AND METHODOLOGY
2.1. Study area
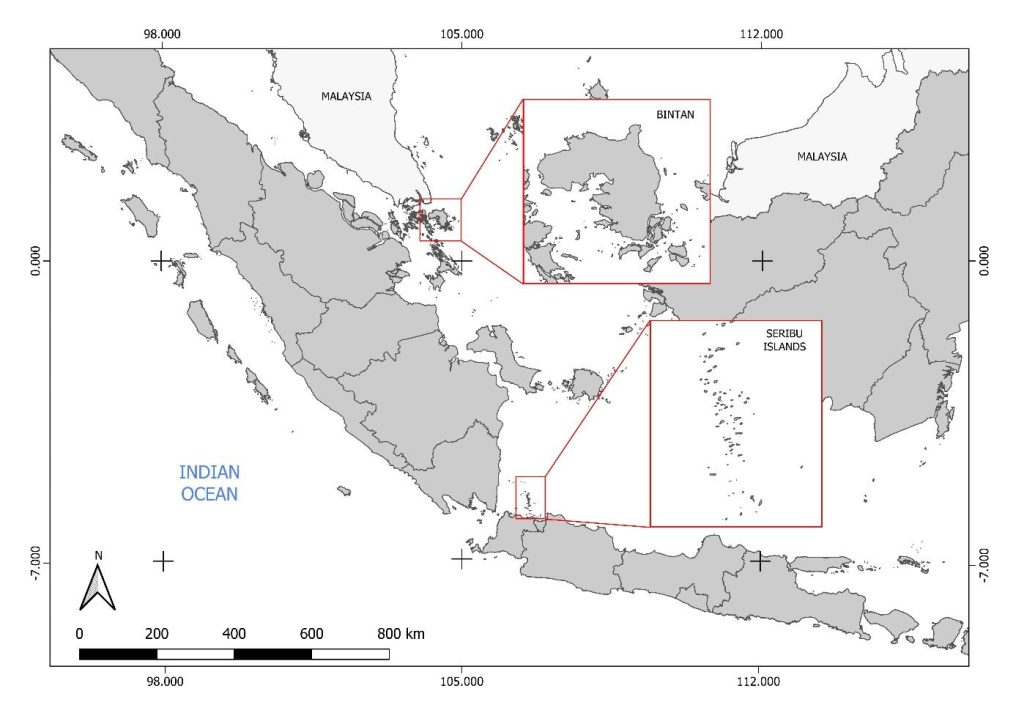
Small islands are widely recognised as among the places on earth most susceptible to climate change, particularly rising sea levels and extreme events (Vousdoukas et al., 2023). Also, climate threats in small island developing states are receiving increasing attention, as small islands suffer significant losses and damages from coastal extreme events such as tropical cyclones, sea level rise and flooding (Vousdoukas et al., 2023). Figure 1 shows the study area for this research, located on two small island groups in western Indonesia: the Bintan Islands in the Riau archipelago and the Seribu Islands in Jakarta Province. The pilot sites experienced significant increases in average air temperature of 1.46 °C in Bintan and 1.4 °C in the Seribu Islands over the past 40 years (Setiawati, Chatterjee et al., 2023; Setiawati, Nandika et al., 2023). The condition shows that the local temperature increase was nearly double the global temperature trend, as reported by NOAA (2021). Despite the warming temperature trend, these pilot sites have also experienced more frequent extreme precipitation and drought events in recent years (Setiawati, Chatterjee et al., 2023; Setiawati, Nandika et al., 2023). Moreover, previous research by Djamil et al. (2024) and Setiawati, Nandika et al. (2023) revealed that Bintan and Seribu Islands experienced a significant rise in sea level of 3.68 ± 1.04 mm/year and 4.17 ± 0.33 mm/year, respectively, from 1993 to 2022. Consequently, both pilot sites are predominantly hit by climate hazards such as storms, floods, drought and forest fires rather than geological hazards, which accounted for over 99% (Setiawati, Chatterjee et al., 2023; Setiawati, Nandika et al., 2023). Based on the aforementioned research, we selected the two small islands for the SoVi analysis, as small remote islands generally have limited access to information, medical care and quality education.
2.2. Data
Table 1 lists the detailed datasets used in the SoVI assessment. We have two primary dataset formats: a vector dataset of building polygons and administrative boundaries (i.e., GIS data format) and a sociodemographic dataset at the village level. The spatial distribution of the GIS dataset was obtained from Google Research-Open Building V3 and the Indonesian Geospatial Agency’s online platform. Moreover, the sociodemographic data at the village level were obtained from the local statistical agency’s website and the local government provided missing data during direct visits.
| Category | Indicator | Time span | Source |
|---|---|---|---|
| Vector data set | Building polygon | 2023 | Google Research — Open Buildings V3 (Sirko et al., 2021) (https://sites.research.google/open-buildings/) |
| Administrative map village level | 2023 | Geospatial Agency (https://tanahair.indonesia.go.id/portal-web) |
|
| Socio demographic data at the village level | Number of population | 2022 | Statistical Agency of Bintan (https://bintankab.bps.go.id/publication.html), Tanjung Pinang (https://tanjungpinangkota.bps.go.id/publication/) and Seribu Island (https://kepulauanseribukab.bps.go.id/publikasi.html) District Visiting the local authority of Bintan Island in June 2023 and Seribu Island in July 2023 to obtain some missing data |
| Number of women | 2022 | ||
| Number of people living in poverty | 2022 | ||
| Number of elderly | 2022 | ||
| Number of children | 2022 |
2.3. Methodology
2.3.1. Research framework
Figure 2 describes the framework of the SoVI assessment in this study. This research assessment was conducted following the scoping workshop to design the vulnerability framework for the Asia-Pacific network, held in Terengganu, Malaysia, from 23 to 24 May 2024. This scoping workshop involves eight researchers from Indonesia, Malaysia and India with various research backgrounds in ocean remote sensing, disaster risk reduction, geography, economics and sustainability science. In the scoping workshop, we identified four components to assess the SoVI for two pilot sites with different geographical sizes and characteristics. The four components were the variables, the mapping unit, the different scales of each variable and the scoring method.
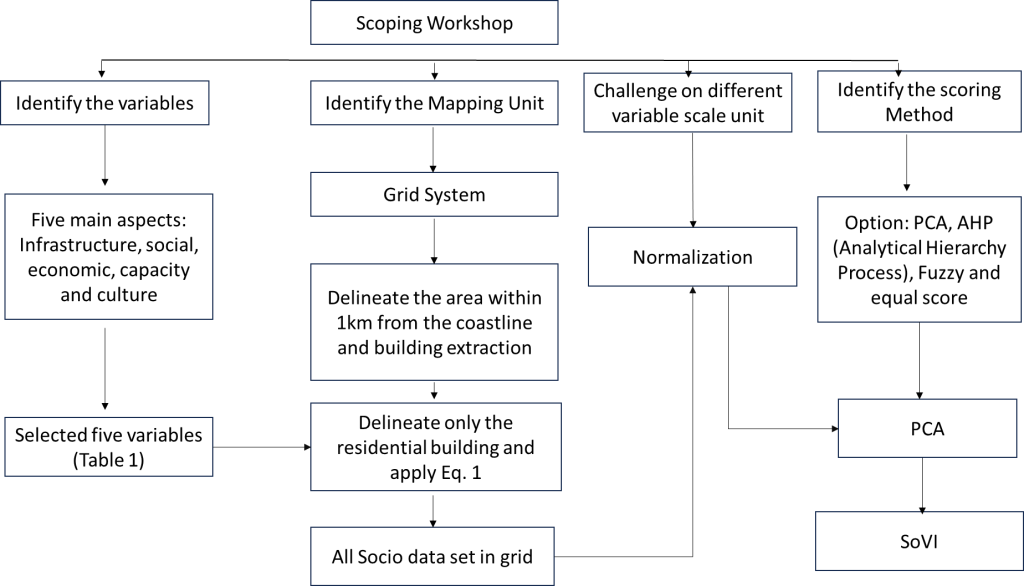
In this study, “SoVI” refers to a demographic evaluation of social vulnerability based on proxy indicators accessible at both the village and grid levels. In the beginning, we identified five aspects that need to be considered in order to assess the SoVI: (1) infrastructure—ratio hospital/health facilities, road network, commercial area; (2) Social: population, gender ratio, poverty, disabled, age group, migration, married status, education (-boundary, high school), ethnic minority, health worker ratio, number and type of transport; (3) Economical: income, occupation, number of households, number of children; (4) Capacity: knowledge (hazard, early warning system), emergency management, ability to cope with disaster by themselves, community participation (disaster task team, village volunteer), access information to the early warning system, government support; (5) culture-indigenous knowledge. However, since we are focused more on site-specific, community-level analysis, we considered only the social aspect due to the dataset’s availability, though it may also reflect economic or infrastructure factors. We only utilised six variables: population, elderly, children, gender ratio, poverty rate and built-up ratio, and all datasets are available at the village level. Other datasets, such as infrastructure (access and medical care ratio), capacity, economics and culture, were unavailable. Regarding capacity, we conducted in-depth interviews with local communities in the four villages on Bintan and the four islands in the Seribu Islands. However, we could not convert all interview results into ordinal data across all areas, as this would create a significant bias.
The demographic proxy indicators frequently used in earlier social vulnerability assessments inform the corresponding suggested SoVI. Below is a summary of the reasoning behind each indicator’s selection. During extreme weather events such as heat waves, floods, storms and wildfires, older adults often experience the highest rates of mortality and morbidity (Kriebel-Gasparro, 2022; Leyva et al., 2017). They are particularly vulnerable due to physiological changes, pre-existing medical conditions, reduced mobility and socioeconomic barriers (De Leo et al., 2026; Kriebel-Gasparro, 2022). These factors make them more susceptible to climate-related risks. Children are also particularly vulnerable to climate hazards, even at very low levels of exposure, and may experience significant neurological and physical consequences as a result (Zhong et al., 2021). They are often more adversely affected than other groups because they typically lack the resources to protect themselves and recover from disasters (Chalupka et al., 2020). The other factor is the gender ratio, which is defined as the proportion of women in the total population. Numerous studies indicate that women are disproportionately impacted by climate hazards, especially in developing countries (Awiti, 2022; Eastin, 2018; Garai, 2016). This is due to increased daily responsibilities related to food, water and energy, as well as higher health risks, greater mortality rates and more significant challenges to their livelihoods (Aipira et al., 2017; Awiti, 2022; Eastin, 2018; Wright et al., 2023). Factors such as social roles, economic dependence, limited access to resources, cultural norms and gender inequality contribute to women’s greater vulnerability to the effects of climate change (Abid et al., 2018; Md et al., 2022). Increased vulnerability to climate-related risks in society is often associated with higher levels of poverty (Canavire Bacarreza et al., 2024). Research conducted in Latin America, the Caribbean, Pakistan and Ecuador demonstrates that floods, drought and landslides disproportionately affect poor households. Additionally, multidimensional poverty serves as a particularly sensitive indicator of climate vulnerability (Ahmad et al., 2023; Canavire Bacarreza et al., 2024; Serio & Canavire Bacarreza, 2026).
In the beginning, there are two options for mapping units to generate the SoVI: administrative mapping units (village-based) and grid mapping units. However, the administrative mapping unit has limitations in identifying the actual coastal population within 1km of the coastline. The gridding mapping unit was created to convert social variables into gridded spatial data based on actual residential areas. Another challenge was the different units of measurement for each variable. So, we normalised the dataset to create all variables on the same scale, without units. In SoVI, there are various methods for assigning weights to each variable. Thus, we identified several options during the workshop. Since PCA is a commonly used method, it is less subjective and requires fewer resources to conduct the assessment, so we applied PCA to this SoVI.
2.3.2. Gridding system for sociodemographic data
2.3.2.1. Gridding the coastal area
The coastline data obtained from the Indonesian Geospatial Information Agency serves as the basis for creating the grid area. The initial step involves preparing the coastline data, including projection to the appropriate coordinate system. Subsequently, we use Geographic Information System (GIS) software to generate the grid area with available grid-creation tools. The cell size and grid orientation are determined based on the desired resolution along the coastline. This study uses a grid size of 500 m for Bintan and 250 m for the Seribu Islands. Visual validation is conducted to verify that the grid covers the desired area and aligns with the coastline.
2.3.2.2. Obtaining the detailed built-up region
“Open Buildings” is a dataset developed by Google under “Google Research”, which provides openly accessible information on buildings worldwide. This study’s version 3 (V3) dataset comprises 1.8 billion building detections, covering an inference area of 58 million km2 spanning regions across Africa, South Asia, Southeast Asia, Latin America and the Caribbean. The data is structured as polygons, with attributes including each polygon’s centroid, area and model-assigned confidence level. Data acquisition involved using Google Earth Engine to extract polygons from the required areas, then transferring the data to the cloud for subsequent use in the social vulnerability index.
2.3.2.3. Built-up area delineation into a grid system
In this process, the initial step is to prepare the building dataset and the grid area to be used. The building dataset should include precise polygonal information on the location and boundaries of each building. At the same time, the grid area should align with the analytical requirements, including cell size and appropriate coordinate projection. Subsequently, the overlay and cropping processes are conducted using GIS software between the building dataset and the grid area. This results in a new dataset containing information about buildings within the grid. Visual validation is performed to ensure that the extracted building polygons are consistent and within the grid.
2.3.2.4. Residential area delineation
Table 2 shows the statistical variation of house floor space in two pilot studies. According to a statistical agency report, the house floor in two pilot sites ranged from less than 19 m2 to higher than 150 m2, with the most dominant being 50–99 m2 on Bintan Island and 20–49 m2 on Seribu Island. Since the maximum floor area of the house is unclear, we defined the building as residential if the house’s floor area is less than 160 m2. So, if the building has an area of 160 m2 or more, we consider it a non-residential area (e.g., a school, factory, or other commercial area). This analysis considers only the spatial distribution of residential areas, converted to population distribution per grid.
| House floor space (m2) | Bintan (%) | Seribu Island (%) |
|---|---|---|
| ≤ 19 | 2 | 7 |
| 20–49 | 34 | 41 |
| 50–99 | 44 | 37 |
| 100–149 | 13 | 12 |
| >150 | 7 | 3 |
2.3.2.5. Conversion from a residential area to the population
To calculate the population in a single grid, we used Equation (1), where Bi is the number of residential building types and Pj is the number of people living in each house in each village. Since each village has population variation, we use the “spatial join” function in ArcGIS 10.8.2 in order to estimate the “Pj”
$$\mathit{Population} = \sum_{i=1}^{n} B_i \times P_j. \tag{1}$$
2.3.3. Normalisation dataset
In our dataset, the units for each variable are the same (i.e., the number of people). However, the scales differ; therefore, we normalised the dataset to a common scale (i.e., 0–1). Therefore, we employed Equation (2). Xn is the normalised value, Xmin is the minimum value and Xmax is the maximum value. This normalisation dataset is a standard procedure before applying the PCA and generating the spatial dataset (Ajtai et al., 2023):
$$X_n = \frac{X – X_{\min}}{X_{\max} – X_{\min}}. \tag{2}$$
2.3.4. Scoring by using Principal Component analysis
One of the most crucial phases in vulnerability analysis is determining variable weights, which establish each variable’s significance and impact on the SoVI, and influence the order of priorities. In addition, the lack of a standard weighting technique makes it challenging to choose the best strategy for indication weighting. Assigning equal weights or not assigning weights is a common approach to scoring, helping to streamline the process and reduce subjectivity and uncertainty in the findings. However, the effects and consequences of many indicators of social vulnerability vary (Ajtai et al., 2023; Setiawati et al., 2021). This component must be incorporated into the study to find the most pertinent indications and produce accurate results. As a result, a number of alternative scoring techniques were established and published in the research; the most common were statistical techniques, which, unlike participatory or expert-based techniques, provide objective outcomes (Ajtai et al., 2023). This study employed PCA to generate a vulnerability index and to score the variables. This approach is frequently employed in the literature and is used in many other domains for index construction and weighting.
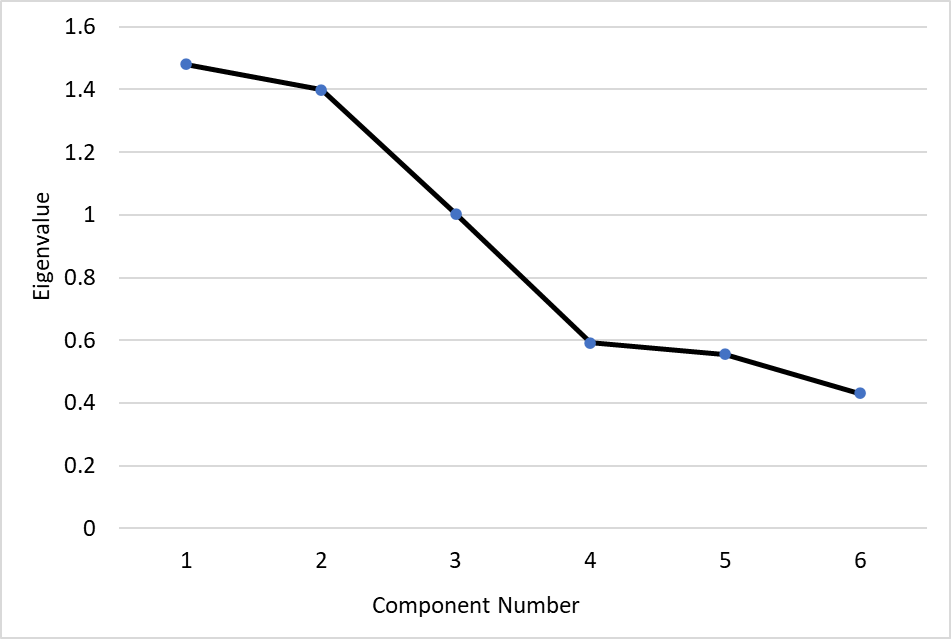
The PCA-based scoring process involves several key steps: normalisation, construction of the correlation matrix, extraction of significant components (specifically, those with eigenvalues greater than 1), calculation of factor loadings and estimation of the SoVI. Before applying Equations (3)–(5), it is essential to select a significant component with an eigenvalue greater than 1. Once we identify this component, we can estimate the weight or score for each component using Equation (3), which involves estimating the variance explained, where Wc represents the weight for each component. Next, we calculate each variable’s component weight (Wv) using Equation (4), based on the significant factor loadings. Here, Wv denotes the proportion of significant factor loadings (≥0.5) for each component. Finally, the SoVI is calculated as outlined in Equation (5), where n is the number of components and Xji represents the normalised variables. All SoVI calculations were conducted using ArcGIS 10.8.2 with the Spatial Analysis Toolbox.
$$W_c = \frac{\mathit{Variance\ Explained}}{\mathit{Total\ Variance\ Explained}} \tag{3}$$
$$W_v = \frac{\mathit{Significant\ Factor\ Loading}}{\mathit{Total\ Significant\ factor\ loading\ for\ each\ component}} \tag{4}$$
$$\begin{aligned}
\mathit{SoVI} &= \sum_{i=1}^{n} W_{c1} \cdot W_{v1} \cdot X_{n1} + \sum_{i=2}^{n} W_c \cdot W_v \cdot X_n \\
&\quad + \sum_{i=1}^{n} W_{cn} \cdot W_{vn} \cdot X_{in}.
\end{aligned} \tag{5}$$
| Component | Eigen value | Variance explained | Cumulative variance | Significant component | ||
|---|---|---|---|---|---|---|
| Standard Deviation | Variance explained | Cumulative Variance | ||||
| 1 | 1.4797 | 0.3649 | 0.3649 | 1.4797 | 0.3649 | 0.3649 |
| 2 | 1.3996 | 0.3265 | 0.6914 | 1.3996 | 0.3265 | 0.6914 |
| 3 | 1.0031 | 0.1677 | 0.8591 | 1.0031 | 0.1677 | 0.8591 |
| 4 | 0.59211 | 0.05843 | 0.91749 | |||
| 5 | 0.55561 | 0.05145 | 0.96894 | |||
| 6 | 0.43169 | 0.03106 | 1.00000 | |||
| Indicators | PC1 | PC2 | PC3 |
|---|---|---|---|
| Population | 0.5762 | 0.07954 | 0.309 |
| Women | 0.22871 | 0.61265 | 0.0805 |
| Elderly | 0.148369 | 0.51675 | 0.58248 |
| Children | 0.59883 | 0.1091 | 0.05365 |
| Poverty | 0.32427 | 0.2996 | 0.705724 |
| Built-up ratio | 0.36046 | 0.499645 | 0.24048 |
| Variables | Extracted component | Variable weight | Component weight | ||
|---|---|---|---|---|---|
| PC1 | PC2 | PC3 | |||
| Children | 0.59883 | 0.509 | 0.424 | ||
| Population density | 0.5762 | 0.491 | |||
| Women | 0.61265 | 0.54 | 0.38 | ||
| Elderly | 0.51675 | 0.46 | |||
| Poverty | 0.706 | 0.706 | 0.195 | ||
Furthermore, the variables were weighted within each PC based on squared factor loadings, adjusted to sum to 1.0 (Table 5). Additionally, the component weight was computed using Equation (3). In contrast, the variable weight was calculated using Equation (4). Within PC1, children have the highest weight, followed by population density, as they directly affect vulnerability and the coastal community’s resilience and adaptive capacity (Table 5). Meanwhile, in PC2, shared woman received the highest weight, followed by the elderly (Table 5). In PC3, poverty is considered only within the component (Table 5), since poor individuals face greater challenges in coping with and recovering from catastrophes. The PCA analysis shows that the socioeconomic component, which also exhibits high factor loadings, is notably significant in addressing vulnerability and accounts for the largest proportion of vulnerable populations. The socioeconomic dimension is therefore given the most weight, indicating that communities exposed to the coastal hazard will become even more prone if they lack the resources to deal with the disaster and have a high proportion of disadvantaged groups.
3.1. Social vulnerability index in Bintan Island
After calculating the weight for each component and variable, we integrated all significant normalised variables and multiplied each component’s and variable’s weights to obtain a single index, SoVI. Figure 4 represents each variable’s contributions to the index’s development. In general, there is variation among villages in the contribution of each variable to dominance. For instance, in Tanjung Ayun Sakti, Tanjung Pinang Timur, Tanjung Unggat, Kampung Baru and Kampung Bugis (which were mainly categorised as urban areas), age and gender (PC 1 and PC2) were the main contributors to vulnerability. Meanwhile, in Kawal, Kijang Kota, Malang Rapat, Penaga, Pengujan, Pengudang, Tanjung Uban Kota, Tanjung Uban Selatan, Teluk Bakau and Teluk Sasah (i.e., categorised as rural areas), poverty is the main contributor to vulnerability. This fact highlights that in rural areas, where job opportunities are limited, economic ability is the main factor in vulnerability, whereas in cities, where job opportunities are more abundant and access to information and health care is easier, age and gender are the most prominent factors in vulnerability.
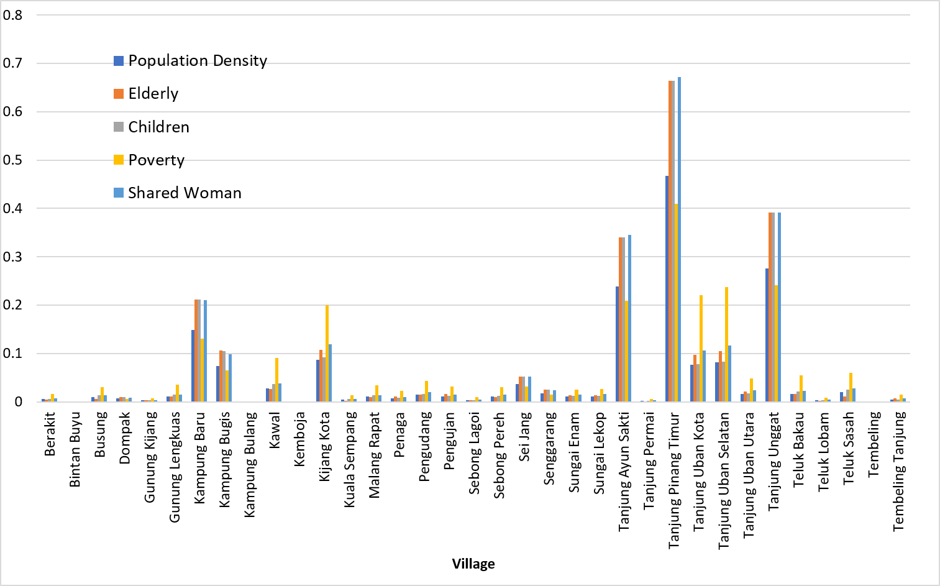
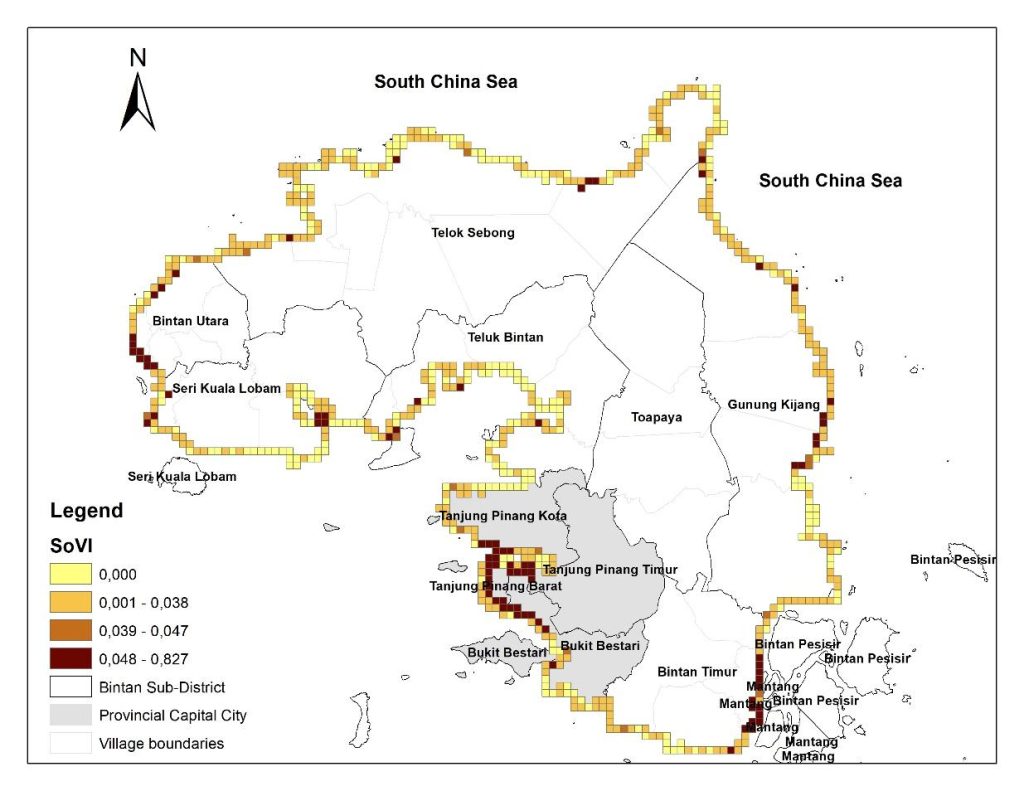
Furthermore, the spatial distribution of SoVI within the coastal area is described in Figure 5. The SoVI ranged from 0 to 0.827, with an average of 0.029. In this map, we classified SoVI into four classes: less Vulnerable (0), moderate (0.001–0.038), high (0.039–0.047) and very high (>0.047). The less vulnerable, moderate, high and very high accounted for 35%, 50%, 2% and 13% of the total coastline, respectively. Moreover, the very high vulnerability was mainly observed in the provincial capital city (grey polygon) of Tanjung Pinang City; meanwhile, in the rural areas, it was observed in Bintan Utara, Bintan Timur and Gunung Kijang Sub-district, as shown in Figures 4 and 5. As explained above, the main contributors to high vulnerability in the capital city were age and gender (Figure 4), while in the rural area, the poverty rate was the main contributor. The less vulnerable areas are mainly located in the Teluk Bintan and Seri Kuala Lobam sub-districts, while the moderate vulnerability level is mainly in the Gunung Kijang and Bintan Utara sub-districts. However, in some areas of Gunung Kijang Sub-district, very high vulnerability was identified, such as Kawal and Teluk Bakau Villages (Figure 5).
3.2. Social vulnerability index in Seribu Island
Figure 6 describes each variable’s contribution to vulnerability in the Seribu Islands. The result stated that the variation is relatively high. For instance, each variable has nearly equal contributions to vulnerability in the Kelapa Island village. Meanwhile, in Panggang and Pari Island, poverty predominantly contributes to vulnerability, followed by population density, children and women. Moreover, Pulau Harapan, Pulau Tidung and Pulang Untung Jawa show that population density and women are the most contributing factors, while poverty is the least affecting factor. Panggang Island has the highest vulnerability index among the five villages, followed by Kelapa Island.
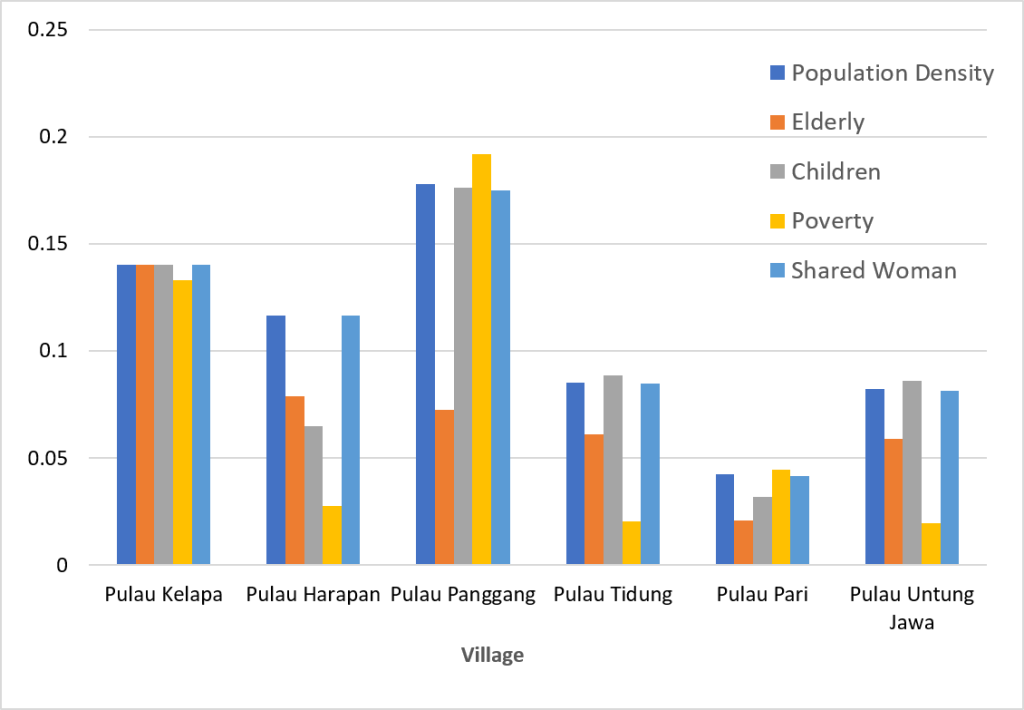
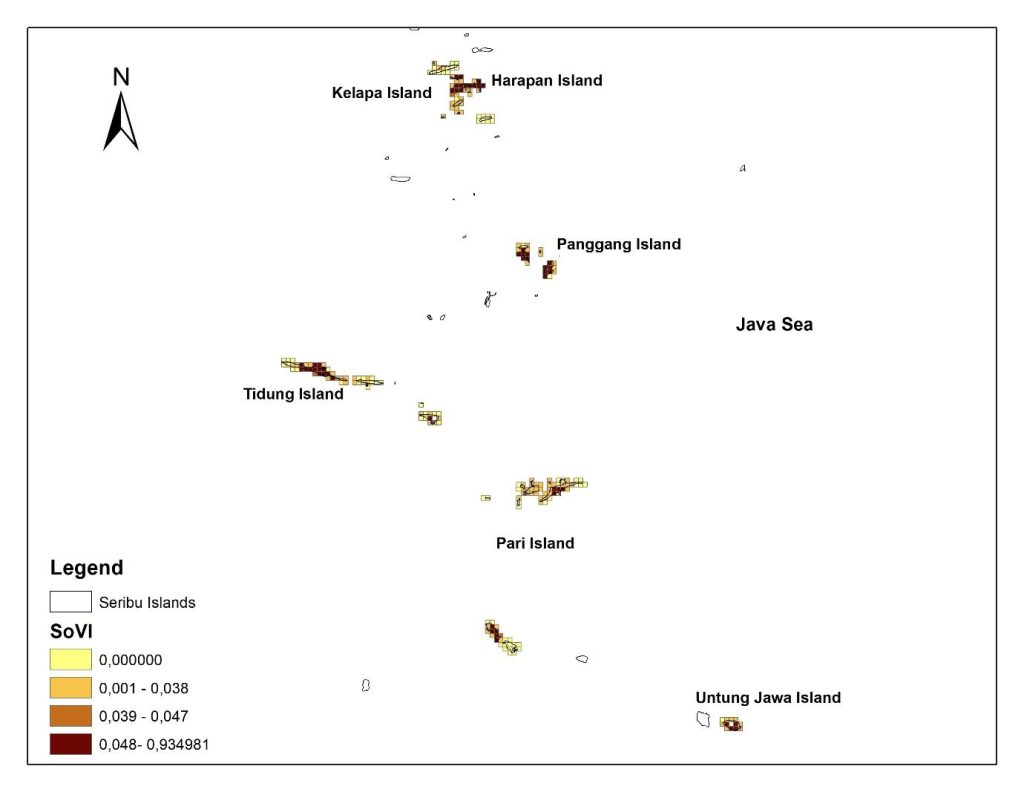
Figure 7 describes the spatial distribution of SoVI in Seribu Island. The index ranged from 0 to 0.934, with an average value of 0.054. We used the same range as Bintan to classify the index as follows: less Vulnerable (0), moderate (0.001–0.038), high (0.039–0.047) and very high (>0.047). The less vulnerable, moderate, high and very high categories accounted for 34%, 39%, 5% and 22%, respectively. As a result, nearly one-third of the Seribu Islands were categorised as having high and very high vulnerability indexes. The less vulnerable areas (in yellow) were inhabited islands or empty land. If we exclude the inhabited area, the high and very high vulnerability classes account for 40% of the total island. Also, among the five villages, Panggang Island Village is the most vulnerable, as the two inhabited islands, Pramuka and Panggang, were 100% categorised as very high vulnerability. The second rank is Kelapa Island Village (consisting of three islands), where nearly 100% were categorised as very high vulnerability.
4. DISCUSSION
Index-based approaches are practical and straightforward to use, offering flexibility in input selection aligned with the research’s objectives, local setting and accessibility (Ajtai et al., 2023). The method used can identify the most vulnerable area in terms of social context in the detailed geographic setting. For instance, we could identify which islands within the same village of Kelapa Island would be the most socially affected if a coastal hazard hit the area. On larger islands like Bintan, we could identify the exact area with a population and the number of people living in the coastal area, so this map could be used directly by policymakers/practitioners to deliver disaster assistance based on prioritisation. The gridding mapping unit is very useful for identifying detailed geographic features rather than administrative boundaries. The highest spatial resolution for administrative boundaries in Indonesia is at the village level. However, villages still have sub-village or neighbourhood associations in both mainland and archipelagic areas; a single village may span multiple islands, such as the Seribu Islands. In such a situation, the gridding mapping unit could help the government prioritise certain areas in greater detail, given its limited resources.
Our statistical results showed that only socioeconomic variables were considered in developing the index (Table 5), since the physical aspect had a low loading factor. This statement also aligns with previous research, including Wu (2021) and Ajtai et al. (2023), which indicates that age variables are among the most important factors in increasing vulnerability (Kirby et al., 2019; Setiawati et al., 2021). According to Table 5, children, population density and women have the highest weights and share nearly equal scores, followed by the elderly and the poor. Moreover, according to Figure 8, the greatest influence of SoVI was on children and women, each accounting for 23%, followed by population density (22%), the elderly (18%) and poverty (15%). Based on the residual variance among them, these two variables appear to have contributed about equally to the regional variance in the suggested demographic proxy-based SoVI. The significantly high women population contribution should not be construed as evidence that women are intrinsically more vulnerable than men. Instead, gender has been widely acknowledged as a contextual aspect of social vulnerability, reflecting disparities in decision-making ability, mobility, caregiving obligations, livelihood prospects and resource availability under certain institutional and socioeconomic contexts (Abid et al., 2018; Aipira et al., 2017; Awiti, 2022; Eastin, 2018; Md et al., 2022). Thus, in line with earlier GIS-based vulnerability evaluations, this study uses the women population as a demographic proxy indicator. The substantial contribution of children is also consistent with earlier research that found children to be among the most susceptible demographic groups due to their increased physical dependence, restricted mobility and need for adult assistance during and after disasters (Chalupka et al., 2020; Zhong et al., 2021).
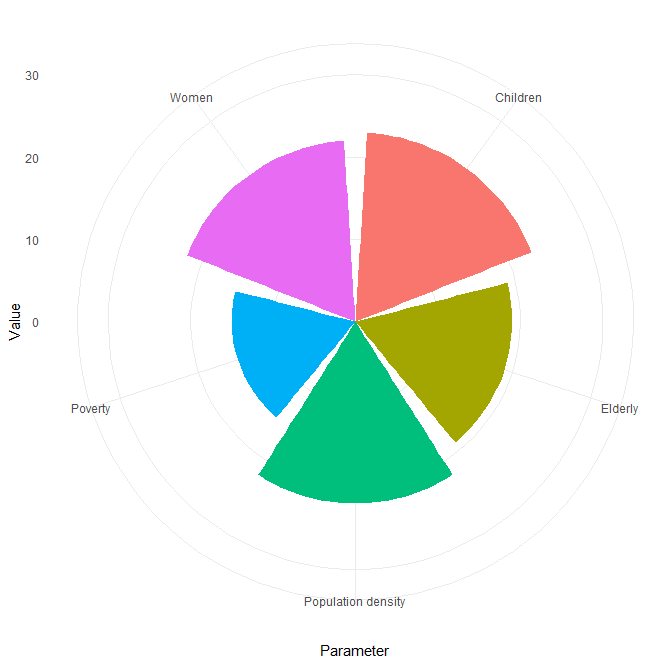
However, at the village level, the vulnerability contribution variables vary. In Bintan, the most contributing factors to vulnerability are age and gender, which are prevalent in urban areas, while in rural areas, poverty is prevalent. Meanwhile, on Seribu Island, each island has a unique pattern; however, in the big frame, the elderly factor is the least contributor, while in the area with the land legal conflict (i.e., Panggang Island, massive self-reclamation (Setiawati, Chatterjee et al., 2023) and Pari Island-legal conflict with private companies (World Rainforest Movement [WRM], 2022), poverty is the most contributor. Moreover, the Seribu Islands are more socially vulnerable than Bintan Island among the two pilot sites (Figures 5 and 7), with nearly 100% of villages experiencing very high levels of vulnerability. Moreover, the population density of the Seribu Islands is three times that of Bintan coastal land and the poverty rate is higher (i.e., the average poverty rate in Bintan is 25%, while in the Seribu Islands it is 40%).
While a consistent set of demographic proxy indicators is utilised to create the proposed SoVI, the contribution of each indicator varies significantly across different study areas. This regional diversity highlights that no single demographic factor consistently dominates social vulnerability. Instead, the primary causes of vulnerability are context-specific and depend on local socioeconomic and demographic characteristics. This study underscores the importance of grid-based demographic assessments, which can reveal localised patterns of susceptibility that may be overlooked in administrative-level analyses. Such detailed spatial data provide a solid basis for developing tailored adaptation and disaster risk reduction strategies, focused on the unique vulnerability characteristics of each region.
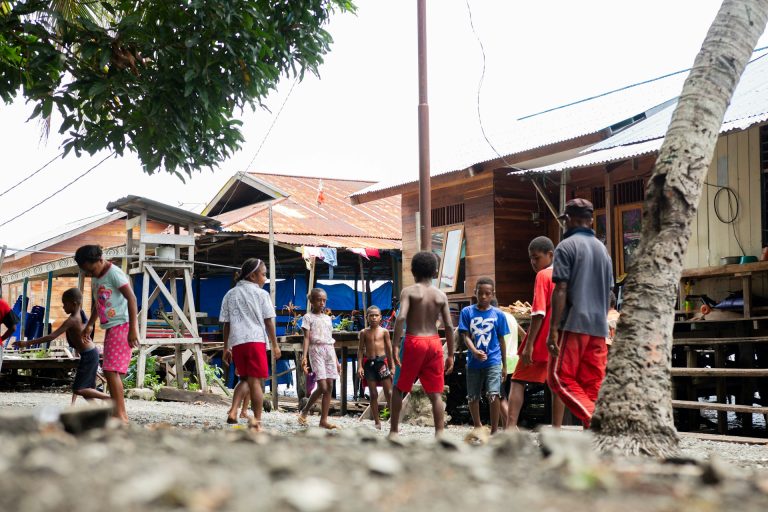
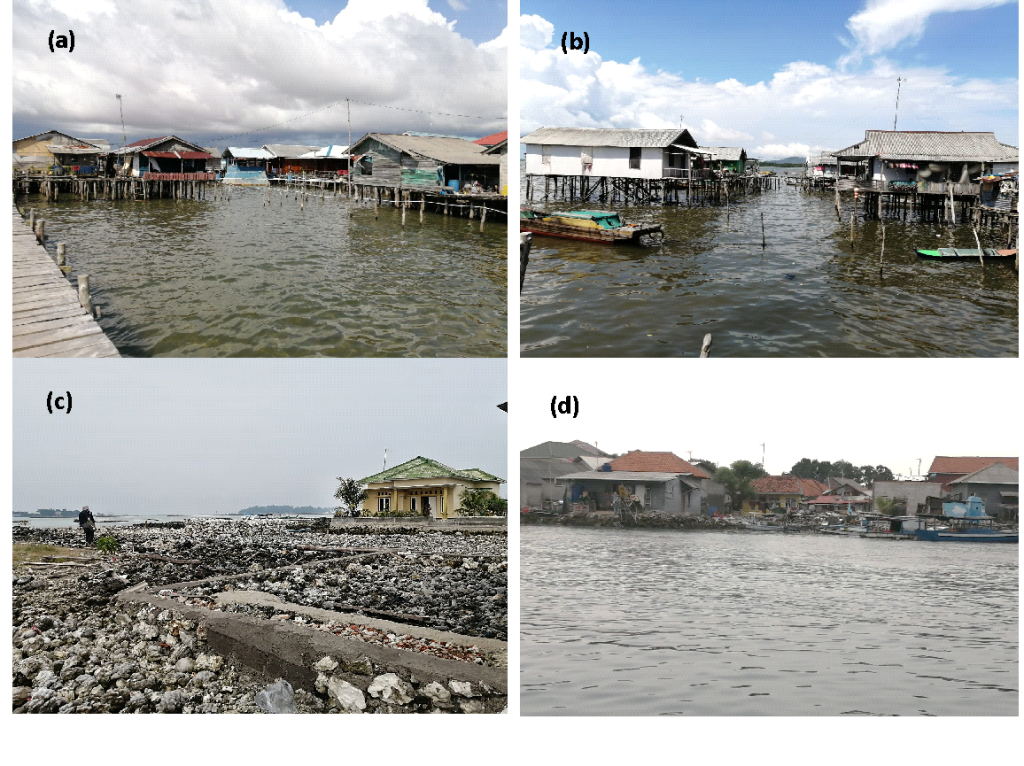
Despite statistical data indicating that the Seribu Islands are more socially vulnerable, in the cultural context, the rural area of Bintan is more vulnerable than the Seribu Islands. For instance, in Teluk Bakau and Kawal villages, many inhabitants still live at sea, using wood as the primary structural material (Figure 9) and they are the first people affected in the event of a disaster. As a result, the area, spatial distribution, hazard type and hazard features all affect social vulnerability, along with a particular group’s inherent attributes. These elements interplay to create complex interactions that must be carefully considered and examined. The resiliency of a community depends on several variables that vary over time and across communities and locations. For example, a component that greatly influences a particular group might not apply to another or have the same effect. As a result, vulnerability is a fluid concept and the methods for analysing it must be tailored to specific circumstances.
The development of multi-hazard management plans, including refining the spatial resolution of the social vulnerability map, necessitates the contextual adaptation of policies and mitigation methods, as well as a thorough understanding of the local environment and social context. Policymakers, urban planners, practitioners and local stakeholders are examples of multidisciplinary players that should be included in a comprehensive, integrated approach. Spatial planning can boost resilience, for example, provided it takes into account the potential effects of coastal hazard events (e.g., floods, storm surges, typhoons, wildfires and drought) and remains suitable and place-specific. Future coastal hazards may have varying effects depending on how built-up regions evolve and where they are distributed. Policies for site-specific adaptation and mitigation could be implemented in this situation by incorporating vulnerability assessments and hazard maps into the decision-making process. Setiawati et al. (2024) assessed the hazard index, calculated from seven physical parameters, for both Seribu Island and Bintan Island; the results revealed that the northern parts of Bintan Island and Seribu Island have the highest hazard index. According to Sovi, Kawal and Teluk Bakau villages in Bintan face very high vulnerability, while Kelapa, Tidung and Panggang villages in the Seribu Islands also show very high vulnerability. Combining the hazard index information with previous research by Setiawati et al. (2024) indicates that Kawal and Teluk Bakau villages in Bintan and Kelapa Village in the Seribu Islands require urgent attention, as they face the highest risk (i.e., the highest hazard index and SoVI). Therefore, this SoVi gridding system assists in formulating effective risk-reduction and sustained spatial strategies, which are essential to developing resilient communities. This means that government officials should focus on the most vulnerable regions, such as Teluk Bakau, Kawal and Kelapa Villages, prioritising activities and resources, assisting and implementing readiness measures to enhance society’s resilience.
Almost 99% of natural hazards in Indonesia are driven by hydrometeorological disasters, underscoring the critical need to build coastal resilience. This necessity is firmly embedded in Indonesia’s Climate Resilience Development Policy for 2025–2045 (Bappenas, 2025). Moreover, both pilot sites (Bintan and Seribu Islands) are making significant efforts by focusing on robust hard infrastructure to protect the coastline from severe abrasion and coastal flooding effectively. Simultaneously, they are implementing soft approaches that actively engage local communities to mitigate the impacts of these natural disasters (Setiawati et al., 2024). However, the effective use of natural capital to reduce the risk of coastal hazards and protect local communities has thus far been limited to Seribu Island; Bintan has yet to see these vital measures implemented. By employing the SoVI and the coastal hazard index developed by Setiawati et al. (2024), local governments can confidently identify and prioritise areas that urgently need attention to achieve coastal resilience. For example, most of the hard infrastructure projects were implemented on Panggang Island. At the same time, Kelapa Island, which faces the highest risk among the 11 inhabited islands in the Seribu Archipelago, has not received the same level of attention. By explaining this situation to local government officials during a workshop in May 2024, we can help them determine which villages should be prioritised in future development planning.
Kawal village serves as another urgent case. It stands out with the highest hazard index and SoVI. Despite its vulnerabilities, the area faces significant mangrove destruction, yet it has been designated as a special economic zone without regard for mangrove protection. According to Setiawati et al. (2026), the health of Kawal’s mangroves is alarmingly deteriorating. One research station reported only a single tree, with less than 20% canopy cover and no seedlings, along with the lowest measurements of tree height, diameter and above-ground biomass. This particular station is located within the special economic zone and none of the mangrove habitats are included in the master plan for mangrove protection (Setiawati et al., 2026). As a result, the local community in Kawal, which already faces a high risk of coastal hazards, will face serious challenges in the future due to the continued degradation of its natural resources. Currently, 55% of the coastline in Kawal is highly exposed, and if natural capital is not protected, this figure could rise to 90% (Setiawati et al., 2024). This situation means that the number of vulnerable communities in Kawal could increase by 64%.
The suggested method can strengthen existing policies and enhance community adaptability, drawing on expertise, knowledge and valuable insights from the past. Official and nonprofit organisations can then determine which related strategies and activities have historically been successful in a given neighbourhood. Additionally, the government should focus on the most urgent areas by implementing less expensive, resource-intensive non-structural mitigation strategies, such as educating the public through outreach efforts, preparing them for potential hazards, and encouraging greater community participation to better understand local and social circumstances.
In contrast, further cooperation is needed to encourage cooperation amongst all parties involved. In this regard, the public should actively participate in decision-making and assume greater responsibility. In addition, government officials should collaborate across tiers to improve the flow of information at local, regional and national levels. It is particularly crucial in Indonesia since a lack of links between decision-makers and the populace and a loss of trust in authority are significant issues. As a result, including communities in the decision-making process will raise public knowledge of coastal hazards and enhance interaction between the public and the government, fostering mutual trust between the two groups. This social vulnerability map visualises the spatial distribution of vulnerabilities within a given region. Its characteristics can shed light on why particular areas experience low resilience.
We recognise several limitations in this paper. The SoVI is designed to encompass multiple dimensions, each comprising a variable number of indicators. Previous studies by Cutter et al. (2003), Bucherie et al. (2022) and Ajtai et al. (2023) used 11, 15 and 14 indicators, respectively, whereas our study employed five. These earlier studies worked at an administrative map level with lower spatial resolution, which allowed for more comprehensive indicator lists. In contrast, our research aimed to downscale the SoVI using a more streamlined set of indicators at a finer resolution (in a gridded format). In small island districts, where a single village may encompass multiple islands or where villages are large and sparsely populated, providing SoVI to local policymakers may not effectively support their development planning. Therefore, we developed this gridded format to address the need for finer spatial resolution. In the future, it will be important to include a comprehensive set of indicators that encompass various aspects, such as vulnerable groups, socioeconomic conditions, education, health and coping capacity, in order to enhance the SoVI for remote small islands in a gridded format. In this research, we addressed only two main aspects of SoVI: vulnerable groups and socioeconomic factors, due to the unavailability of village-level data in other regions. Moreover, because we did not have the spatial distribution of the number of victims of climate hazards in these pilot sites, validating SoVi is difficult. Also, we did not perform a sensitivity analysis because we used the PCA approach, which allows us to determine indicator weights analytically based on the data’s variance structure rather than assigning them subjectively. As a result, this approach reduces the potential bias associated with equal-weight techniques commonly used in composite indexes.
5. CONCLUSION
This study aims to develop a social vulnerability (SoVI) map for coastal areas at two pilot sites, using a gridding system in a multi-hazard setting. Village-level datasets were utilised to generate the SoVI and five indicators were employed in this analysis that considered socioeconomic components. The results show that those five indicators could explain 85.9% of the total variance. It also revealed that the Seribu Islands are more socially vulnerable than the Bintan Islands, as most of their areas were categorised as very highly vulnerable. Moreover, the SoVI pattern is different between the two pilot sites. In Bintan, sociodemographic indicators dominate vulnerability in urban areas, while economic indicators are the primary indicators of vulnerability in rural areas. In the Seribu Islands, the economic indicator was the primary factor in the densest village (Panggang Island) and in the case of conflicting land ownership (Pari Island). In contrast, in others, the sociodemographic factor remained the dominant one. Measures should prioritise detailed spatial planning and strengthen vulnerable communities to address the multi-hazards. Therefore, a gridding system was created. GIS technology provides spatial information on SoVI, enabling policymakers to make informed decisions. This vulnerability index methodology can be copied in various places. However, indicators should be selected based on the local circumstances and setting.
6. DECLARATION OF COMPETING INTEREST
The authors declare that they have no known competing financial interests or personal relationships that could have appeared to influence the work reported in this paper.
7. ACKNOWLEDGMENT
We want to thank the Asia-Pacific Network (APN) for Global Change Research for funding the research under the CRRP2022-06MY-Muslim project.
8. AUTHOR CONTRIBUTION
Martiwi Diah Setiawati: Conceptualisation, Data curation, Formal analysis, Funding acquisition, Investigation, Methodology, Supervision, Validation, Visualisation, Writing—original draft, Writing—review and editing. Muhammad Rizki Nandika: Investigation, Conceptualisation, Formal analysis, Writing—Original Draft, Methodology. Aulia Oktaviani: Investigation, Validation, Project administration. Bayu Prayudha: Conceptualisation, Investigation, supervision, project administration. Nuraini Rahma Hanifa: Conceptualisation, Writing—review and editing, project administration. Aidy M Muslim: Conceptualisation, project administration. Uday Chatterjee: Conceptualisation. Tsuyoshi Eguchi: Conceptualisation. Sam Wouthuyzen: Conceptualisation. Novi Susetyo Adi: Conceptualisation, Writing—review and editing, Project administration. Indarto Happy Supriyadi: Investigation, validation. Yudha Setiawan Djamil: Conceptualisation. Siti Sulha: Investigation, Validation, Project administration. Jeverson Renyaan: Conceptualisation, Investigation, Validation, Project administration. La Ode Alifatri: Conceptualisation, Investigation, Validation. Trinugroho: Investigation, Validation, project administration. Achmad Fakhrus Shomim: Investigation, Validation, Project administration. Tri Atmaja: abstract and highlight writing, editing and formatting.
9. DECLARATION OF GENERATIVE AI AND AI-ASSISTED TECHNOLOGIES IN THE WRITING PROCESS
During the preparation of this work, the author(s) used [Grammarly] to [improve the language and readability]. After using this tool, the author(s) reviewed and edited the content as needed and takes full responsibility for the publication’s content.