Impact of Water Management on Methane and Nitrous Oxide Emission Dynamics in Asian Paddy Ecosystems
HIGHLIGHTS
- AWD is a promising strategy to mitigate GHG emissions while sustaining grain yield.
- AWD suppressed CH4 emissions by 32% to 43%.
- AWD increased N2O emissions by 7.4% to 23.4%.
- Application of rice straw increased CH4 emissions via ebullition.
1. INTRODUCTION
More than three billion people worldwide regularly consume rice (Maclean et al., 2002). Particularly in Asia, human civilisations have developed around the cultivation of rice paddies, making it the most socioeconomical and culturally influenced crop. However, paddy ecosystems contribute significantly to GHG emissions, with an estimated 47% of total anthropogenic methane (CH4) (Smith et al., 2007). In addition, 11% of nitrous Oxide (N2O) emissions come from rice fields (Zhang et al., 2021). Paddy ecosystems contribute to approximately 20% of human-induced CH4 emissions within agricultural systems. While the growing population demands expansion of rice production, it inadvertently increases GHG emissions. Nearly 75% of rice is produced under continuously flooded conditions (Van der Hoek et al., 2001) and conventional farmers historically believe that maintaining continuously flooded conditions helps increase soil carbon and suppress soil-borne diseases and weeds (FAO, 2016). Due to an increase in water usage linked with a decrease in availability, paddy cultivation in Asia is likely to suffer from a lack of water in the future, which may challenge the strong hydrological coexistence of Asian paddy ecosystems. Due to the increasing demand for rice productivity under the intense pressure on water availability, the alternative wetting and draining (AWD) method has emerged as a novel strategy for the optimal use of fresh water (Lampayan et al., 2004). The AWD is a water-saving technique in which irrigation water is supplied to the field and then allowed to subside 15 cm below the soil surface through evapotranspiration and percolation, followed by reflooding. In traditional rice cultivation, continuous flooding is used as a water regime, favouring anaerobic conditions for methanogen-originated CH4 emissions (Qiu, 2009). In contrast, draining-induced aeration of paddy landscapes can effectively reduce CH4 emissions (Smith & Conen, 2006; Yan et al., 2003).
The produced gases should migrate through soil and be emitted to the atmosphere by diffusion, which can be explained by soil-gas diffusivity, Dp/Do (where Dp and Do are gas diffusion coefficients in soil and free air, respectively). Soil-gas diffusivity, in essence, is a function of soil air content and tortuosity of the functional soil-air phase, and becomes a dominant mechanism of gas emission under drained conditions. Under submerged conditions, however, ebullition (i.e., emission through bubble form) and transport through plant aerenchyma play a key role in paddy emissions. Both diffusive soil-gas emissions under drained conditions and ebullition under full flood conditions are sparsely investigated in Asian paddy ecosystems.
This study paves the way for a regional research platform to investigate the feasibility of AWD as an emerging water management practice to reduce GHG emissions without compromising paddy yield. This study further provides policymakers with scientific insight on optimal water management in Asian paddy ecosystems that maintain crop productivity while maintaining a healthy regional environment.
2. METHODOLOGY
2.1. Experimental sites
Field experiments were conducted at three experimental paddy sites in three Asian countries: Sri Lanka, India and Japan. The locations were selected as they contain paddy areas where farmers have been practising intensive farming and have kept records on water management and fertiliser inputs.
The Sri Lankan field study was conducted at an experimental paddy site (7°31′32″ N, 80°26′20″ E) that belongs to the Rice Research Development Institute (RRDI), Bathalagoda, Sri Lanka. The experimental site was located at 161 m above mean sea level. The climate in the area is tropical monsoon, while the mean annual temperature is 27.41 °C, and the mean annual precipitation is 1648.97 mm. The soil texture is loamy sand with 9.75% clay, 5.3% silt and 85.0% sand content. The selected paddy site in India was in the Kaveri River Basin at College of Agriculture, V. C. Farm, Mandya, Karnataka, (12°34′22.8″ N 76°49′34″ E), which is located 695 m above mean seas level. The region’s mean annual temperature and precipitation are 27.39 °C and 139.28 mm, respectively. The soil at the experimental site was texturally characterised as a sandy loam with 12.2% clay, 19.47% silt and 68.32% sand content. The Japanese field study was conducted at a rice paddy field of NARO in Tsukubamirai City, Ibaraki Prefecture, Japan (36°00′67″ N 140°02′21″ E) located around 25 m above mean sea level, where mean annual temperature and precipitation in vegetative, reproductive and ripening growth stages are recorded as 21.5, 25.3, 22.7 °C and 283, 67, and 333 mm, respectively. The soil was characterised as sandy clay loam with 25% clay, 23% silt, 52% sand and the average plough layer thickness was 18.1 cm. Physicochemical properties of surface soil are as follows: C: 2.15%, N: 0.19%, pH (H2O): 6.8, CEC: 17.5 cmol (+)/kg, and dithionite-citrate extractable iron: 12.8 g/kg. The average bulk density ranged between 1.22 and 1.3 g cm−3 in Sri Lankan, Indian and Japanese soils.
Notably, the soil-specific application of additional soil amendments, depending on soil quality, differed among the three sites. For example, an episode of vermicompost was applied in the Indian sites while the application of straw was practised at the Japanese site in the experimental stage, while Sri Lankan sites practised regular urea application. We did not alter the country-specific application and sequence of fertiliser and amendments to investigate the effect of water management. Notably, the Japanese paddy sites were only used to investigate methane ebullition under fully flooded conditions as the mid-season draining was not allowed to practice following strict limitations on post-Covid water management.
2.2. Experimental design
Experiments at the RRDI in Bathalagoda, Sri Lanka were conducted in a size 13 m × 7 m experimental site. Field plots representing with plants (P) and without plants (NP), completely flooded (CD) and AWD, each laid out in a randomised block design (RBD) with three replications. The same experimental sites were used during wet (WS) and dry (DS) seasons. Prior to transplant, the entire field was ploughed, puddled to the top 20 cm of soil and levelled. A popular midterm rice variety, BG 300, was used in with-plant (P) plots. Twelve days after seedlings emerged from rice seeds produced in a nursery, they were pulled and planted on puddled and levelled fields. Manual transplantation was carried out to preserve regular spacing between plants in straight rows.
In completely flooded (CF) plots, a water level 3 to 5 cm above the soil surface was maintained throughout the season. The AWD plots involved flooding whenever the surface water level dropped 15 cm below the soil. A polythene sheet (250 µm) was placed around the plot beds under completely flooded conditions to prevent seepage. All treatments received an equal amount of fertiliser according to traditional agricultural methods. Figure 1 shows the cultivation practice calendars and the detailed timing for both seasons in Bathalagoda, Sri Lanka.
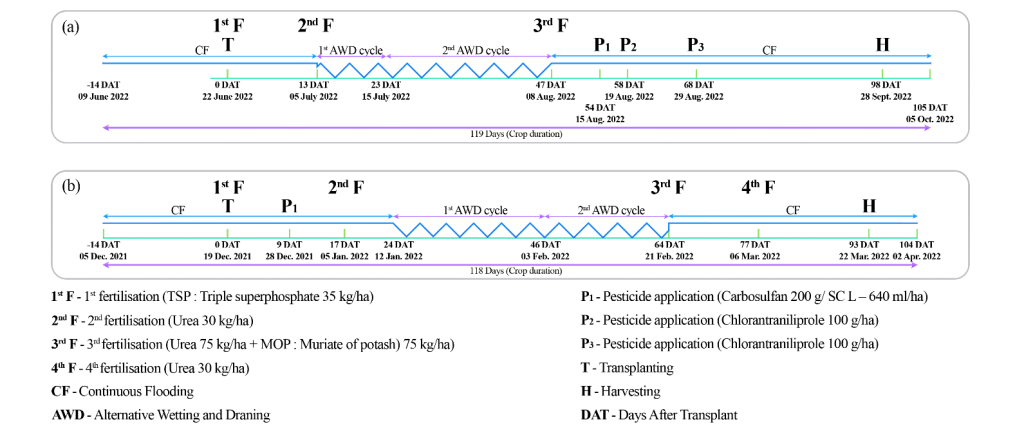
All plots were continuously flooded during the wet season from 0 to 12 days after transplant (DAT) and then allowed to drain at 77 DAT in preparation for harvest. In the dry season, the field was allowed to drain starting at 77 DAT, the same as the wet season, and was kept completely flooded from the beginning to 23 DAT. The AWD cycle initiated and continued at 24 and 13 DAT in the dry and wet seasons, respectively, while the plots were kept entirely submerged during the flowering period of the rice growth cycle. Maintaining AWD conditions was difficult due to the elevated water table with the onset of the southwest monsoon during the wet season, although two AWD periods could be maintained. Due to a nutrient issue, there was an additional (fourth) fertiliser treatment event during the dry season, which was not uncommon in the selected area.
Similar to Sri Lankan practice, Indian sites maintained a completely randomised design (CRD) with three replications with 3 m × 3 m plot sizes for wet and dry seasons. However, due to the lack of fertility in paddy soil, additional amendments (e.g., vermicompost) were added as a common practice in this area. A recommended fertiliser dose was applied, including basal Single Super Phosphate (SSP) and Muriate of Potash (MOP), as well as split urea doses during active tillering and flowering. A 10 tonne/ha application of vermicompost was made to the treatment-designated plot 15 days before the plots were flooded for puddling. The 21-day-old paddy seedlings were transplanted, two per hill, at 15 to 20 cm spacing. The treatment details for the Indian field experiment were as follows (see Table 1).
| Wet Season (WS) | Dry Season (DS) | ||
|---|---|---|---|
| T1 | CF + without plants + control | T1 | Without plants + control |
| T2 | CF + without plants + RDF | T2 | Without plants + RDF |
| T3 | CF + without plants + RDF+ VC | T3 | Without plants + RDF+ vermicompost |
| T4 | CF + with plants + control | T4 | With plants + control |
| T5 | CF + with plants + RDF | T5 | With plants + RDF |
| T6 | CF + with plants + RDF+ VC | T6 | With plants + RDF+ vermicompost |
| T7 | AWD + without plants + control | ||
| T8 | AWD + without plants + RDF | ||
| T9 | AWD + without plants + RDF+ VC | ||
| T10 | AWD + with plants + control | ||
| T11 | AWD + with plants + RDF | ||
| T12 | AWD + with plants + RDF+ VC | ||
| RDF: Recommended Dose of Fertiliser, VC: Vermicompost. | |||
Figure 2 shows the cultivation practice calendars in Mandya, India with detailed times for both seasons.
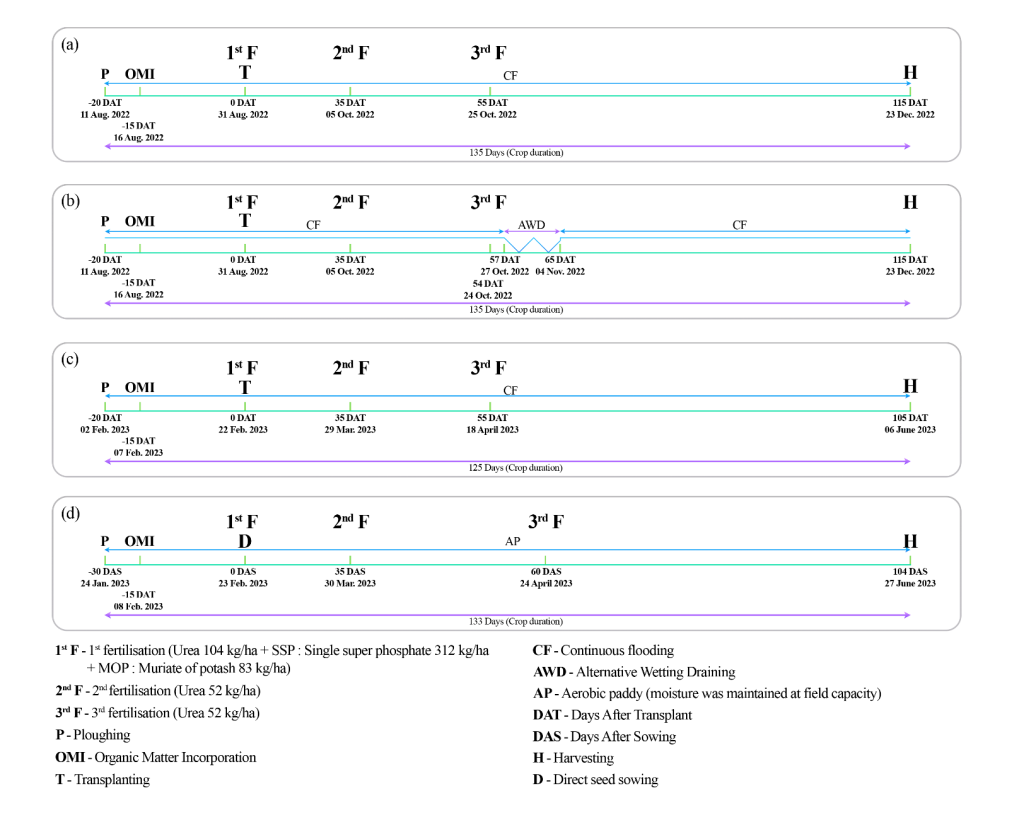
In India, CF and AWD plots were maintained in the wet season. On the 57 DAT, water was drained for eight days until the water level reached 15 cm in the AWD plots and then reflooded again until the end of the cropping period. During the dry season, aerobic plots replaced the AWD plots to maintain the moisture level at field capacity.
In Japan, each plot size was 0.3 m × 0.6 m, and various treatments were adopted to include with and without rice plants, with and without straw application (P_S: plots with plant and straw, P_NS: plots with plant and without straw, NP_S: plots without plant with straw, NP_NS: plots without plant and straw). All experiments were triplicated. A leading cultivar in Japan, Oryza sativa L. cv. Koshihikari was used for the plots with rice plants (in total, six plots), and four rice hills (three rice plants for one hill) were transplanted at a spacing of 15 cm × 30 cm. The paddy field was continuously flooded from transplanting until the middle of the grain-filling stage, and for the plots with rice straw application, the 100 g of dried straw cut into around 10 cm was mixed into the plots. Figure 3 shows the cropping details and timing for rice cultivation in Tsukubamirai/Japan.

2.3. Measurements and calculations
2.3.1. Field measurements
Gas samples were collected to evaluate CH4 and N2O for daily and seasonal variations using a closed chamber technique. Following the recommendations provided by Minamikawa et al. (2015), rectangular chambers were employed so that the area it covers is equal to that occupied by ten rice plants at the Sri Lankan paddy site. To maintain roughly the same head space between the plant and the top of the chamber and prevent the suppression of rice development, chambers 35 cm wide and 75 cm length were constructed using acrylic and transparent polythene in three different height stages (250 cm, 500 cm and 950 cm). A small, battery-powered fan was fixed inside the chamber’s top to mix the inside gases and maintain a constant target gas concentration (Prinn et al., 1994). Additionally, the chamber had a separate gas sampling port, vent hole, and rubber stopper to avoid any drastic inside pressure changes that the chamber deployment could cause. Throughout the entire paddy season, chamber bases were firmly pressed to the soil at each experimental plot at a depth of around 5 to 10 cm, and gas samples were collected by placing the chamber on the base and ensuring a gas-tight closure using a water seal. In temperate regions of Asia, Minamikawa et al. (2012) suggested that daily mean CH4 flow measurements be carried out once per day during mid-morning, roughly 10:00 (09:00–11:00) since these measurements resulted in acceptable estimates (i.e., 10%). Emissions during this period are assumed to be typical of the daily average emission rate, which is then used to calculate the total seasonal emissions (Cai et al., 1997; Zou et al., 2005). In Sri Lanka, gas samples were collected during 9–11 am local time at 0, 15, and 30 min intervals with a 60 ml syringe fitted with a stopcock valve and stored in 6 ml evacuated glass vials.
Chambers of similar dimensions were used in the Indian experimental sites. Gas samples were drawn from the chambers in the same manner as described above, using a 50 ml syringe. Gas samples were transferred to vacuum-sealed 135 ml vials with rubber stoppers, and analyses were completed within three days of sampling.
In both Sri Lankan and Indian experimental sites, weekly gas sampling was done, along with additional measurements regarding the N fertiliser event and the transition of the AWD season. Water depth inside the base and base height above the soil surface were measured on each gas sampling day. Piezometers installed at each plot were used to guarantee the water depth using the AWD approach. Soil redox potential was recorded in Sri Lanka and India using a portable battery-operated Eh meter by inserting the electrode into the soil under investigation to a root-zone depth of 5 cm. Grain yield was measured at the harvest stage at each plot under both treatments. The concentration measurements of CH4 and N2O were completed using a gas chromatograph equipped with a thermal conductivity detector (TCD) using helium as the carrier gas. The Indian team calculated fluxes as per the standardised protocols (Goldenfum, 2009; Venterea, 2010). Further, Ly et al. (2013) noted that cumulative emissions were computed by integrating the area under the curve of adjacent measurement points.
In the Japanese experimental site, seasonal measurements were conducted weekly for seasonal variation and a campaign was conducted for diurnal variation only for CH4. Measurements were taken four times each during the panicle heading and formation stages and seven times during the ripening stage. Measurements of CH4 emissions were performed during the hours of 7:00 am to 11:00 am local time. Chambers (30 cm × 60 cm × 60 cm) were placed on each plot and an additional acrylic frame with 60 cm height was placed below the chamber to extend the chamber height after the middle of July to accommodate the growth of rice plants.
The CH4 concentration inside the chamber was continuously measured by using a high-precision portable gas analyser (G4301, Picarro Inc, Santa Clara, CA, USA) at intervals of 0.9 s. When ebullition did not occur to get a steady linear increase in CH4 concentration in the chamber, the monitoring period was around 6 min, resulting in a continuous linear increase in the chamber’s CH4 content. The monitoring period was approximately 10–15 min when frequent ebullitions were noticed. Sensors (TEROS-12, METER) were inserted at 5 cm and 10 cm soil depth to measure soil temperature and volumetric water content where ±3 cm of the inserted depths were contained in the measured region. All data were recorded using a logger (ZL6 Basic, METER) at 1 h intervals. After monitoring, intact soil core samples were extracted from each plot at 5 and 10 cm depths. Sensor calibration for volumetric water content was done using the volumetric water content determined by oven-drying the intact soil cores. Ebullition and CH4 fluxes through the rice plants were separately computed in accordance with Kajiura and Tokida (2021). In a kernel density distribution of the flux, the lowest flux showing local maxima was considered as the diffusive CH4 flux (i.e., plant-mediated flux and molecular diffusion of dissolved CH4 across the water–atmosphere interface). The difference between the total and plant-mediated CH4 fluxes was then used to compute the ebullition CH4 flux. It should be emphasised that due to the poor solubility of the CH4, the diffusive flow of dissolved CH4 was neglected.
2.3.2. Statistical analysis
All statistical analyses were performed using Minitab®; 17.1.0. One-way analysis of variance (ANOVA) and paired t-test were used to analyse statistical significance in seasonal emissions and grain yield, respectively. To test differences among treatments, Tukey’s HSD (Honest Significant Difference) test was performed with a significance level of 0.05.
3. RESULTS AND DISCUSSION
3.1. Field experiments
3.1.1. Seasonal emissions in Sri Lanka
The seasonal CH4 and N2O emissions from the Bathelegoda, Sri Lanka experimental site under both CF and AWD, with and without plants, are shown in Figure 4. Note that they are shown for both the wet and dry seasons.
Figures 4a and 5a indicate the seasonal dynamics of CH4, demonstrating the complex interplay between methane generation, oxidation and transportation. Due to the constant anaerobic conditions present in CF/P as opposed to the intermittent aeration in AWD/P, emissions rates of CF/P were higher than those of AWD/P, as was expected. The large error bars show the spatial variability in the fluxes. Throughout the whole season, as discussed by Pandey et al. (2014) and Oo et al. (2018), three peaks were noticed under with-plant (P) treatments (Figure 4a). Generally, high CH4 flux is caused by the favourable oxygen status and C availability in the paddy soil due to the release of more plant-borne carbon sources, such as root exudation continuing at high levels or decaying roots. Soil-redox (Eh) ranged from −100 to −200 mV during the CF in WS, as also evidenced by Yagi and Minami (1990) and Wang et al. (2017), who mentioned that the production of CH4 starts at a redox potential of −150 to −160 mV. Lower CH4 emissions under drainage have been consistently reported in many past studies, indicating a negative correlation between CH4 emission and soil Eh (Corton et al., 2000; Wassmann & Aulakh, 2000). In this study, a reduction in CH4 emission was observed under enhanced redox conditions in AWD, which ranged between (−125) mV – (+510) mV. Decrement of CH4 emissions from AWD/P was caused by less developed aerenchyma of rice plants that have previously undergone AWD treatment, as compared to those under anaerobic conditions permanently.
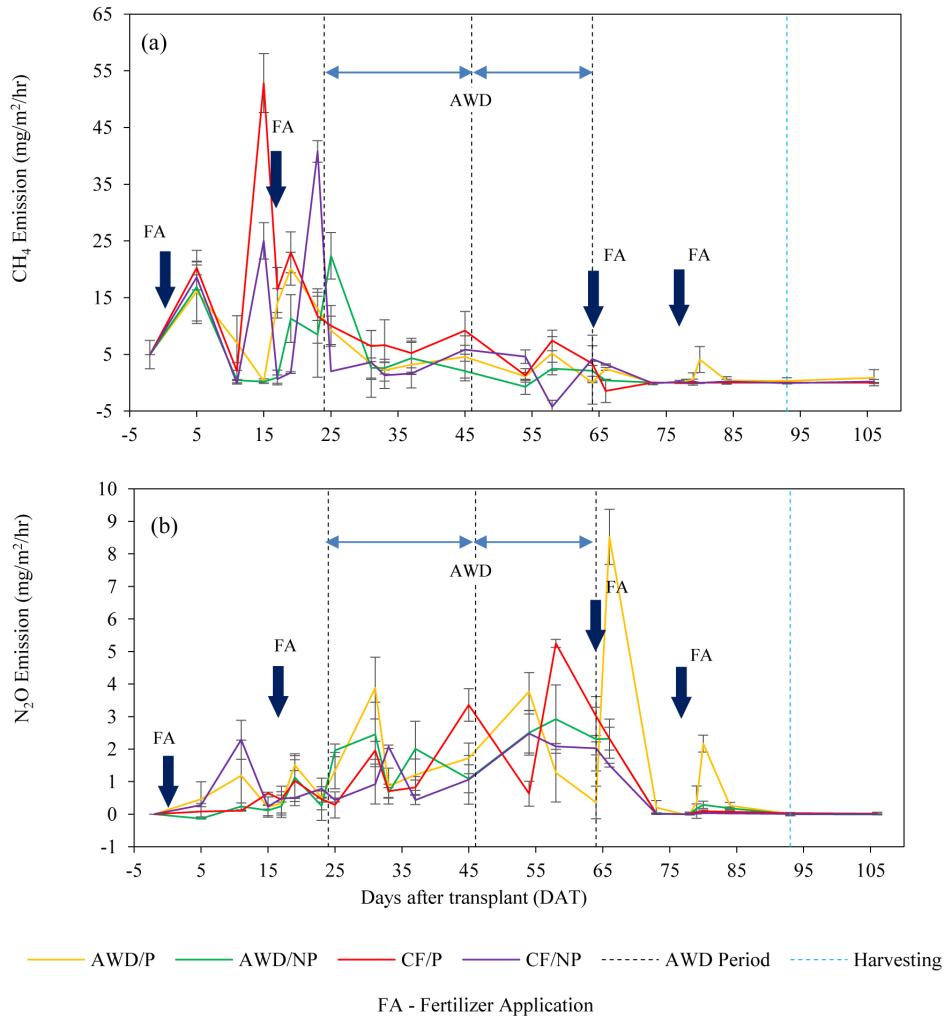
With the transition from aerobic to anaerobic conditions due to the AWD episode ceasing, a rapid increment of CH4 emission was detected under the AWD/P combination. Generally, in paddy systems, transportation and atmospheric emission of methane occurs mainly via three channels: diffusion of dissolved gas through water-air and soil-water interfaces, ebullition as gas bubbles, and plant transport (i.e., by diffusion and conversion to gaseous CH4 in the aerenchyma and cortex) and subsequent release to the atmosphere (Davamani et al., 2020; Le Mer & Roger, 2001). Literature studies have concluded that more than 90% of CH4 is emitted through rice plants under normal CF conditions (Xie & Li, 2002). In comparison, 70.3% of emissions occurred through the plants during the wet season, while 29.6% occurred through the soil surface (Figure 1a), suggesting that soil-dominant diffusive emissions are instrumental in alternative wetting and drying periods. Both CF/NP and AWD/NP treatments showed very low emissions, around 15%, in comparison to CF/P and AWD/P (see Table 2), thus corroborating the literature observations. This is primarily due to the fact that methane tends to oxidise in the suboxic zone (i.e., at the interface between oxic and anoxic regimes) where the concentration gradients of methane and oxygen essentially overlap, for instance at the surface of flooded rice soils and in the rhizosphere of rice plants. Therefore, as reported in many studies (Conrad & Rothfuss, 1991; Inubushi et al., 1992), 65–80% of generated methane becomes oxidised en route in NP plots.
| Seasonal CH4a emission (kg/ha) | Seasonal N2O emission (kg/ha) | Grain yield (Mg/ha) | |
|---|---|---|---|
| Wet season | |||
| CF/P | 517.0 a | 1.24 | 3.71 |
| AWD/P | 349.6 ab | 1.34 | 3.79 |
| CF/NP | 57.0 b | 1.03 | |
| AWD/NP | 36.1 b | 1.19 | |
| Dry season | |||
| CF/P | 125.0 A | 20.9 | 3.34 |
| AWD/P | 71.2 AB | 27.3 | 3.12 |
| CF/NP | 74.6 AB | 13.7 | |
| AWD/NP | 48.4 B | 18.0 | |
| Source of variation treatment | p value | ||
| Wet Season | ** | 0.837 | 0.851 |
| Dry Season | * | 0.117 | 0.844 |
| Notes: CF/P, continuous flooding with plants; AWD/P, alternative wetting and draining with plants; CF/NP, continuous flooding without plants; AWD/NP, alternative wetting and draining without plants. The asterisks * and ** represent significant at p < 0.1 and p < 0.05, respectively. | |||
| The letters indicate significant difference at the 5% level (lowercase letters) and 10% level (uppercase letters). | |||
In contrast to the wet season, CH4 flux shows high emissions at the beginning of the dry season, as indicated by Figure 5a, and gradually declined to approximately zero towards the end due to the limited presence of soil organic matter with the reduction of carbon supply because of the ageing of plants. Low Eh values in the field, ranging from −150 mV to −200 mV, have enhanced CH4 formation by methanogenic bacteria under flooded conditions while at −75 mV to +550 mV under drained conditions. Contrary to Li et al. (2009a,b), CH4 emissions under AWD treatments were not observed to be zero due to the emission of trapped methane in soil pores (Bubier & Moore, 1994).
Recognisable N2O emissions were not detected during the wet season (Figure 4b) and the rice growing period fluctuated near zero. High emissions were detected for all four treatments at the start of the wet season as a result of the unexpected drying situation at the field (water level = −15 cm below the surface).
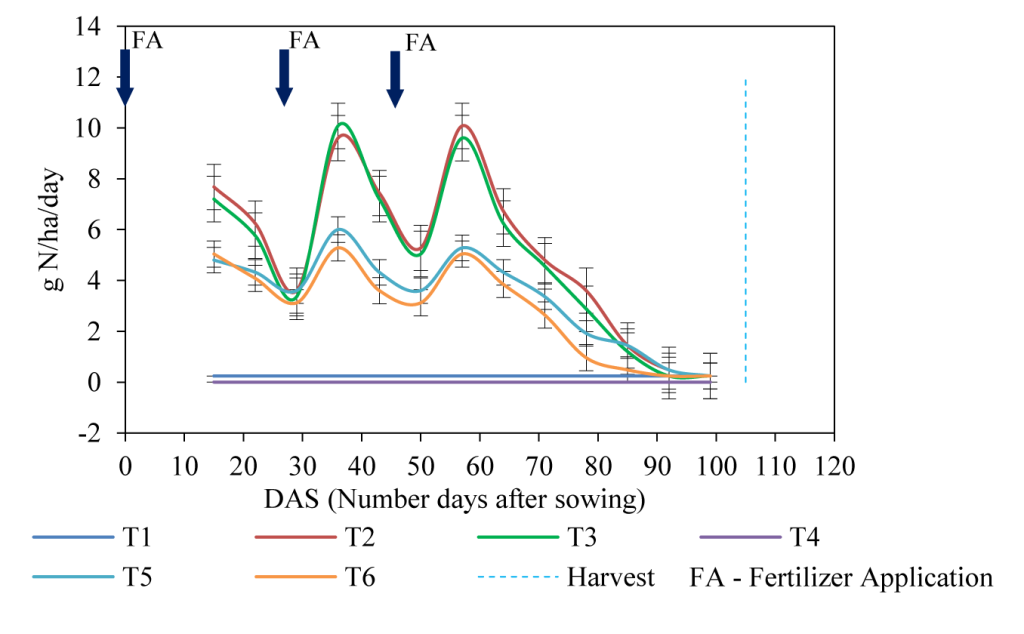
Seasonal N2O emission increased in the dry season compared with the wet season in numerals (Figure 5b) and is strongly influenced by water regime and fertilisation (Aung et al., 2018). However, no significant difference (p > 0.05) in cumulative emission for the dry season was observed among the treatments. Besides, N2O emission during the dry season (Figure 5b) varies throughout the season in such a way that shows a gradual increment, then peaking at the reproductive phase and followed by a gradual decrease to zero emission. However, a considerable increment of N2O emission could be observed after first flood irrigation and puddling with the application of basal fertiliser to increase soil biological fertility and concentration of mineral elements and lack nutrients prior to planting.
After the first peak, emissions fluctuated near zero and the second fertilisation was done at 17 DAT under flooded conditions. A temporal peak of N2O emission was observed at 20 DAT, although it lasted only a few days. It is worth noting that although nitrification and denitrification processes are influenced by soil moisture (Davidson et al., 1986), N2O production is suppressed under very high moisture content in soil (Tirol-Padre et al., 2017). In this study, continuously irrigated rice paddies have shown quite small N2O emissions than that of AWD treatment under proper application of N fertiliser, as mentioned by Furukawa et al. (2007) and Tirol-Padre et al. (2017). Brentrup et al. (2000) have documented that N2O emission increases under moisture alternations such as successive moist and dry episodes. In agreement with the literature, during the alternative wetting and drying period, N2O fluxes peaked when the water table dropped below the soil surface under high soil redox conditions and during the transition from aerobic to anaerobic just after fertilisation. Hence, throughout the dry season, peaks from AWD/P treatment have increased, as reported in previous studies (Hou et al., 2012; Tirol-Padre et al., 2017).
Statistical details for both wet and dry seasons for the Sri Lankan site are mentioned in Table 2.
3.1.2. Emission dynamics in Indian paddy plots
CH4 and N2O emissions measurements in Indian paddy sites for the wet season are shown in Figures 6 and 7, respectively.
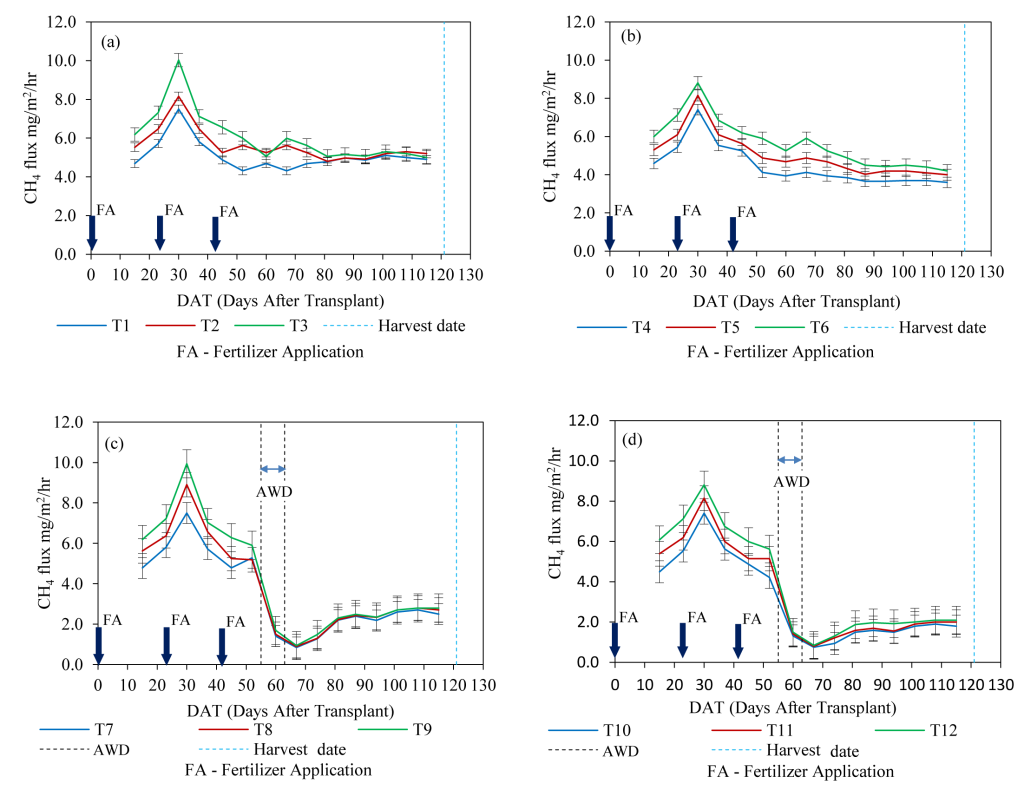
Regardless of treatments, the methane emissions observed at 30 DAT peak can be attributed to the interaction between microbial biomass dynamics and organic matter decomposition under shifting soil redox conditions (ranging between −153 to −159 mV). Mid-season drainage substantially reduced methane emissions, while CF without plant plots emitted high methane emissions due to the organic matter accumulation and absence of plant-mediated processes such as oxygen transportation, allowing methanogenic microorganisms to dominate and increase methane production (Conrad, 2007; Khalil & Rasmussen, 1992).
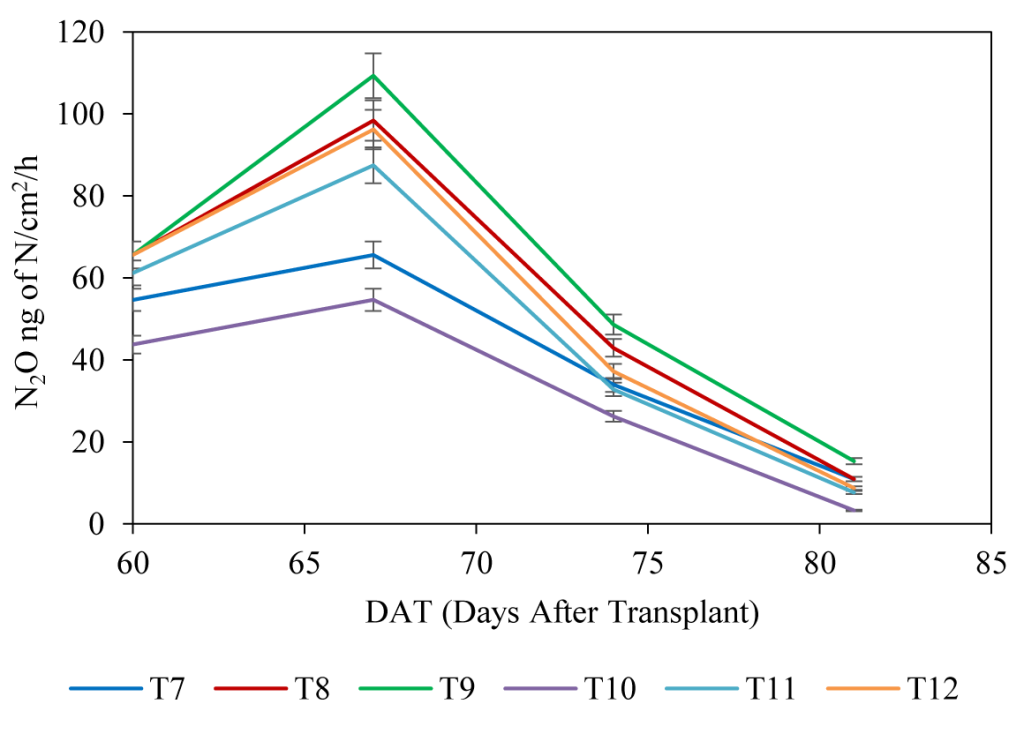
Although measurements of N2O emissions yielded negative results under CF plots, with the onset of the AWD period, emissions peaked ten days after drainage. Notably, plots without plants exhibited higher N2O emissions than plots with plants. Furthermore, in terms of supplementation, plots enriched with vermicompost and the recommended dose of fertiliser (RDF) experienced elevated N2O emissions, followed by plots supplemented solely with RDF, and the control plots exhibited the lowest N2O emissions. A large number of denitrifying bacteria in the earthworm gut and the surrounding vermicompost substrates is generally attributed to the increased N2O emissions in vermicompost-amended soils (Wang et al., 2014).
Figures 8 and 9 show the CH4 and N2O emission variation in the dry season for Indian paddy plots, respectively.
Figures 8a and b, which exhibit CH4 emissions data in the dry season, showed the trend around 30 DAT; emissions gradually approached zero. Differences between the plots with and without plants were negligible, demonstrating that the introduction of vermicompost did not exhibit any statistically significant impact on methane emissions (Sharma et al., 2016).
The results demonstrated a noticeable increase in N2O emissions following fertilisers applied in divided dosages. All treatments show a similar pattern in N2O fluctuations, while the highest N2O dynamics belongs to the vermicompost amendment plot when compared to synthetic fertiliser and control plots. As mentioned by Sharma et al. (2016), applying vermicompost increases the soil’s physical properties, like soil aggregates and structure, thus enhancing the aeration in the soil profile. Intriguingly, the N2O emissions rates of the plots without plants were higher than those with plant plots, while control plots without any supplementation showed the least emissions, almost nil (Figure 5). This observation underscores the interplay between nutrient availability, fertilisation strategies, and the subsequent manifestation of N2O emissions.
Comparison between results from Sri Lankan and Indian paddy sites regarding seasonal emissions under CF and AWD and grain yield are shown in Table 3.
| Sri Lanka | India | |||
|---|---|---|---|---|
| CF | AWD | CF | AWD | |
| Seasonal CH4 emissions (kg/ha) | 125.0–517.0 | 71.2–349.6 | 107.38–136.20 | 73.5–90.7 |
| Seasonal N2O emissions (kg/ha) | 1.2–20.9 | 1.3–27.3 | NM | 0.25–2.86 |
| Grain yield (Mg/ha) | 3.3–3.7 | 3.1–3.8 | 3.16–5.5 | 3.15–5.5 |
| Reduction in CH4 emissions under AWD (%) | NA | 32.0–43.0 | NA | 31.6–33.4 |
| NA: Not Applicable, NM: Not Measured. | ||||
3.1.3. Methane emission dynamics of Japanese rice paddies
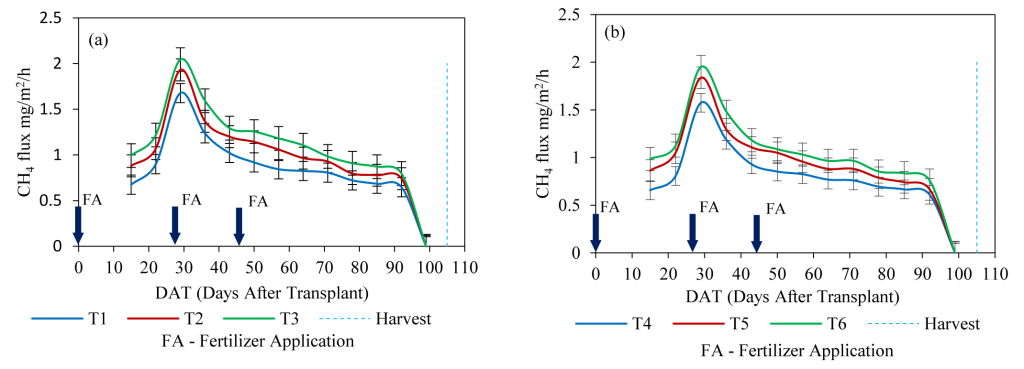
The Japanese experimental sites were used in this study to closely monitor methane ebullition under fully flooded site conditions, with and without the effect of straw incorporation. The seasonal and diurnal CH4 flux for the plots containing plants is depicted in Figure 10.
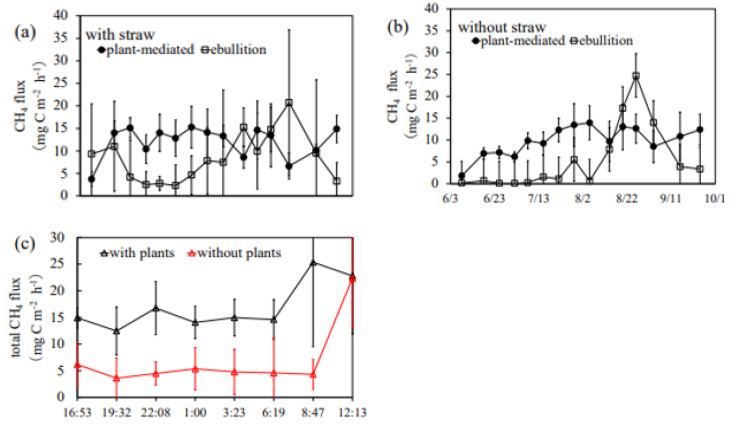
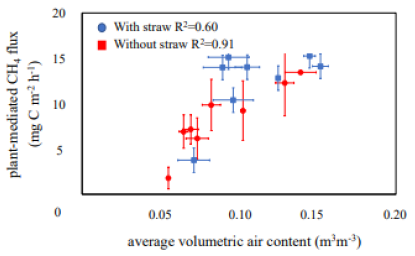
The plots with straw treatment showed higher fluxes via both plant-mediated and ebullition during the heading stage than without straw (Figure 10a); the decomposition of applied rice straw enhanced CH4 production during the earlier part of the growth period. During the ripening stage, there were high CH4 emissions via ebullition (Figures 10a and 10b) and the proportion of CH4 flux as ebullition to the overall flux was greater than 60%. There are two possible reasons for this behaviour. First, there was an increase in the supply of organic matter because of the plant roots. Second, there was a dysfunction of aerenchyma in the paddy rice, causing a reduction of plant-mediated emissions. Total flux and ebullition tended to rise in the early morning and fall in the late afternoon throughout the diurnal variation (Figure 10c). Within the day, the CH4 flux through the plant was essentially constant (data not shown). The magnitude of the ebullition CH4 flux at all growth stages was not explained by any of the factors considered in this study: soil temperature, atmospheric pressure and average volumetric air content, according to the results of the multiple regression analysis. Figure 11 shows the correlation between the plant-mediated flux for the plots with plants and volumetric air content averaged in 0–10 cm depth at heading and panicle formation stages. The average volumetric air content was positively correlated with both with-straw and without-straw plots. This implies that the increase in the contact area between rice roots and CH4 bubbles in the soil enhanced CH4 transport through the plant.
3.2. Practical implications and limitations
The experimental sites in Sri Lanka and India were selected in the intermediate zones (i.e., the transition zone between dry and wet zones) due to the more suitable geographical conditions to maintain the AWD. Due to the practical difficulty of maintaining AWD under monsoons in the wet zones due to the saturated ground condition, the AWD method could be easily applicable in dry and intermediate zones where farmers use stored water for cultivation, and it will act as an effective method of conserving water while sustaining paddy emissions. In the wet zones, where farmers depend strongly on rainfall and water is not a critical factor, the application of AWD, and hence achieving its associated benefits on GHG emissions, has become a distant goal.
The country-specific practices and regulations make it difficult to maintain consistency in water management strategies across the region. Some practices are essentially site-specific and vary considerably within the same country, making it difficult to provide conclusive recommendations without detailed studies on the unique responses in each ecosystem. The variations of climate (e.g., temperature, humidity), soil (e.g., texture, structure, and the status of organic matter), plant (e.g., rice cultivar), management (e.g., tillage, time of fertiliser application, agricultural amendments) in different sites bring additional complexity when selecting the optimal AWD windows to sustain agricultural emissions. Further research studies focusing on site-specific parameters are important to make more realistic estimates from the application of AWD to mitigate paddy emissions.
4. CONCLUSIONS
This study examined AWD as a promising water-saving strategy for reducing CH4 and N2O emissions while sustaining rice yields compared to conventional CF paddy cultivation. Emissions of CH4 and N2O in wet and dry seasons in Sri Lanka and India were studied under country-specific supplemental variations while using measurements in a Japanese site for close observation of methane ebullition under CF conditions.
Sri Lankan experiments show that AWD treatment suppressed CH4 emissions by about 32–43% without a significant statistical contrast (p > 0.05) in the crop yield. Plants were found to be responsible for emitting 70.3% of CH4. Cumulative N2O emissions, however, were raised by 7–23% due to the AWD treatment.
In Indian experimental sites, CH4 emissions under the AWD treatment were 31–33% lower than the CF conditions. Plots supplemented with vermicompost exhibited significantly higher methane emissions, followed by the plots supplemented with regular fertiliser, as compared to the lowest emissions in control treatments.
The application of rice straw at the Japanese experimental site increased CH4 emissions via ebullition in the heading stage. Methane emissions as ebullition accounted for 60% of total emissions during the heading stage. Total and ebullition CH4 fluxes were lower at night and higher from the morning to early afternoon.
Overall, the results show that the AWD is a promising water management approach to reduce methane emissions, nearly 31–43%, from paddy fields while sustaining the crop yield. Care should be taken when supplements such as vermicompost or straw are introduced, as they can potentially enhance methane emissions.
Continuing research that puts further emphasis on specific parameters related to climate, soil, plant, and management is essential to making innovative strategies to optimise mitigation efforts from paddy ecosystems in Asian countries.
5. ACKNOWLEDGEMENT
We gratefully acknowledge the financial support for this research from the Asia-Pacific Network for Global Change Research under the project reference number “CRRP2020- 07MY-Deepagoda”. Any opinions, findings, conclusions or recommendations expressed herein are those of the authors and do not necessarily reflect the views of those providing the financial support.