Impact of biomass burning sources during the high season on PM2.5 pollution observed at sampling sites in Hanoi, Vietnam and Chiang Rai, Thailand
Keywords
Biomass burning sources · MODIS fire map · PM2.5 pollution · PMF receptor model · Southeast Asia
Highlights
- A contrasting pattern of PM2.5 concentrations was measured in Hanoi and Chiang Rai for the winter and spring periods
- The contribution of biomass burning sources to the measured PM2.5 in Chiang Rai was larger than that in Hanoi
- Potential impacts of both local and regional biomass burning sources on the measured PM2.5 in Hanoi and Chiang Rai during the high season were found
1. Introduction
Southeast Asia (SEA) has been reported as one of the world’s largest biomass burning source regions. The regional haze known as ‘Asian Brown Cloud’ resulting from biomass burning sources occurs almost every year in SEA, which strongly impacts human health, the environment, and global climate variations (Chen et al., 2017). In most SEA countries where the economic development is based largely on the agricultural sector, actions to slow the adverse impact of poor air quality caused by biomass burning are stalling in the face of intense economic imperatives and the pace of development.
To date, several studies have been conducted to assess the impacts of biomass burning sources on air quality in SEA countries. For example, See, Balasubramanian, Rianawati, Karthikeyan, and Streets (2007) reported that biomass burning sources, particularly those within peat soil areas in Sumatra and Kalimantan, Indonesia, contributed to the high emissions of fine particles and gases into the atmosphere. Engling, He, Betha, and Balasubramanian (2014) measured total suspended particles (TSP) in Singapore during a haze episode and showed that large-scale forest and peat fires in Sumatra and Kalimantan were the sources of smoke aerosol in downwind areas in Singapore. Pengchai et al. (2009) reported that vegetative burning was one of the major contributors to PM10 concentration in Thailand’s Chiang Mai-Lamphun basin. In the study carried out by Quah (2002), biomass burning sources in Indonesia were found to influence the air quality in neighbouring countries such as Singapore, Malaysia, Brunei and Thailand. In the upper part of SEA (Myanmar, Thailand and Laos), forest fires and the burning of agricultural residues in the transition period from the winter to dry season were reported as the causes of haze and PM10 pollution in Chiangmai, Thailand (Oanh & Leelasakultum, 2011). Sillapapiromsuk, Chantara, Tengjaroenkul, Prasitwattanaseree, and Prapamontol (2013) estimated the emission of PM10 over Chiang Mai and found that the highest PM10 emission in 2010 was due to the burning of forest, while that in 2011 was from the burning of agricultural residue. More recently, Punsompong and Chantara (2018) used the potential source contribution function to identify potential sources of PM10 pollution from biomass burning in northern Thailand. They reported that most high-potential sources and emissions were transboundary from Myanmar (73.2%) and within Thailand (26.8%). Hansen et al. (2019) showed that five regions were identified as the dominating sources of PM10 pollution during haze seasons in Singapore, including Riau, Peninsular Malaysia, South Sumatra, and Central and West Kalimantan. Vongruang and Pimonsree (2020) used the WRF-CMAQ modelling system to investigate the contributions of biomass burning sources to PM10 concentrations over countries in mainland SEA. Their results showed that biomass burning contributed to 73%, 69%, 59%, 45%, 33%, and 31% of PM10 concentration in Laos, Myanmar, Cambodia, Thailand, China, and Vietnam, respectively.
Despite several studies that have been carried out for assessing the impacts of biomass burning sources on coarse particles (mainly TSP and/or PM10) in SEA countries, there have been limited studies concerning the impacts of biomass burning sources on the fine particle (PM2.5) pollution in the SEA region. In order to contribute to the evidence on the impact of biomass burning sources on PM2.5 pollution in SEA, this study aimed to assess the PM2.5 concentration and the potential impacts of biomass burning sources on the PM2.5 measured at the sampling sites in Hanoi, Vietnam and Chiang Rai, Thailand during the high season (from January to April) in 2021 with intensive biomass burning periods.
2. Methodology
2.1 Study areas and sampling sites
Hanoi is the capital and the second-largest city of Vietnam, with a total area of about 3,328 km2 and a population of about 8.1 million people. Hanoi features a subtropical climate that is influenced by the northeast monsoon in winter and the southeast monsoon in summer with four distinct seasons including spring (from March to May), summer (from June to August), fall (from September to November) and winter (from December to February). During the last decade, there has been rapid economic development, urbanization, urban population growth and motorization in Hanoi. The city is characterized by a large number of private vehicles (mainly motorcycles and cars). Traffic emission has been considered one of the most important sources of air pollution in Hanoi (Nguyen & Nowarat, 2011). This study considers the sampling site (Lat 21.003N, Lon 105.842E) in Hanoi located on the roof of a two-storey building in the Hanoi University of Civil Engineering, Hai Ba Trung District, Hanoi (Figure 1). The sampling site could be considered mixed site influenced by diverse emission sources such as traffic, domestic, construction, and industrial activities (Luong et al., 2021).
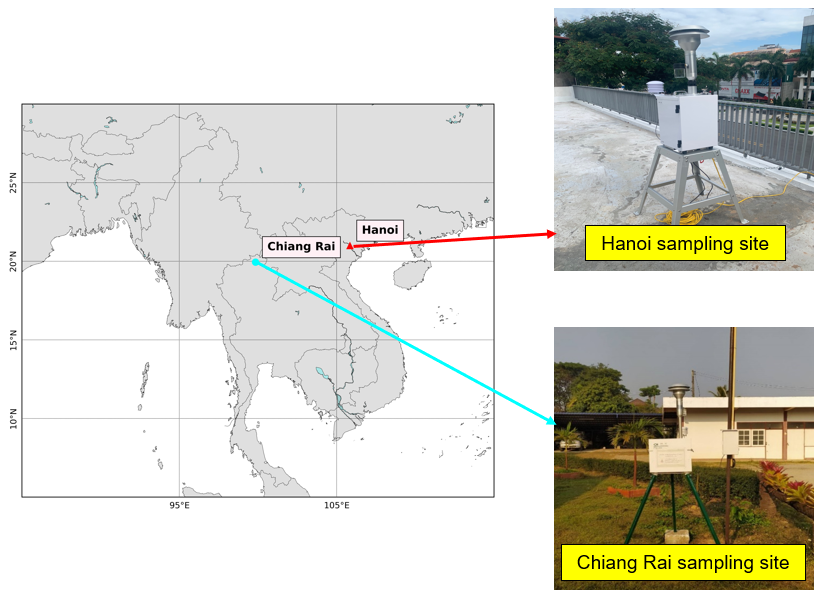
Chiang Rai is the northernmost province of Thailand that shares borders with Laos and Myanmar. The atmospheric circulation of Thailand is characterized by the monsoon system. Cool, dry continental air masses prevail during the northeast monsoon season (October–February) that could transport air pollutants from distant areas. Whereas, the maritime and clean air masses mainly dominate during the southwest monsoon season (May–September). The biomass burning season in northern Thailand generally occurs during the dry months (February–April). Biomass (i.e. agricultural waste, sugarcane, rice straw and other crops) is usually burnt before the harvest season to quickly clear the land and prepare the fields for the next crop cycle (Kayee et al., 2020). In this study, the sampling site (Lat 19.943N, Lon 99.846E) in Chiang Rai was located about 2.5 m above ground at the Office of Hydrology, Muang District, Chiang Rai (Figure 1).
2.2 PM2.5 sampling and chemical analysis
24-h integrated PM2.5 measurement campaigns were conducted concurrently at both sampling sites in Hanoi and Chiang Rai from January to April 2021. PM2.5 samples were collected on quartz-fibre filters (Whatman, QM-H pure quartz, size 47 mm, USA) using low-volume air samplers that operated at a flow rate of 16.7 L/min. The quartz-fibre filters were weighed twice before and after sampling. Before weighing, the filters were equilibrated for 24 hours in a desiccator at a temperature of 25°C ± 5°C and a relative humidity of 50% ± 5 %. Before sampling, the quartz-fibre filters were preheated in an electric furnace at 900°C for 3 hours to remove possible carbonaceous contaminants. After sampling, these samples were sealed in an aluminium foil and kept in a clean plastic bag. They were transported to the laboratory and stored with silica gel particles in a desiccator. The collected quartz-fibre samples were stored in a refrigerator at about 4°C to prevent the evaporation of volatile components before chemical analysis. The collected samples were then determined gravimetrically for the PM2.5 total mass. Field blanks were collected using the same procedures applied for the PM2.5 samples but without running the sampling system.
Concentrations of water-soluble inorganic ions (NH4 +, Na+, Mg2+, K+, Ca2+, NO3 –, SO4 2–, F–, and Cl–) in PM2.5 were analyzed by ion chromatography (IC). A quarter of the filter was put in an Erlenmeyer flask with 10 ml of ultrapure water (Millipore Direct Q, resistivity 18.2 MΩ) and treated in an ultrasonic bath for 30 min. For analysis of anions and cations, the extract was filtrated through 0.45 μm nylon syringe filters and injected into IC Dionex 600. The AS4A-SC (4 mm x 250 mm) column was used to determine anions, with an eluent mixture of 1.7 mM NaHCO3 and 1.8 mM Na2CO3 was used, and its flow rate was 2 ml/min during the analysis. The CS12A (2 mm x 250 mm) column was used to determine cations with an eluent of 22 mM H2SO4 solution, and its flow rate was 0.25 ml/min during the analysis. For analysis of both anions and cations, the IC injection volume was 25 μl, the run time was 30 min, and the column temperature was 35°C. The method detection limits (MDLs) for Cl−, NO3 −, SO4 2−, Na+, NH4 +, K+, Mg2+, and Ca2+ were 0.01, 0.02, 0.03, 0.05, 0.05, 0.06, 0.03, and 0.08 μg/m3, respectively. Field blanks were routinely analyzed and the results were subtracted from the sample values.
Meanwhile, a quarter of the sample filter was treated to analyse trace elements by the digestion method according to EPA method IO-3.1. The piece of filter sample was digested in 5 ml of mixed acid solution (HNO3: HCl with a ratio of 1:3) and kept on a hot plate at high temperature until a transparent solution was boiled. After complete digestion, the digested sample was heated at low temperature until nearly dry to remove excess acid. Then, a solution was diluted in a 25 ml volumetric flask with distilled water. Samples were analyzed using an Inductively Coupled Plasma Mass Spectrometer (ICP-MS, ELAN 900, Perkin Elmer, USA) for 18 elements, including aluminium (Al), titanium (Ti), vanadium (V), chromium (Cr), manganese (Mn), iron (Fe), Coban (Co), nickel (Ni), copper (Cu), zinc (Zn), arsenic (As), selenium (Se), strontium (Sr), molybdenum (Mo), cadmium (Cd), antimony (Sb), barium (Ba), and lead (Pb). A blank sample, a duplicated sample, and a spiked sample were measured for quality control in the analysis. The relative standard deviation of each element was within 10% and the analytical errors were <10%. The detection limit for all trace elements was 0.01 ng/m3, except for Cd (0.002 ng/m3).
Aerosol carbonaceous contents (OC and EC) in PM2.5 were analyzed using the Organic Carbon – Elemental Carbon (OC-EC) Analyzer (Model 5L, Sunset Laboratory Inc., USA). The NIOSH 870 thermal optical transmittance protocol was used in this study to determine OC and EC content in PM2.5 collected on the quartz-fibre filters. An area of 1.5 cm2 was punched from each PM2.5 filter sample and placed in the quartz oven for analysis. The quartz filter paper was heated in the oven according to the different temperatures of 310oC, 475oC, 615oC, and 870oC in an oxygen-free environment of pure helium to produce four OC fractions (OC1, OC2, OC3 and OC4). Then, the temperature of the sample oven was reduced to around 550oC, and EC was analyzed by subsequent heating at 550oC (EC1), 625oC (EC2), 700oC (EC3), 775oC (EC4), 850oC (EC5), and 870oC (EC6) in an environment of 98% He and 2% O2. Carbon vapour in the heating processes was oxidized to CO2 in the oxidizing oven. The CO2 was quantitatively reduced to CH4 in nickel catalyst and then quantitatively measured with a flame ionization detector (FID). The instrument’s detection limit was 0.2 μg C/cm2 and the analytical uncertainty was equal to ± (OC/EC concentration × 0.05) + instrument blank concentration.
Analysis results of PM2.5 chemical composition (ions, trace elements, and carbonaceous species) were used as the input for the receptor model as described below.
2.3 Receptor modelling for source apportionment analysis
Source apportionment (including the contribution of biomass burning sources to the measured PM2.5) was conducted using the USEPA Positive Matrix Factorisation (PMF) receptor model. The PMF receptor model aims to reconstruct the contribution of emissions from different sources to the measured PM2.5 based on the PM2.5 chemical composition data obtained at the sampling sites. PMF is a multivariate factor analysis tool that decomposes a matrix of PM2.5 speciated sample data into two matrices: factor contributions and factor profiles. These factor profiles need to be interpreted by the user to identify the source types that may be contributing to the PM2.5 sample using measured source profile information and emissions or discharge inventories (EPA, 2014). PMF introduces a weighting scheme taking into account errors of data points that are used as point-by-point weights. The adjustment of corresponding error estimates allows it to handle missing and below detection limit data. Moreover, non-negative constraints are implemented to obtain more physically meaningful factors. This study employs the PMF v.5.0.
2.4 MODIS fire radiative power data
This study uses the cumulative fire radiative power (FRP) data product derived from the collection 6 MODIS active fire detection algorithm (Giglio, Schroeder, & Justice, 2016) for exploring biomass burning activities occurring in the SEA region during the study periods and their possible impacts on the measured PM2.5 at the sampling sites in Hanoi and Chiang Rai. The cumulative FRP data was obtained from the Fire Information for Resource Management System website (https://firms.modaps.eosdis.nasa.gov), which was provided by both MODIS Aqua and Terra. This study used the FRP averaged from MODIS Terra and Aqua data with a high-confidence level.
2.5 Air mass backward trajectories
This study analyses the three-day isentropic backward trajectories of air masses to identify the most likely biomass burning source regions influencing the measured PM2.5 at the sampling sites in Hanoi and Chiang Rai. Three days were expected to be enough time for most trajectories to pass through the possible source regions in SEA. Backward trajectories were generated using the hybrid single-particle Lagrangian integrated trajectory (HYSPLIT) model (Draxler & Rolph, 2003; Rolph, 2003) that was accessed and run through the NOAA website (https://www.ready.noaa.gov/HYSPLIT.php). Calculations were made interactively using the National Centers for Environmental Prediction’s Global Data Assimilation System data set. Trajectories were computed every hour with a starting height of 1,500 m above the ground level.
3. Results and Discussion
3.1 PM2.5 mass concentration in Hanoi, Vietnam and Chiang Rai, Thailand
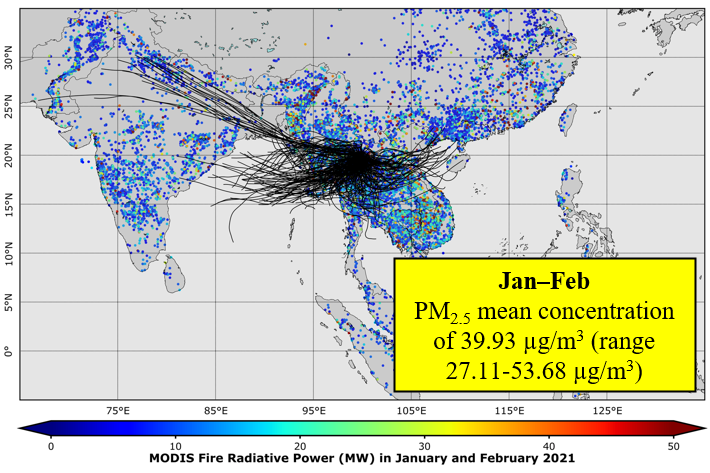
Figure 2 shows the daily mean concentration of the measured PM2.5 during the January–February periods at the sampling sites in Hanoi, Vietnam and Chiang Rai, Thailand. The daily mean PM2.5 concentrations (65.41–129.29 µg/m3) measured at the sampling site in Hanoi exceeded the 24h-average national ambient air quality standard for Vietnam (50 µg/m3) for all sampling dates. The increased concentration levels of PM2.5 at the sampling site in Hanoi could be due to the impact of the stagnant condition caused by the low mixing height during the winter period that could largely enhance the accumulation of air pollutants near the surface. In addition, the highly elevated concentration of PM2.5 at the sampling site in Hanoi could also be influenced by the long-range transported air pollutants from regional sources during the winter period. For the measurement conducted at the sampling site in Chiang Rai, the daily mean PM2.5 concentrations (range 27.11–53.68 µg/m3) exceeded the 24h-average national ambient air quality standard for Thailand (50 µg/m3) for several sampling dates. The average value of PM2.5 daily concentrations for the whole measurement period in January–February at the sampling site in Chiang Rai was 39.93 µg/m3, which was about 2.39 times lower than the counterpart estimated for the sampling site in Hanoi.
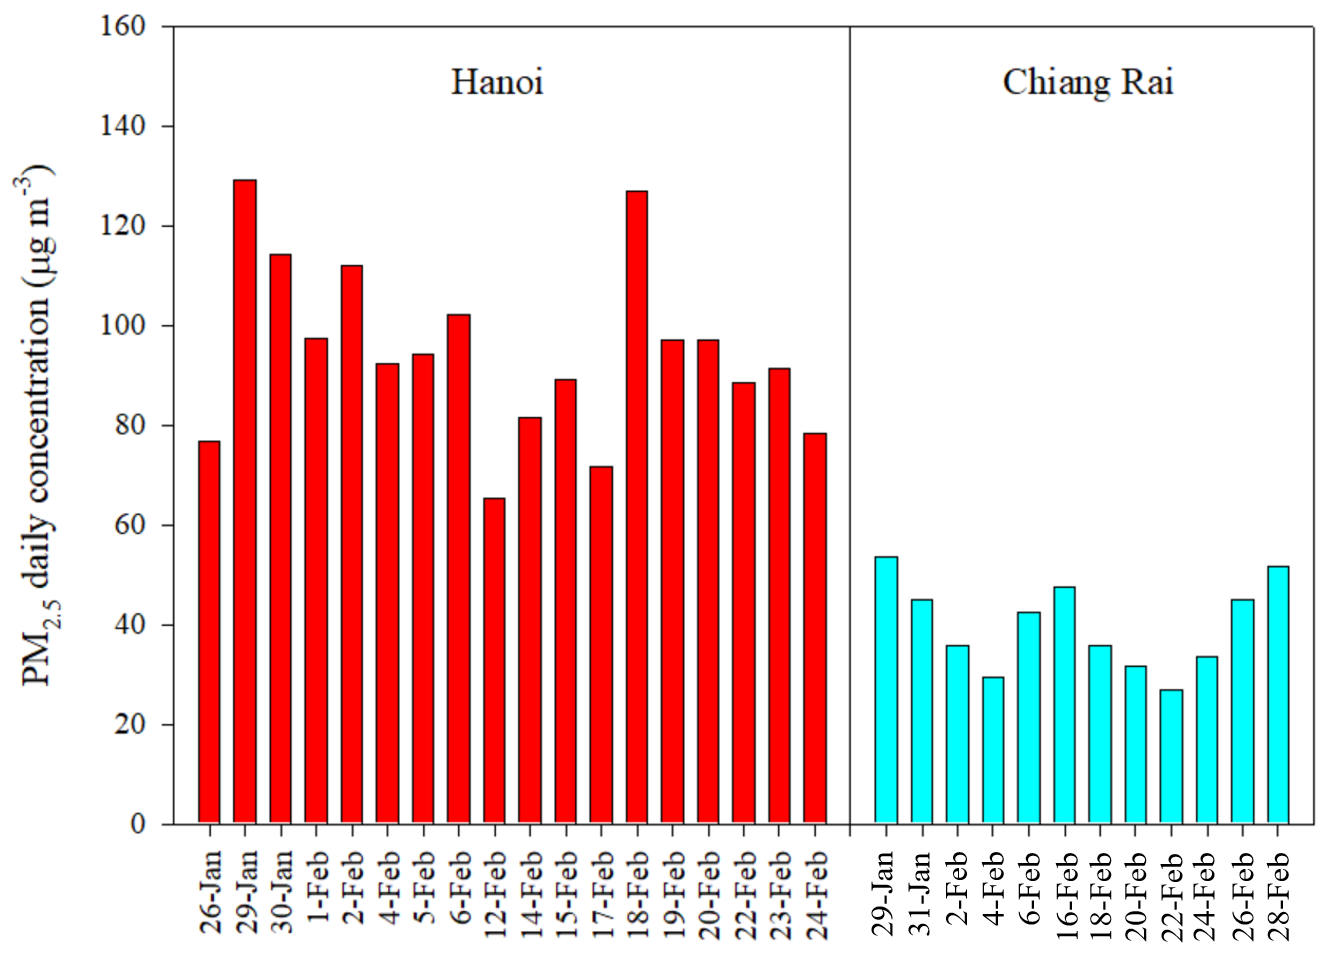
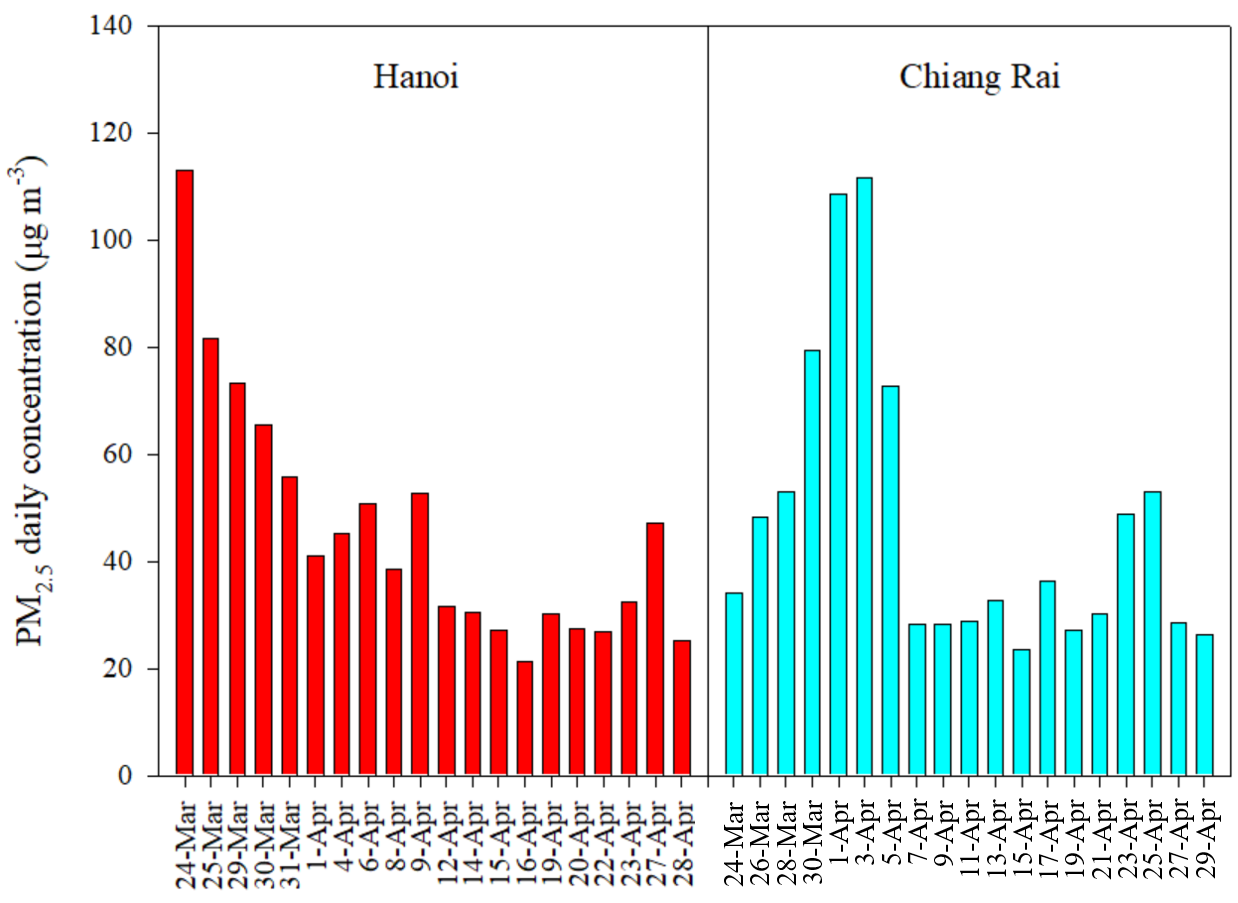
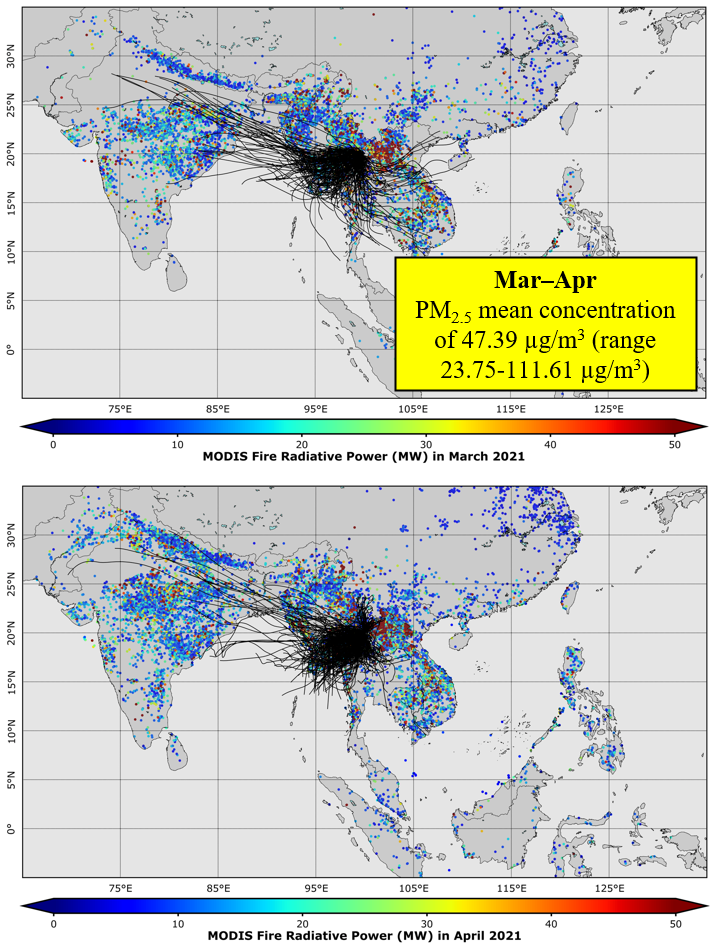
Figure 3 displays the daily mean concentration of PM2.5 measured during the March–April periods at the sampling sites in Hanoi and Chiang Rai. The daily mean PM2.5 concentrations (21.34–113.13 µg/m3) measured at the sampling site in Hanoi were higher than the 24h-average national ambient air quality standard PM2.5 in several sampling dates. However, the average value of 45.96 µg/m3 for the whole measurement period was still lower than the national standard value for PM2.5. The daily mean PM2.5 concentrations (23.75–111.61 µg/m3) at the sampling site in Chiang Rai also exceeded the 24h-average national ambient air quality standard for PM2.5 in several sampling dates. Interestingly, the average value of 47.39 µg/m3 for the whole measurement period at the sampling site in Chiang Rai was slightly higher than the counterpart in Hanoi, which is different from those observed for the January–February measurement periods. This suggested that the PM2.5 measurement at the sampling site in Chiang Rai during the spring period could be largely influenced by local and/or regional biomass burning sources that will be discussed later in the article.
3.2 Source apportionment for PM2.5 measured in Hanoi and Chiang Rai
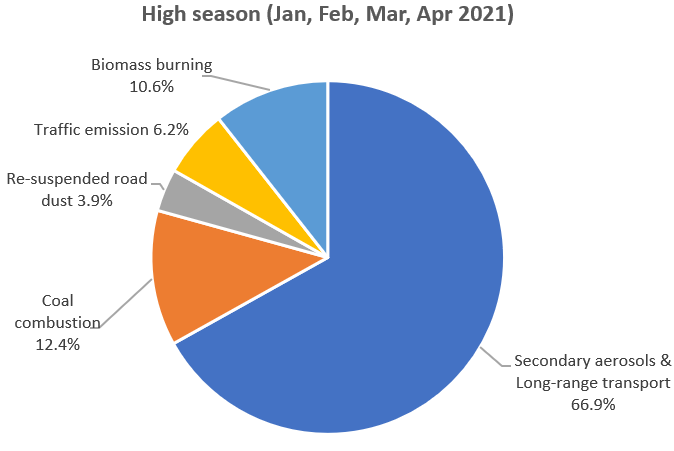
Figures 4 and 5, respectively, show the PMF receptor model-based PM2.5 source apportionment results for the sampling sites in Hanoi, Vietnam and Chiang Rai, Thailand for the high season in 2021. At the sampling site in Hanoi (Figure 4), secondary aerosols and long-range transport were the largest source contributing to the measured PM2.5. This result is consistent with the previous study in Hanoi carried out by Hien et al. (2021). The second-largest source was coal combustion and followed by biomass burning. The contribution of biomass burning to the measured PM2.5 for the high season (10.6%) was remarkable.
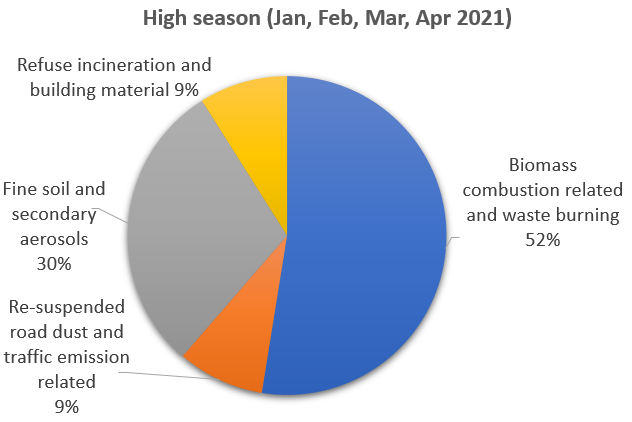
At the sampling site in Chiang Rai (Figure 5), the related biomass combustion and garbage burning were reported as the largest sources contributing to the measured PM2.5, followed by fine soil and secondary aerosols. This result confirmed the significant impact of biomass burning sources on the measured PM2.5 at the sampling site in Chiang Rai during the high season.
3.3 Impacts of biomass burning sources on the measured PM2.5 at sampling sites in Hanoi and Chiang Rai
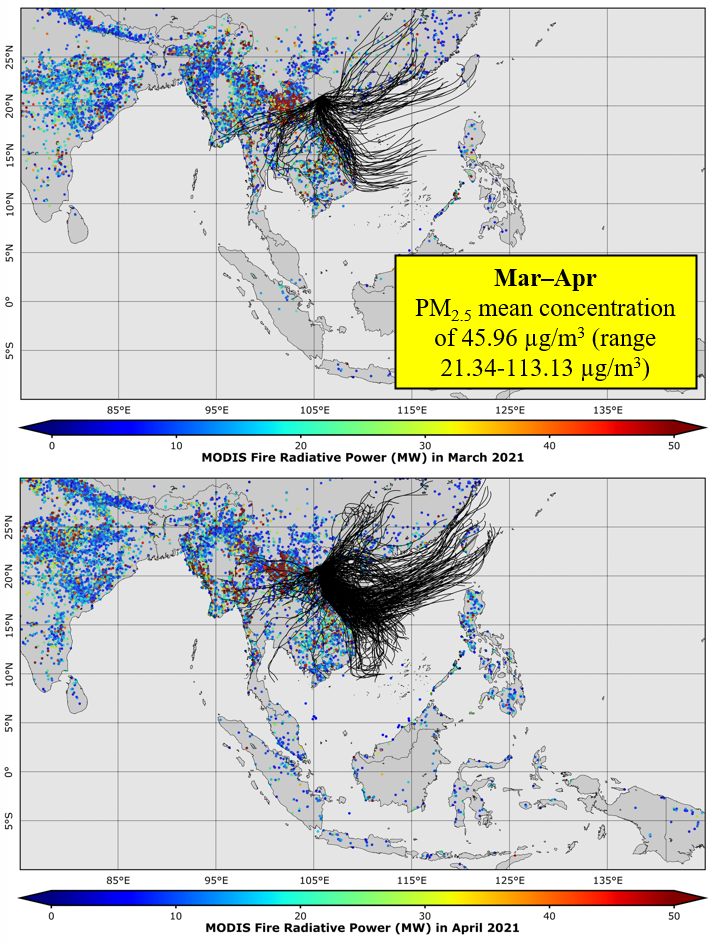
The integrated maps of cumulative FRP derived from the collection 6 MODIS active fire product and three-day air masses backward trajectories generated using the HYSPLIT model were constructed to further investigate the impacts of biomass burning sources on the measured PM2.5 at the sampling sites in Hanoi, Vietnam and Chiang Rai, Thailand. Figures 6, 7, 8 and 9 show the regional maps of MODIS cumulative FRP and three-day air masses backward trajectories that arrived at the sampling sites in Hanoi and Chiang Rai during different measurement periods. Fire activities occurring in the SEA region and the southern part of China during the measurement periods in January, February, March and April of 2021 were numerous.
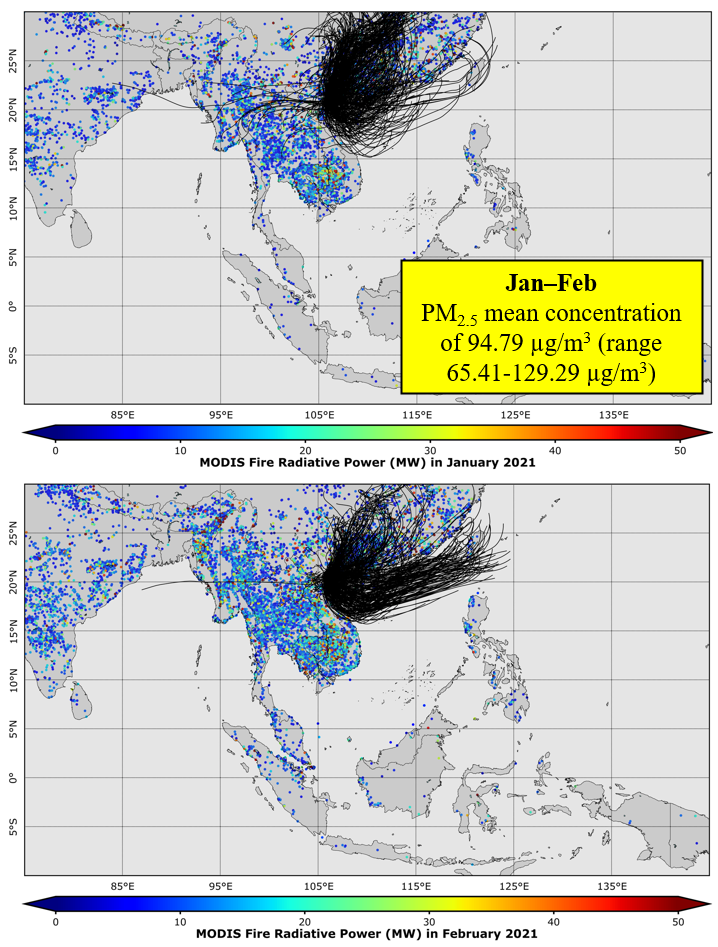
Air masses that arrived at the sampling site in Hanoi during the measurement periods in January and February were observed mainly from the north and northeast directions and passed over the dense fire regions in the southern part of China (Figure 6). Regionally transported air masses could bring many air pollutants from these fire regions to the sampling site in Hanoi and contribute to the highly increased concentrations of PM2.5 in the winter period. The mean concentration of PM2.5 measured at the sampling site in Hanoi for the winter period was 94.79 µg/m3 (range 65.41-129.29 µg/m3). Meanwhile, during the measurement periods in March and April, air masses mainly originated from the East Sea before arriving at the sampling site in Hanoi (Figure 7). The predominant occurrence of maritime air masses could be the reason for the lower concentrations of PM2.5 (mean 45.96 µg/m3, range 21.34-113.13 µg/m3) in the spring period compared to those observed for the winter period at the sampling site in Hanoi. However, there were several days (i.e. 24, 25, 29, 30 March and 6, 9 April) in which air masses travelled over the dense fire regions in the central and northern parts of Vietnam as well as in the neighbouring SEA countries such as Laos and Thailand before arriving at the sampling site. Since air masses pass over both local and regional biomass burning sources, they might also contribute to the increased concentration of PM2.5 measured at the sampling site in Hanoi on those days (Figure 3).
During the measurement periods in January, February, March and April in Chiang Rai, air masses arrived at the sampling site were from the west and northwest directions and mainly originated from the Andaman Sea and the Bay of Bengal, which were then passed over the dense fire regions in the southern part of Myanmar and the northwestern part of Thailand (Figures 8 and 9). The influence of air masses, especially the slow-moving air masses in March and April (Figure 9), which travelled over both locally and regionally intensive biomass burning source regions, was recognized as the main reason for the high concentrations of the measured PM2.5 (mean 47.39 µg/m3, range 23.75-111.61 µg/m3) during these periods at the sampling site in Chiang Rai. In comparison, the mean concentration of PM2.5 measured for the period Jan–Feb was 39.93 µg/m3 (range 27.11-53.68 µg/m3), which is lower than that for the period March–April.
4. Conclusion
In this study, the PM2.5 measurement campaigns were conducted concurrently at the sampling sites in Hanoi, Vietnam and Chiang Rai, Thailand during the high season from January to April in 2021. Results showed that the average value of PM2.5 daily concentrations measured at the sampling site in Hanoi was higher than that measured at the sampling site in Chiang Rai during the January–February periods. In contrast, the average value of PM2.5 daily concentrations measured at the sampling site in Hanoi was slightly lower than the counterpart at the sampling site in Chiang Rai during the March–April periods. The elevated concentrations of the PM2.5 measured in Chiang Rai during the spring periods were largely associated with the intensive biomass burning activities in the SEA region. Results for the PMF receptor model-based source apportionment indicated a larger contribution of biomass burning sources to the PM2.5 measured at the sampling site in Chiang Rai compared to that at the sampling site in Hanoi. The analysis of integrated maps of MODIS cumulative FRP in the SEA region and three-day air masses backward trajectories arrived at the sampling sites in Hanoi and Chiang Rai during the measurement periods further suggested the potential impacts of biomass burning sources on the measured PM2.5. It was observed that the long-range transported air masses passing through the fire regions in the southern part of China could contribute to the elevated PM2.5 concentrations at the sampling site in Hanoi during the January–February periods. Meanwhile, the air masses that travelled over the dense fire regions in the northwestern part of Thailand and the southern part of Myanmar were likely the main cause for the high PM2.5 concentration at the sampling site in Chiang Rai during the March–April period.
Acknowledgement
This study is part of the project “Integrated Approach of In-situ Measurement, Modeling Techniques, and Advanced Satellite Remote Sensing for Mapping and Quantifying Contribution of Local and Regional Biomass Burning Sources to Air Pollution in Southeast Asian Countries” (Project Reference Number: CRRP2019-11MY-Nguyen) which is funded by the Asia-Pacific Network for Global Change Research. The authors gratefully acknowledge the NOAA Air Resources Laboratory for the provision of the HYSPLIT trajectory model (READY website: https://www.ready.noaa.gov/HYSPLIT.php) and NASA, USA, for the provision of the MODIS fire data (FIRMS website: https://firms.modaps.eosdis.nasa.gov) used in this study.