How to measure urban water security? An introduction to the Water Security Assessment Tool (WATSAT)
Keywords
Decision-support tool · Indicator-based methodology · Water security assessment · Water security index · WATSAT
Highlights
- A web-based digital tool named WATSAT to assess urban water security was developed.
- WATSAT measures five dimensions of water security, resulting in a Water Security Index.
- Users simply enter the data required and WATSAT does all the analysis at the backend.
- WATSAT aids in determining practical interventions for the enhancement of water security.
- It is a decision-support tool enabling city stakeholders to operationalise water security.
1. Introduction
Ensuring safe water and enhancing water security is a major concern in light of the effects of changing climate, increasing population and urbanisation, as well as intensive socioeconomic development and extensive land-use changes ( Babel, Chapagain, Shinde, Prajamwong, & Apipattanavis, 2022). Initially viewed as a water scarcity issue, the concept of water security has evolved over time and is now looked at holistically, encompassing several dimensions ( Chapagain et al., 2022; Cook & Bakker, 2012). A widely accepted definition of water security provided by UN-Water (2013) describes it as “the capacity of a population to safeguard sustainable access to adequate quantities of and acceptable quality water for sustaining livelihoods, human well-being, and socioeconomic development, for ensuring protection against water-borne pollution and water-related disasters, and for preserving ecosystems in a climate of peace and political stability”. A precursor to achieving water security is measuring it, based on the adage by Peter Drucker, “you cannot manage what you cannot measure”.
Water security assessment has received increasing attention from academicians, practitioners, planners, and policy- and decision-makers, with varieties of frameworks developed for different scales ( ADB, 2013; ADB, 2016; Aboelnga, Ribbe, Frechen, & Saghir, 2019; Assefa, Babel, Sušnik, & Shinde, 2018; Babel et al., 2022; Babel, Shinde, Sharma, & Dang, 2020; Chang & Zhu, 2020; Chang & Zhu, 2021; Chapagain et al., 2022; Cook & Bakker, 2012; GWP, 2000; Gerlak et al., 2018; Grey & Sadoff, 2007; Jensen & Wu, 2018; Khan, Guan, Khan, & Khan, 2020; Krueger, Rao, & Borchardt, 2019; Leeuwen & Chandy, 2013; Sullivan, 2002; UN-Water, 2013; Vörösmarty et al., 2010; WEF, 2020; Young et al., 2019; Zakeri, Mirnia, & Moradi, 2022). From an operationalisation point of view, the city scale is appropriate to take account of the spatial and social variation of water security assessment, which is often precluded in analyses carried out at the national scale ( Babel et al., 2020). Cities are considered the engines of economic growth. As cities generate more than 80% of the world’s gross domestic product (GDP) ( Lall, Lebrand, Park, Sturm, & Venables, 2021), it is evident that human activities will lead to increased pressure on land and natural resources in the coming decades ( Lall et al., 2021). Moreover, the gradual shift from rural to urban areas, along with fast-paced urbanisation, rapid population growth and changing climate, are making cities susceptible to rising water stress and water insecurity ( Ray & Shaw, 2019). Thus, it is imperative that concepts related to enhancing water security, which usually require a “bottom-up” approach, be implemented at the local level, such as the city for sustainable growth and increased productivity ( Babel et al., 2020).
It is to address this notion that the Asian Institute of Technology (AIT) and its partners developed a holistic water security assessment framework for cities ( Babel, Dang, Sharma, & Shinde, 2015) consisting of five dimensions: (1) Water supply and sanitation, (2) water productivity, (3) water-related disasters, (4) water environment, and (5) water governance.
The five dimensions accurately reflect both the definition provided by UN-Water (2013) and the indicators of SDG6. This framework was applied successfully in three cities with diverse climates and socioeconomic conditions, namely, Bangkok (Thailand), Hanoi (Vietnam) and Jaipur (India). The framework is meant to help city authorities and decision-makers make objective evaluations of the water security situation in their city. It uses an indicator-based methodology that measures five distinct dimensions of water security, which together add up to a Water Security Index (WSI). The WSI provides an overall picture of the water security situation in the city, while the evaluation of the various dimensions helps identify specific areas of concern.
To improve the ease of convenience of using the water security assessment framework, the objective of this project was to develop a web-based digital water security assessment tool called “WATSAT” that is holistic in nature and can quantitatively assess the different aspects of water security. The tool is available in the public domain at (www.watsat.org). WATSAT has been developed by the Asian Institute of Technology (AIT) in collaboration with the National Institute of Urban Affairs (NIUA) and the Central University of Rajasthan (CURAJ) in India, the Thuyloi University (TLU) in Vietnam, and Tribhuvan University (TU) in Nepal.
2. Methodology
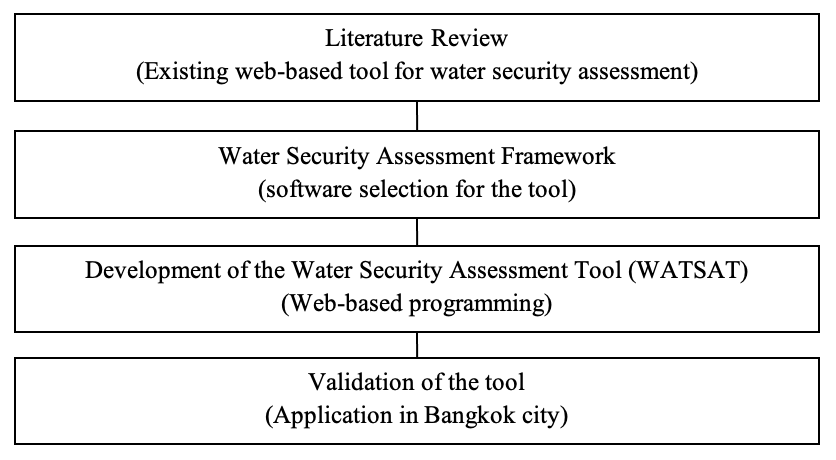
An overview of the methodology adopted for the development of the Water Security Assessment Tool (WATSAT) is summarised in Figure 1. It began with a review of the existing web-based tools for water security assessment, followed by the software development based on the existing water security assessment framework, and finally, the validation of the tool’s applicability through an example of water security assessment in Bangkok city. The methodological steps are described in the following section.
2.1 Literature review
The authors first conducted a thorough literature review on the existing web-based water security assessment tools. We discovered that there are a limited number of tools developed for water security assessment. For example, the Global Water Scarcity Atlas tool developed by the Water & Development Research Group at Aalto University in Espoo, Finland, in collaboration with the Water Program at International Institute for Applied Systems Analysis (IIASA) in Laxenburg, Austria, showcases analyses of global water scarcity. However, the tool focuses only on the water availability dimension of water security. Similarly, the Aqueduct Water Risk Atlas developed by the World Resources Institute ( WRI, 2019) evaluates water risks based on cutting-edge data and maps the current and future water risks across locations. Likewise, OurWater, a digital tool for resilient water governance developed by a collaborative effort between Arup, the Stockholm International Water Institute (SIWI), and the Organisation for Economic Co-operation and Development (OECD), funded by The Resilience Shift, is designed to address the need for collaborative governance by understanding the impact of shocks and stresses on natural and man-made water infrastructure and identifying the interaction among key stakeholders involved in urban water management ( Saikia et al., 2020).
To our knowledge, there are no such digital tools that exist to facilitate users with a holistic assessment of the water security situation, specifically at the city scale.
2.2 Water security assessment framework
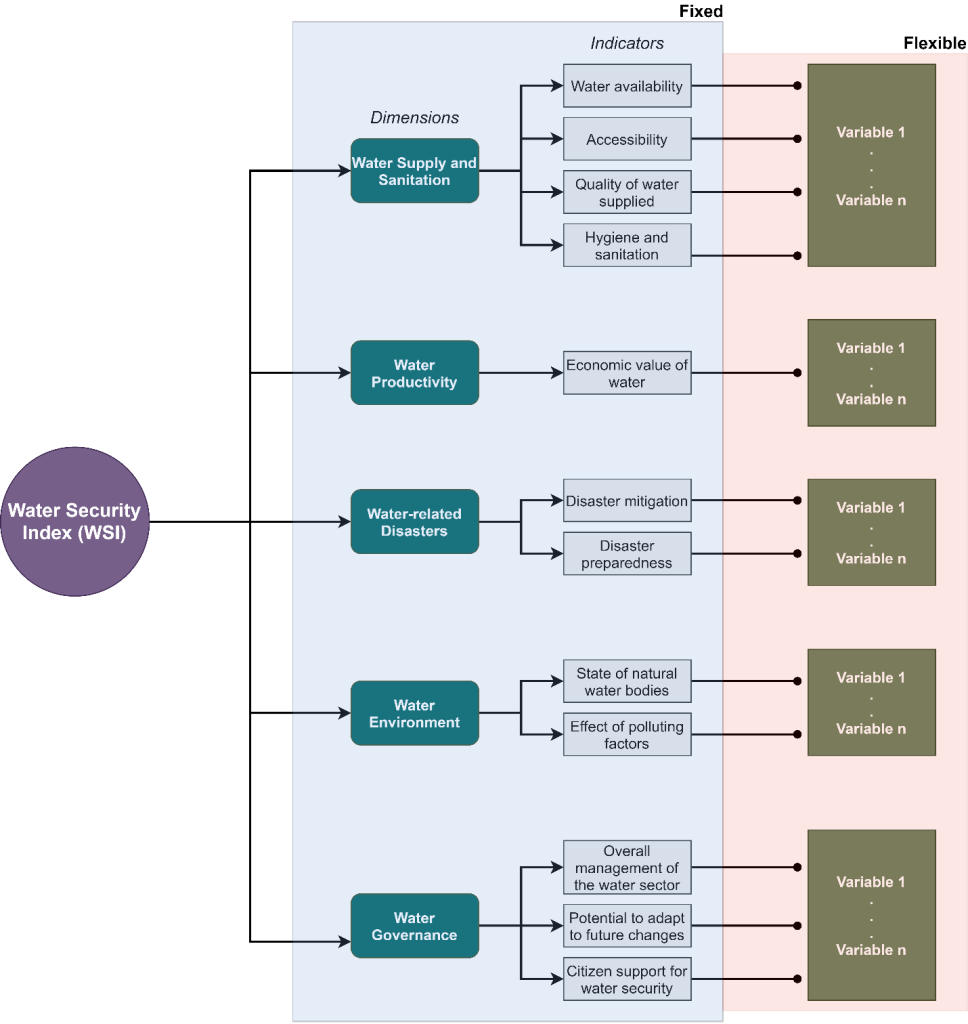
The architecture of WATSAT is based on the water security assessment framework developed by Babel et al. (2020). WATSAT comprises a three-layered structure—dimensions, indicators and variables—that ultimately results in the Water Security Index (WSI). It comprises five dimensions and twelve indicators and provides users with a long list of potential variables to choose from to reflect the indicators. From an operational viewpoint, the twelve indicators were selected to measure the five dimensions because they represent the areas of interest within the dimensions, are relatively easy to understand and comprehend, have better data availability and accessibility (World Bank and UN databases), are reflective of the SDG6 indicators and fosters generalisation of the water security assessment framework developed, making it universally applicable to cities across the globe.
The dimensions each capture a distinct aspect of water security, with minimal overlap between them ( Babel et al., 2020). The five dimensions are: “Water supply and sanitation”, “Water productivity”, “Water-related disasters”, “Water environment”, and “Water governance”. The dimensions are measured by one or more indicators, as shown in Figure 2. Each indicator is estimated using specific variables. The three-layered structure of the framework allows it to remain generic while still being able to identify site-specific issues and challenges related to water security (Babel et al., 2020). Hence, the dimensions and indicators are kept fixed in the framework. The selection of the variables is up to the users, depending upon what they think is relevant for their city and what data is available. WATSAT is flexible and robust to allow city authorities to choose the most relevant variables to reflect the local contexts. Thus, WATSAT can be applied to any spatial unit, such as part of a city (such as ward) or whole city, to capture its variability, provided the required data is available at the selected spatial unit. One fundamental principle of the framework is that all the potential variables contribute to the estimation of water security depending on the weightage given to them. The details of the city-scale water security assessment framework developed by Babel et al. (2020) are presented in Table 1.
|
Dimension |
Indicator |
Potential variables |
Suggested ways to measure |
Source |
|
Water supply and sanitation |
Water availability |
1. Per capita water use (lpcd) |
Total domestic water consumption/City population |
|
|
2. People in the city using improved water sources (%) |
(Population with improved water sources facilities/City population) × 100 |
|||
|
3. Investment in water supply facilities (USD) |
Self-explanatory |
|||
|
4. Percentage of imported water (%) |
(Amount of water imported/Total water supplied to the city) × 100
|
|
||
|
Accessibility to water |
1. Population access to piped water supply (%) |
(Population access to piped water supply/City population) × 100 |
||
|
2. Service area coverage by piped water supply (%) |
(Area covered by piped water supply/City area) × 100 |
|
||
|
3. Average distance travelled to fetch water from improved water sources (km) |
Self-explanatory |
|
||
|
4. Safe drinking water inaccessibility (%) |
(The ratio of population without access to improved drinking water resources to the total population) × 100 |
|||
|
5. Water supply service duration per day (h)
|
Self-explanatory |
|
||
|
Quality of water supplied |
1. Customer satisfaction with quality of water supplied (1:n) |
No. of employees in water utility/No. of city customers |
|
|
|
2. Type of water treatment employed (no unit) |
Self-explanatory |
|
||
|
3. Coliform count of supplied water (MPN/1000) |
E.coli count |
|
||
|
4. Residual chlorine (%) |
Percentage of residual chlorine monitoring points satisfying the remnant requirement |
|
||
|
5. Turbidity of water (NTU) |
Self-explanatory |
|
||
|
6. pH of supplied water (NTU)
|
Self-explanatory |
|
||
|
Hygiene and sanitation |
1. People in the city using improved sanitation facilities (%) |
(Population with improved sanitation facilities/City population) × 100 |
||
|
2. Water-borne disease factor (%) |
(Hospitalised cases of water-borne diseases/Total hospitalised cases) × 100 |
|||
|
3. Investment in sanitation facilities (USD) |
Self-explanatory |
|||
|
4. Proportion of customers connected to sewer line system (%) |
(No. of customers connected to sewer line/City population) × 100 |
|
||
|
Water productivity |
Economic value of water |
1. Commercial water productivity (USD/m3) |
Commercial GDP of the city/Commercial water use in the city |
|
|
2. Agricultural water productivity (USD/m3) |
Agricultural GDP of the city/Agricultural water use in the city |
|
||
|
3. Water wealth (USD/m3) |
Total income of people/Water used |
|
||
|
4. Water price (USD/m3) |
Self-explanatory |
|
||
|
Water-related disasters |
Disaster mitigation |
1. Disaster budget factor (%) |
(Investment in disaster response mechanisms/Total city budget) × 100 |
|
|
2. Per capita GDP (USD) |
Total GDP/City population |
|
||
|
3. Flood damage (USD) |
Economic damage caused by floods |
|
||
|
4. Proportional area of flooding (%) |
(Flooded area/Total city area) × 100 |
|||
|
Disaster preparedness |
1. Drainage factor (%) |
(Total open green space/Total city area) × 100 |
|
|
|
2. Disaster preparedness workshops with vulnerable communities (number) |
Number of workshops conducted with vulnerable communities |
|
||
|
3. Flood risk mapping (no unit) |
Flood zoning |
|
||
|
Water environment |
State of natural water bodies |
1. Natural water quality factor (%) |
(Dissolved Oxygen (DO) concentration/Minimum required standard for DO) × 100 |
|
|
2. Water Quality Index (no unit) |
Country-specific |
|
||
|
3. Biochemical oxygen demand in water bodies (mg/L) |
BOD5 concentration |
( Mehr, 2011) |
||
|
Effect of polluting factors |
1. Wastewater treatment factor (%) |
(Amount of treated wastewater/Total wastewater generated) × 100 |
|
|
|
2. Water pollution factor (%) |
(Volume of the untreated wastewater to the total volume of water source) × 100 |
|||
|
3. Industrial influent treatment factor (%) |
(Amount of treated industrial effluent/Total industrial effluent generated) × 100 |
|
||
|
Water governance |
Overall management of the water sector |
1. Institution factor (no unit) |
Questionnaire |
|
|
Potential to adapt to future changes |
1. Adaptability factor (no unit) |
Questionnaire |
|
|
|
Citizen support for water security |
1. Public support factor (no unit) |
Questionnaire |
|
To compute the WSI, the first step involves normalising all variables to a range of 1 to 5 using reference values. Reference values can be used to categorise variables based on their magnitudes, which can be assigned numerical scores on a scale of 1 to 5 ( Babel et al., 2020). Although there are many reference values for various variables reported in the literature, it is crucial to consult with experts within the country to confirm or modify these values and scores to fit the local context ( Babel et al., 2020).
After normalising all the variables that contribute to an indicator, their scores are aggregated and averaged to determine the indicator score. In the same way, the dimension score is determined by aggregating and averaging all the indicators that contribute to it. Finally, the WSI is determined by averaging all the dimension scores ( Babel et al., 2020). Weights to be given to selected variables of an indicator, to various indicators of a dimension, and to various dimensions can be provided by the users; else the tool uses equal weights at all three levels. These weights can be established with inputs from various stakeholders or using techniques such as the Analytic Hierarchy Process (AHP) ( Saaty, 1987). The WSI falls in the range of 1–5, with a score of less than 1.5 interpreted as “Poor Water Security” and a score greater than 4.5 interpreted as “Excellent Water Security”.
2.3 Development of the water security assessment tool (WATSAT)
WATSAT is a web-based tool written in the C#.net programming language with the welcome page interface written in JavaScript and HTML.
The tool has been developed to make it as user-friendly as possible, keeping in mind that its actual design purpose is to facilitate city authorities and decision-makers to make an objective evaluation of the water security situation and foster practical solutions to improve water security in the city. In this regard, the selection of indicators reflecting areas of interest within the dimensions was a conscious decision, as well as keeping indicators to a minimum of 12 so that the tool can be relatively easily operationalised. Furthermore, the variables used to quantify the indicators are characterised by a relatively manageable degree of complexity in terms of data availability.
Similarly, data entry for selected variables in WATSAT is grouped into different categories in a fashion similar to how different organisations or governmental authorities store their data. For example, population-related data in WATSAT are categorised into demographic data, whereas GDP data are categorised into the socioeconomic data category. Additionally, the water governance dimension is measured through three subjective variables: “institutional factor”, “adaptability factor” and “public support factor”. These variables are quantified through questionnaires as formulated by Babel et al. (2020) and the responses to these questionnaires were scored on a scale of 1-5 using a 5-point Likert scale. For ease of data entry and computation purposes in WATSAT, these questionnaires have been presented in yes/no format. A remark is provided in the data entry menu instructing the users to enter the value “1” if their answer is yes and “0” if their answer is no to the question. By doing so, WATSAT facilitates users in systematic data collection and storage processes.
The reference values used to benchmark variables’ scores on a 1-5 scale are kept fixed in WATSAT, thus enabling spatial and temporal comparison of water security status within and among cities. Similarly, the tool’s flexibility in weightage provision at all levels (i.e., variables, indicators, and dimensions) serves to prioritise diverse water-related issues and challenges faced by different cities. Moreover, WATSAT also has a provision for validating the user’s input data. The data validation in WATSAT functions to validate if there are any variables with missing values and if weights provided at all three levels—variables, indicators, and dimensions—are correct. In case the weights given at any of the three levels do not add up to 100%, users are informed of this discrepancy during the data validation process. WATSAT also has a provision for users to export the results to their personal computers in an Excel sheet format. This enables them to carry out further analysis, such as comparison within and among cities and developing graphical visualisation of results, among others. Finally, WATSAT also provides a guideline functionality which, as its name suggests, guides users through a step-by-step procedure to successfully carry out water security assessment for the city.
2.4 Validation of the tool
WATSAT was validated by testing its application to assess the water security of Bangkok city. The data for Bangkok city for the year 2017 was collected from various government agencies, as presented in Table 2.
|
Sl. No |
Data |
Unit |
Value |
|
1 |
City population |
persons |
9,005,378 |
|
2 |
City area |
km2 |
1565.2 |
|
3 |
Green areas (open space) |
km2 |
378 |
|
4 |
Total city budget |
USD/year |
15,068,000,000 |
|
5 |
Commercial GPP |
USD/year |
129,481,385,699 |
|
6 |
Total water supplied |
MCM/year |
1,835 |
|
7 |
Population with access to piped water supply |
persons |
8,213,805 |
|
8 |
Amount of imported water |
MCM/year |
511 |
|
9 |
Total domestic water consumption |
m3/year |
474,100,000 |
|
10 |
Commercial water use in the city |
m3/year |
392,310,000 |
|
11 |
Number of residual chlorine monitoring points |
Number |
28 |
|
12 |
Number of residual chlorine monitoring points satisfying the remnant requirement |
Number |
26 |
|
13 |
Total cases of hospitalisation |
Number |
3,744,546 |
|
14 |
Hospitalised cases for water-borne diseases |
Number |
38,227 |
|
15 |
Investment in disaster response mechanisms |
USD |
451,465,800 |
|
16 |
Average Dissolved Oxygen (DO) concentration at all monitored locations |
mg/L |
1.74 |
|
17 |
Minimum required standard for Dissolved Oxygen (DO) |
mg/L |
2 |
|
18 |
Volume of wastewater generated |
m3/day |
1,898,981 |
|
19 |
Volume of wastewater treated |
m3/day |
1,106,013 |
|
20 |
Is public opinion sought when developing water-related plans for the city? |
|
Yes |
|
Is there a provision for the public to register their grievance? |
|
Yes |
|
|
Is there an official mechanism to monitor Non-Revenue Water (NRW)? |
|
Yes |
|
|
Is there a provision to incentivise judicious water management? |
|
Yes |
|
|
Does the organisation consult other water organisations during the development of annual or long-term plans? |
|
Yes |
|
|
Does recycling and/or reuse of water take place in the city? |
|
No |
|
|
Is there a centralised database for water-related information? |
|
Yes |
|
|
Is there a system to forecast water availability and quality? |
|
Yes |
|
|
Are future drivers of change (e.g., climate change) taken into consideration when developing long-term city master plans? |
|
Yes |
|
|
Is there a mechanism for the organisational staff to upgrade water-related knowledge? |
|
Yes |
|
|
Are citizens involved in water management through any mechanisms? |
|
Yes |
|
|
Out of the total amount that the consumer has to pay as water fee, is at least 80% received every month? |
|
Yes |
|
|
Do citizens generally comply with the rules and regulations set for water theft/ water malpractices? (generally may be taken as around 80-90% of the population) |
|
Yes |
|
|
Do citizens generally comply with the rules and regulations set for unauthorised groundwater abstraction? (generally may be taken as around 80-90% of the population) |
|
No |
|
|
Do citizens generally comply with the rules and regulations set for illegal pollution of water? (generally may be taken as around 80-90% of the population)
|
|
No |
3. Results and discussion
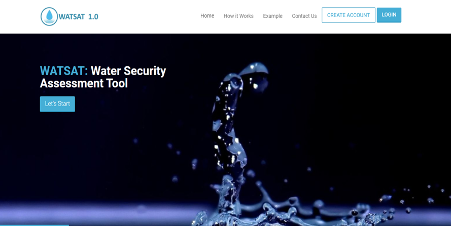
The developed water security assessment tool, “WATSAT”, is a significant outcome of the project, which is available in the public domain <www.watsat.org>. The website directs users to the landing page, which consists of six menus, as shown in Figure 3. The “Home” and “How it Works” menus provide the user with background information on WATSAT, its structure, and its operating procedure. The “Example” menu demonstrates the application of WATSAT by considering the case study of Bangkok city.
The “Create Account” menu requires users to provide their basic information, email address, and organisation in order to create a user account for WATSAT. They also need to provide consent for allowing WATSAT developers to use an anonymised version of the data they enter into the tool for research purposes and further development of the tool. The “Contact Us” menu provides the contact information of developers for users to provide feedback and suggestions to further improve the tool. After creating an account, users can log in to WATSAT from the “Login” menu with their username and password.
A flow chart presenting each of the menus in WATSAT is shown in Figure 4. Two types of colour coding are used to describe the WATSAT menu. The grey-coloured boxes represent the fixed menus in the WATSAT system, where users can explore the menus and sub-menus but do not enter any data and are not allowed to make any changes or modifications. The green-coloured boxes represent the user-defined menus. As the name suggests, these menus and sub-menus are typically where the users can select the site-specific variables, input data values, assign weights, and estimate variable scores.
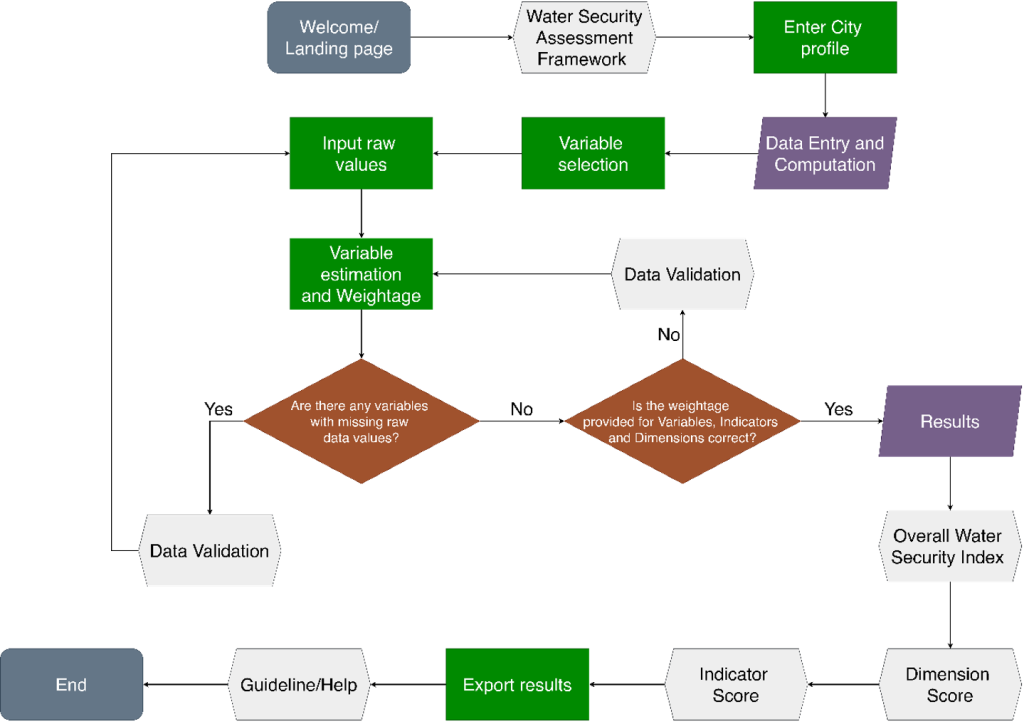
After the user logs into WATSAT, the tool consists of seven main menus. The “Home” menu is the first menu which outlines all the content in the seven menus of WATSAT. The second menu — Water Security Assessment Framework” — describes in detail the theoretical components of the WATSAT framework. It consists of six sub-menus: “Dimensions”, “Indicators”, “Variables”, “Reference Values”, “Raw Data Categories”, and “WSI Interpretation”. As mentioned before, the menu is solely for understanding purposes, and users are not required to enter any data and cannot modify these menus.
In the “City Profile” menu, users need to enter the city-related basic information to provide an overview of the city. City-related information includes the city’s name, the country it is located in, the year of assessment for water security, urban area, climate zone, average annual temperature, maximum and minimum temperatures, average annual rainfall, population, population growth rate, annual income per capita, number of sub-cities or districts or wards, and source(s) of water supply (surface water, groundwater, or both). From the above mentioned information, users have to enter the city’s name and year of assessment for water security, but the rest of the information is optional as these data are only to provide a context for the city and none of the data entered in this menu are taken for the purpose of analysis.
The fourth menu, “Data Entry and Computation”, is the most important menu in WATSAT. It consists of three sub-menus: “Variable selection”, “Input raw data values”, and “Variable estimation and weightage”. The variable selection sub-menu provides the users with a long list of potential variables and information about the data required to estimate these variables. This allows users to select specific variables that are relevant to their city’s context. In the input raw data values sub-menu, users are required to input the raw data values for the variables they selected in the previous menu. Users are advised to be careful about the units of the data while entering the data values. After the users input the raw data values for the variables, the computation of the selected variables’ scores is carried out in the variable estimation and weightage sub-menu. Users simply need to click on the “Compute all variable score” button in this sub-menu and WATSAT carries out all the computation at the backend and provides users with the estimated variable score. Likewise, users can also provide equal weights automatically to the selected variables by clicking on the “Equal weights” button or entering the weightage at all three levels: variables, indicators, and dimensions, in this sub-menu.
As mentioned earlier, WATSAT has a “Validation” menu to identify missing data or discrepancies in assigned weights to variables, indicators, and dimensions. The menu consists of four sub-menus: “Dimensions with wrong weights”, “Indicators with wrong weights”, “Variables with wrong weights”, and “Variables with missing value”. As the name indicates, the first three sub-menus validate if the weights given to selected variables, indicators, and dimensions in the previous menus add up to 100% or not, while the last sub-menu checks if there are any selected variables that are not provided with data values in the tool. This menu is a vital one as it offers the user an opportunity to minimise errors. For example: in many cases, users tend to forget to balance the weights provided to the selected variable to 100%. This discrepancy is detected in the Variables with wrong weights sub-menu in WATSAT and users can modify the weights for the selected variables within this sub-menu as well. It is recommended that users must always go through all four sub-menus of the “Validation” menu.
After the validation, the “Results” menu consists of four sub-menus: “Overall Water Security Index”, “Dimension Score”, “Indicator Score”, and “Export Variable Results”. The overall water security index sub-menu provides users with a single aggregated value ranging from 1 to 5 that depicts the overall situation of water security in a city along with the interpretation of the score. The Dimension score sub-menu provides users with means to understand how the city performs in terms of the five dimensions of water security. Further fine-grained analysis at the indicator level is provided in the indicator score sub-menu. In all these sub-menus, an “Export” button is provided, which enables users to download an Excel sheet consisting of the results of the dimension score and indicator score. Likewise, users can also export an Excel sheet with results at the variable level from the Export variable results sub-menu. This consists of results of raw variable value, variable score, and weights provided to the selected variables. It is noteworthy that the indicators reflecting water productivity and water governance dimensions are incorporated in WATSAT, given that these dimensions are often overlooked in other frameworks and tools. Likewise, the water security analysis at three levels (i.e., overall water security index, dimension score and indicator score) aids city authorities in identifying the driving forces or root causes that influence water security and guide them in developing practical solutions to enhance water security in the city.
Finally, WATSAT also provides users with a “Guideline/Help” menu which consists of two sub-menus: “Guided Access” and “User Manual”. The Guided access sub-menu guides users to go directly to any user-defined menu in a guided manner. The User manual menu provides a manual in PDF format that describes WATSAT in a step-by-step manner that is easy to comprehend and follow.
WATSAT was successfully applied to evaluate the water security situation for Bangkok City for the year 2017 based on the data presented in Table 2. Figure 5 , Figure 6, and Figure 7 show snippets of the results obtained in WATSAT for Bangkok city for the year 2017.
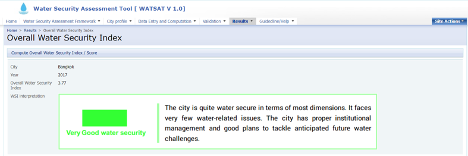
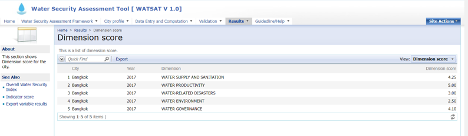
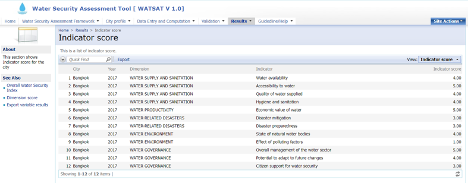
As indicated in Figure 5, the overall state of water security for Bangkok in 2017 was in a “very good” state. However, from the dimension’s perspective, Bangkok still has considerable room for improvement in terms of water-related disasters and water environment dimensions, as shown in Figure 6. The analysis at the indicator level shows that significant efforts are needed to reduce the effect of water polluting factors, such as direct discharge of domestic wastewater into waterways, to improve the water environment in Bangkok city. Likewise, Bangkok needs to increase investment in both disaster mitigation and disaster preparedness to anticipate future water challenges related to extreme climate events.
4. Research prospects and limitations
In recent years, there have been rapid advances in research on water security which have led to an improved and holistic understanding and assessment of water security. For example, the water poverty index proposed by Sullivan (2002), as a means to determine sustainability of water resources and their impacts on human populations, is a multi-dimensional index that reflects on five components: Resource (R), Access (A), Capacity (C), Use (U), and Environment (E). Although the WPI reflects on multiple dimensions of water security (Availability, Accessibility, Productivity, Quality), it does not effectively capture the water-related disasters and water governance aspects of water security, which are included in the present study. Similarly, Aboelnga et al. (2019) developed a framework with 27 indicators for urban water security assessment. The framework, although comprehensive, also disregards the water governance dimension of water security. Although the theoretical understanding and frameworks for water security assessment are robust, there is a great shift required to translate science into practice from an assessment framework to an action-based framework ( Babel et al., 2022). In this regard, this work is an effort to bridge the science-policy gap by facilitating the transfer of existing science into practice by developing WATSAT, a digital tool which is publicly accessible and holistic in nature, enabling city authorities to carry out independent quantitative assessments of the water security situation in the city.
One of the prospects for future work on WATSAT is the inclusion of the socio-political dimensions in the existing framework to take account of social inequality aspects such as roles of gender, vulnerable and marginalised groups of people, power, and conflict in securing water in urban areas. Similarly, climate-reflective and adaptation-related indicators to measure water-related disasters could further improve the framework. Furthermore, the addition of integrated indicators that reflect on the interlinkages of water, energy, and food resources is another avenue to explore upon to enhance the framework ( Albrecht, Crootof, & Scott, 2018; Babel, Rahman, Budhathoki, & Chapagain, 2023; Cai, Wallington, Shafiee-Jood, & Marston, 2018; Hoff, 2011). However, given the inherent complexity of the interaction associated with each resource, it is recommended that due consideration be given to ensure a comprehensive understanding of the nexus’s indicators and data availability prior to their incorporation into the urban water security assessment framework.
From the tool perspective, a limitation of WATSAT is its inability to undertake a water security assessment for multiple cities simultaneously, which is often carried out for comparative assessment among cities with diverse climatic and socioeconomic conditions. However, WATSAT was preliminary designed to be used by city authorities and decision-makers to assess water security for their cities. Furthermore, there is an opportunity to enhance the representation of the results through the implementation of effective visualisation techniques (bar charts, heat maps, among others), which can lead to better understanding and generate additional insights about the city’s water security situation. These improvements will be incorporated into the future versions of WATSAT.
5. Conclusions
This project has successfully developed a web-based digital tool called WATSAT (Water Security Assessment Tool) to help city stakeholders make a quantitative assessment of the water security situation in the city using five distinct dimensions. The tool is in the public domain (www.watsat.org). The findings and reflections that emerged out of the study are summarised as follows:
-
The tool is holistic in nature and robust to capture the elements of water security and thus can be applied to any city across the globe;
-
City stakeholders can make an objective assessment and have a holistic understanding of water security and interconnections of various factors affecting it and assist them in informed decision-making to arrive at system-based interventions to tackle water security threats in the cities; and
-
The validation of the tool is carried out with an example of the water security assessment in Bangkok city. Results show that while the overall state of water security is good, there is considerable room for improvement in terms of water-related disasters and water environment dimensions of water security in Bangkok.
This project work is an effort to bridge the science-policy-society gap by facilitating the transfer of science into practice. Thus, it is expected that the tool will help build the capacity of city authorities, planners and decision-makers, practitioners, and academicians, among others, in an improved understanding of the holistic nature of water security and its assessment. Moreover, this will create an enabling environment for mainstreaming WATSAT as a policy and management instrument.
Acknowledgement
The authors would like to thank the Asia- Pacific Network for Global Change Research (APN) for providing financial support for this work under Grant No. CBA2020-07SY-Babel.