Green technologies to enhance sustainable food production in colder regions via adoption of smart greenhouse
Keywords
Humidity · Smart greenhouse · Temperate region · Temperature
HIGHLIGHTS
- A solar water heating system (solar thermal system) was employed as the heat source for circulation within the SGH.
- Three primary sensors were utilised to monitor and control temperature, humidity, and light intensity.
- A prototype was developed after validating the simulation results obtained from EnergyPlus software.
- Performance of SGH was analysed and crops could be harvested during off-season.
1. INTRODUCTION
In earlier research by Hossain et al. (2014), the pivotal role of agriculture in the economies of South Asian Association for Regional Cooperation (SAARC) countries was emphasised, contributing about 20% to the gross domestic product (GDP) and serving as the livelihood for 51% of the population. Projections foresee this region accommodating nearly half of the world’s population by 2050, heightening vulnerability to hunger and poverty. Disseminating up-to-date scientific research and innovative agricultural technologies through farmer education is crucial for effective agriculture extension services. A shift from conventional to contemporary, integrated frming approaches shows promise in enhancing crop yields and productivity, addressing regional challenges and promoting agricultural development.
Weather and climate significantly influence agriculture, impacting sunlight exposure, temperature, humidity, rainfall, and soil moisture crucial for crop growth (Parolini, 2022). Chhogyel and Kumar (2018) emphasise that weather and climate are environmental determinants profoundly affecting crop production and productivity. Bhutan boasts a range of agricultural ecological zones and climates, offering opportunities for cultivating various crops (Centre, 2021).
Bhutan’s temperate region encompasses two zones: warm temperate and cool temperate. The former spans 1800–2600 m above sea level (masl) with an average annual temperature of 12.5 °C, while the latter ranges from 2600–3600 masl with an average annual temperature of 9.9 °C. Both regions receive annual rainfall of 650–850 mm, suitable for agriculture. Above 3600 masl lies the alpine area with yearly precipitation of less than 650 mm and an annual average temperature of 5.5 °C. These regions experience minimum temperatures and yearly rainfall of 0.1 °C and 650 mm, respectively. Additionally, solar irradiance measurements exceed 4.5 kWh/m2/day (NCHM, 2018). These climatic characteristics offer opportunities for researchers to explore and propose alternative solutions for sustainable food production in the agriculture sector. This research paper aims to study the technical feasibility of implementing SGH on a larger scale in cold temperate regions to enhance future food sustainability. A small-scale prototype of SGH, equipped with controllers and data loggers, was designed and implemented.
According to Lefers et al. (2020), emerging technologies are solutions for sustainable agriculture in extreme coastal environments. This paper explains the potential of combining emerging technologies like transparent infrared solar panels and low-energy saltwater cooling systems to develop sustainable controlled environment agriculture in the extreme coastal regions of the Middle East and North Africa. This indicates technology can assist in converting uncultivable land into cultivable land. The study by Al-Naemi and Al-Otoom (2023), the use of smart sustainable greenhouses in Gulf Cooperation Council (GCC) countries demonstrates significant potential for reduced water usage and high return on investment (RoI). This paper demonstrates the viability of a smart sustainable greenhouse model in GCC countries, powered by solar energy and advanced control systems, showcasing reduced water usage, significant RoI potential (340%), and a five-year pay-out period when scaled to commercial operations, thereby contributing to food security and profitability in the region.
The implemented prototype SGH yields promising results and is feasible for large-scale operations. Crops such as cauliflower, broccoli, cabbage, spinach, radish, cucumber, beans, and onions all yield well, except for chili. The following sections present detailed construction materials, methodology, system sizing, results and conclusions.
2. SGH CONSTRUCTION MATERIALS
2.1. SGH structure materials
Building a Smart Greenhouse (SGH) for agricultural activities using low-cost materials and solar energy can regulate the required temperature, humidity, and luminosity. Kodali et al. (2016) and Li et al. (2019) designed a smart greenhouse model that helped farmers automate farm monitoring. Malik et al. (2010) also discussed devices and communication protocols in developing smart greenhouses.
| Vegetable(s) | Min Temperature | Max Temperature | Average humidity (%RH) | Soil pH | Soil thickness (Inches) |
|---|---|---|---|---|---|
| Radish | 7.2 °C | 21 °C | 95–100 | 6–7 | 6 |
| Cabbage | 4.5 °C | 24 °C | 90 or higher | 6–7 | 1–2 |
| Broccoli | 4.5 °C | 21 °C | 95 | 6–6.5 | 1–3 |
| Spinach | 2 °C | 30 °C | 90–95 | 6.5–7 | 1–2 |
| Cucumber | 20 °C | 38 °C | 60–70 | 6.5–7 | 0.5–0.75 |
| Cauliflower | 17 °C | 20 °C | 85–90 | 6–6.8 | 17 |
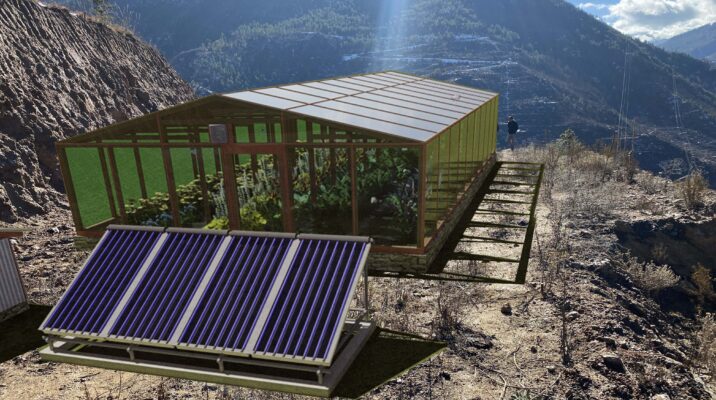
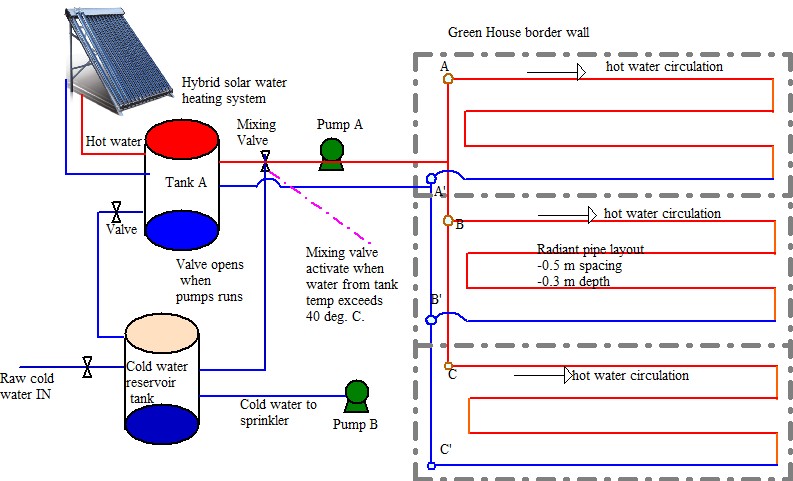
This technical report discusses the outcomes of the SGH prototype implemented in Genekha, located in the temperate region of Bhutan. The SGH prototype, measuring 12 × 7.5 m, was developed after simulating its performance in the TRNSYS and OpenStudio simulation software. The central concept in developing the SGH was to assess the viability of implementing SGH in temperate regions to enhance food production during the cold winter season when cultivable lands are left fallow due to harsh weather conditions. The energy source for the SGH was supplied using a solar thermal heating system. Based on the SGH’s location and weather conditions, the size of the thermal collector, the primary energy source for SGH, was 8 m2. In winter, the first four hours of the morning are when SGH requires the most heating. Figure 1 illustrates the complete construction and development of the SGH using solar thermal collectors. The SGH comprises a solar thermal system, including an auxiliary tank, solar collector, hot water tank, sensors for monitoring the SGH, a data logger inside the SGH and a weather station installed outside the SGH.
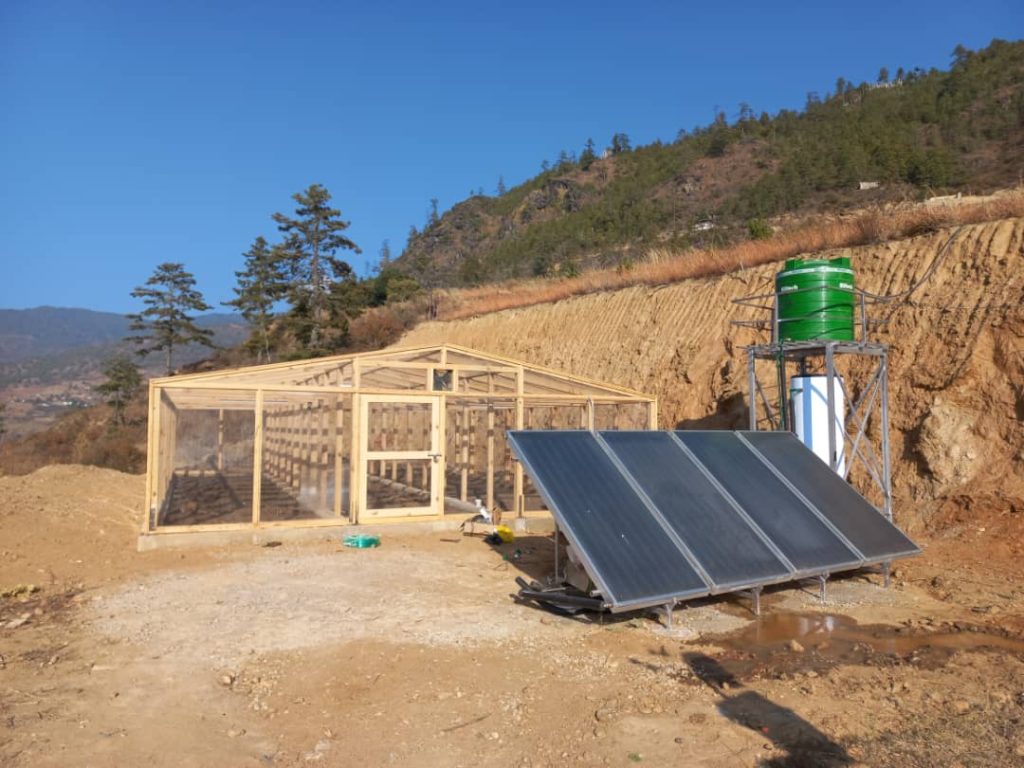
Inside the SGH, temperature, humidity and light intensity sensors are optimally placed to ensure the correct operation of the system. Polypropylene Random Copolymer (PPR) pipes, each spaced 0.5 m apart, are laid beneath the soil, which has a thickness of 0.3 m. The hot water tank circulates hot water when the temperature switch inside SGH activates. The PPR pipes release heat, thereby increasing the soil temperature. This heating of the soil helps maintain the required temperature inside the SGH.
2.2. SGH data loggers and controllers
In the SGH, three primary sensors are used: temperature, humidity and light, as shown in Figure 2.
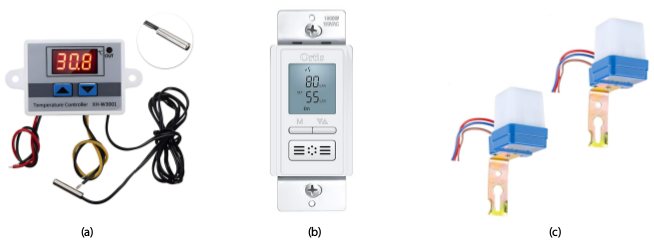
The temperature sensor is a central component of the SGH, functioning when there is an electricity supply. The temperature sensor switch activates when the temperature inside the SGH crosses a specified threshold level.
The selected crops to experiment inside SGH are mentioned in Table 1. The commonly grown vegetables in the colder regions are radish, cabbage, broccoli, spinach, cucumber, cauliflower, beans and chillis. The seasonal vegetables were experimented with in the smart greenhouse by providing required growth conditions like light, humidity and temperature. The vegetables growth periods have been critically considered to conduct experiments within the three-month winter season.
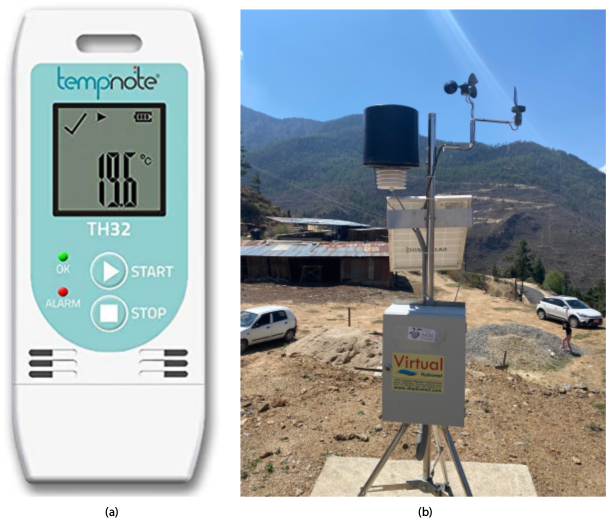
The data logger inside the SGH provides statistics on the comparison between the inside and outside environment. The weather station recorded the exterior environment data. Figure 3 shows the data logger installed inside SGH and the weather station outside SGH.
The humidity sensor was set between 40% RH and 95% RH. The specific maximum and minimum settings of these sensors are determined by the types of crops selected for the experiments. For instance, beans and chillis, which require lower humidity levels, were also included in the experiment. The vegetables selected in experiments are commonly grown vegetables in the region. The light sensor was configured to activate the switch when the luminosity of lights falls below a certain level, automatically turning on the switch until the sun rises. Adequate light intensity is essential for promoting plant growth. Soil testing is conducted to assess the conditions favouring crop growth. Soil parameters such as pH and moisture content (MC) were tested to assess the conditions favouring crop growth. Soil pH is crucial as it influences several soil factors that affect plant development, such as soil bacteria, nutrient leaching, nutrient availability, toxic elements and soil structure. Soil moisture content (SMC) determines the water content in the soil. The test results show an average pH and SMC of 5.83 and 22.25%, respectively.
3. METHODOLOGY
This section discusses two subsections: the overall layout of the smart greenhouse and the controller flowchart (Section 2.1) and heating system sizing (Section 2.2).
3.1. SGH simulation and controller layouts
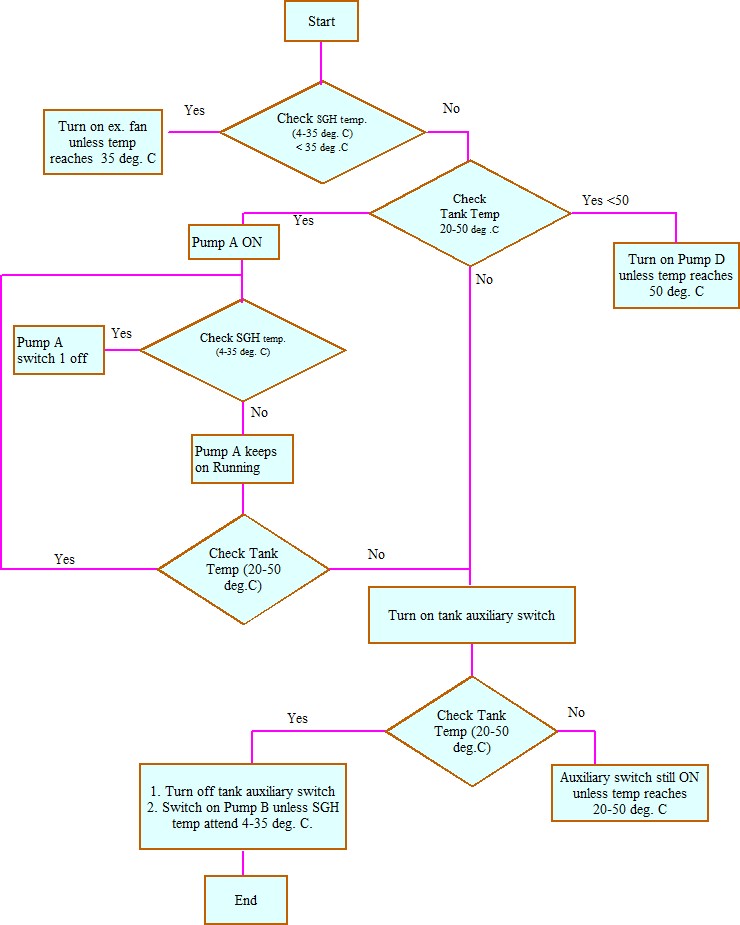
The site selection was based on the research objectives, leading to a colder region where all experiments were conducted during the off-season. Typically, the selected site becomes barren during winter, with a short cultivable duration. The proposed SGH aims to extend the usability of cultivable land. Before implementing the SGH at selected sites, a simulation was conducted to confirm construction material selection. Based on simulation results, SGH was constructed, and sensor threshold levels were set. The experiment was conducted during the winter season, from November 25th, 2022, to April 2023. Sensors and controllers were employed to maintain the required environmental conditions for the crops inside the SGH. Figure 4 illustrates the schematic control system of the SGH.
The temperature and humidity sensors are the important controller equipment in the SGH. When the temperature inside the SGH drops below 2 °C, the temperature sensor activates pump A, as shown in Figure 4. These temperature sensors are evenly distributed within the SGH. The optimal placement of the sensors is crucial to prevent false operation of the hot water circulation pump. If the temperature inside the SGH exceeds 35 °C, the switch connected to the exhaust fans, located at two edges of the SGH, is activated. This facilitates the exchange of hot air inside the greenhouse with the outside environment, bringing a cooling effect inside SGH.
Similarly, the humidity inside the SGH is maintained within 40% RH to 95% RH. If the humidity drops below 40% RH, the humidity sensor, optimally positioned inside the SGH, activates water Pump B to enhance humidity by sprinkling water inside the SGH. Pump B operates until the humidity level reaches 40% RH. If the humidity inside the SGH exceeds 95%, the exhaust fan is triggered to introduce dry air from outside the greenhouse. These settings of the controllers are based on Table 1 by selecting the minimum and maximum %RH required by crops.
In a study by Paradiso and Proietti (2022), it was emphasised that the quantity and quality of light affect plant growth. In the prototype developed, diffused light was provided during night hours. The light-dependent resistor (LDR) sensor was used as a switch to control the light automatically when the dark started. Figure 5 shows the detailed workings of temperature sensors and pump operation.
| Temperature (°C) | Humidity (%RH) | |||||
|---|---|---|---|---|---|---|
| Seasons | Maximum | Average | Minimum | Maximum | Average | Minimum |
| Winter | 35.4 | 14 | 0.9 | 97.4 | 86 | 60 |
| Summer | 53.2 | 23.2 | 0.8 | 97.1 | 70.7 | 17.7 |
3.2. Heating system sizing
The sizing of the heating system in the SGH faces a significant challenge due to heat loss through the glazing. The sizing of the heat source takes into account the temperature difference, glazing area (A), and the U-factor of the covering sheet. To perform the sizing of the SGH in a colder region, ambient temperature is necessary as a reference. The minimum temperature requirement for the crops is also mandatory for sizing the SGH. The following steps are followed for the heating system sizing:
- The minimum required temperature inside the SGH is 2 °C.
- Recorded data indicates the minimum outside temperature as −6 °C.
- The temperature difference (ΔT) is 8 °C.
- Heat loss through the glazing is calculated as ΔT × A × U-factor, resulting in 8.04 kW.
- Taking into account 10% system losses, the collector area is calculated as follows:Collector Area = Load Demand / (Collector Efficiency × Solar Irradiance) (8.04 + 0.804) kW / (0.69 * 4.5 kW/m2) 3.14 m2
| Temperature (°C) | Humidity (%RH) | |||||
|---|---|---|---|---|---|---|
| Seasons | Maximum | Average | Minimum | Maximum | Average | Minimum |
| Winter | 8.5 | 6.2 | −3.17 | 68.02 | 63.44 | 53.94 |
| Summer | 31.1 | 19.72 | 12.49 | 96.2 | 74.17 | 25.43 |
The minimum collector area required to heat the same air volume in one hour is 3.14 m2. Simulation results show peak heating is necessary from 4:30 AM to 6:30 AM, totalling two hours on average. Therefore, the recommended total collector area is 8 m2.
To determine the cooling system, the average maximum temperature at the selected site is 19.8 °C per the data recorded by the weather station installed at the project site. Simulation results indicate that the maximum temperature inside the SGH is 32.22 °C, while the plant’s temperature requirement is 35 °C. As a result, no cooling mechanism is needed. Practically, the temperature inside SGH crosses the limits, and no crops will grow during summer. The winter and summer maximum temperatures and humidity are given in Tables 2 and 3. Therefore, the cooling system should also be considered for the large-scale implementation.
4. RESULTS AND DISCUSSION
The performance of the SGH was analysed using sensors and data loggers. The 12 × 7.5 m smart greenhouse underwent experiments with various crop varieties on a small scale during the winter season. The primary aim of the research was to determine the growth of crops inside the smart greenhouse during the winter season. The initial stage of sowing seeds and the harvest period were recorded. The yield for selected vegetables experimented within the SGH could be reaped within 5 to 15 weeks.
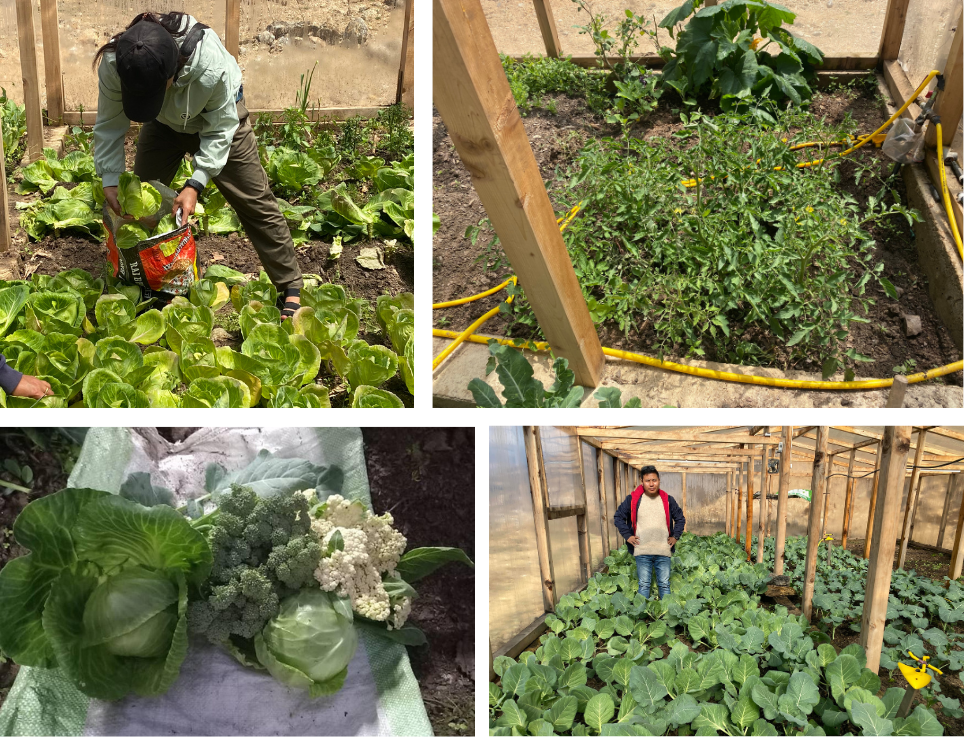
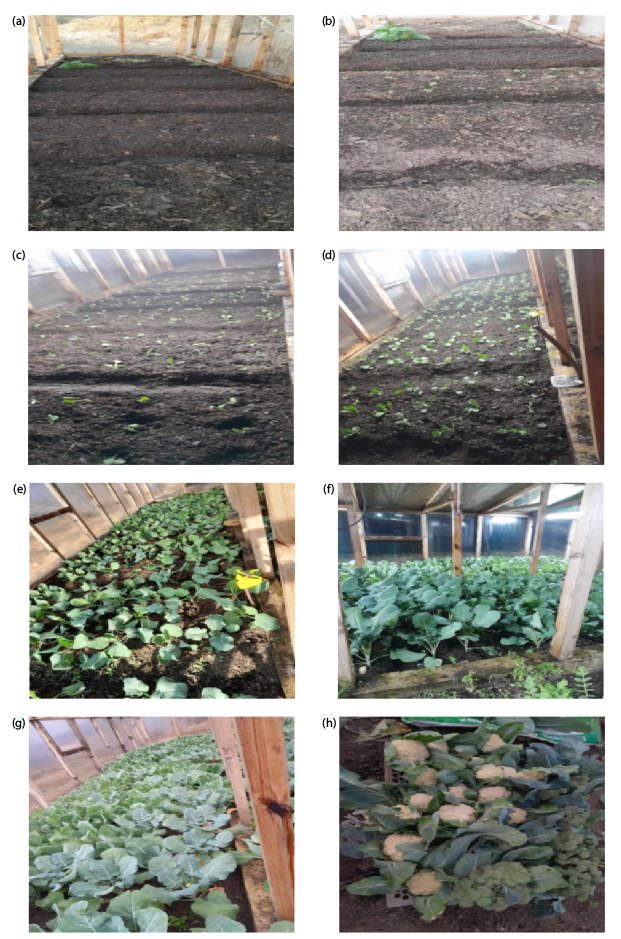
The crops experimented inside the SGH during the colder winter season are thriving. Figure 6 depicts broccoli, cabbage, radish, onion and chillies grown inside the SGH during the winter when the fields outside the SGH are barren.
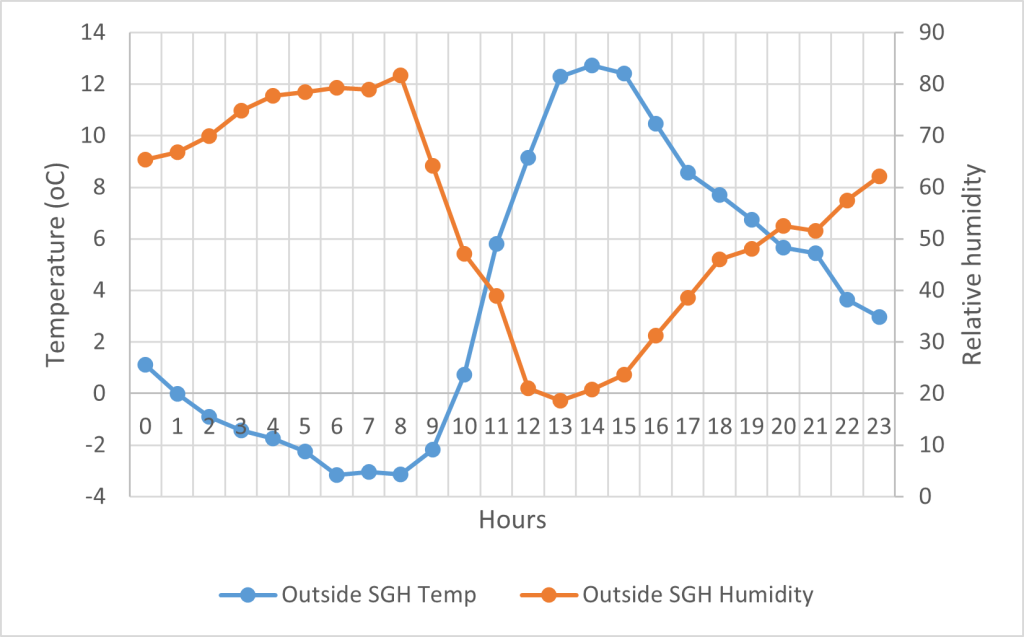
The significant environmental parameters that affect the growth of crops are light, temperature and humidity. The humidity content in the air also affects the soil moisture content. Therefore, all these parameters are recorded and compared with the outside ambient environment. Figure 7 shows an average temperature compared with the interior and exterior of the SGH in December and January 2023. With the help of an external heat source, the inside temperature of the SGH is improved. The minimum outside day temperature was recorded −3.17 °C in January and is presented in Figure 8. The greenhouse inside temperature was compared and shown in Figure 9.
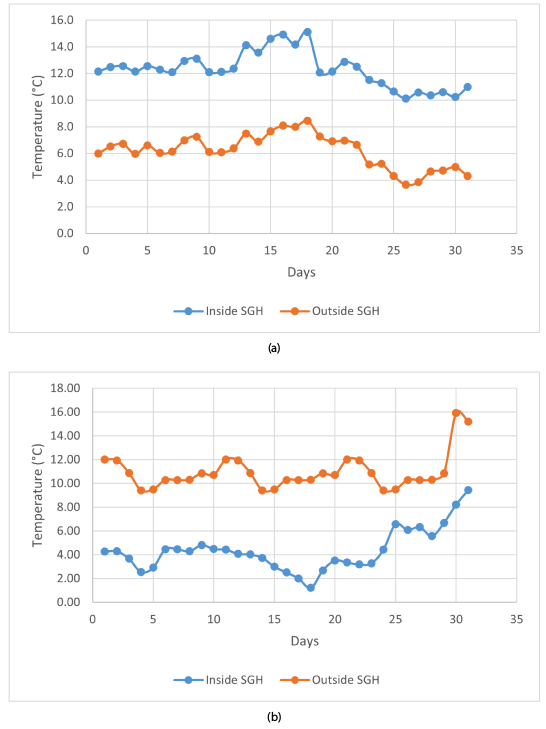
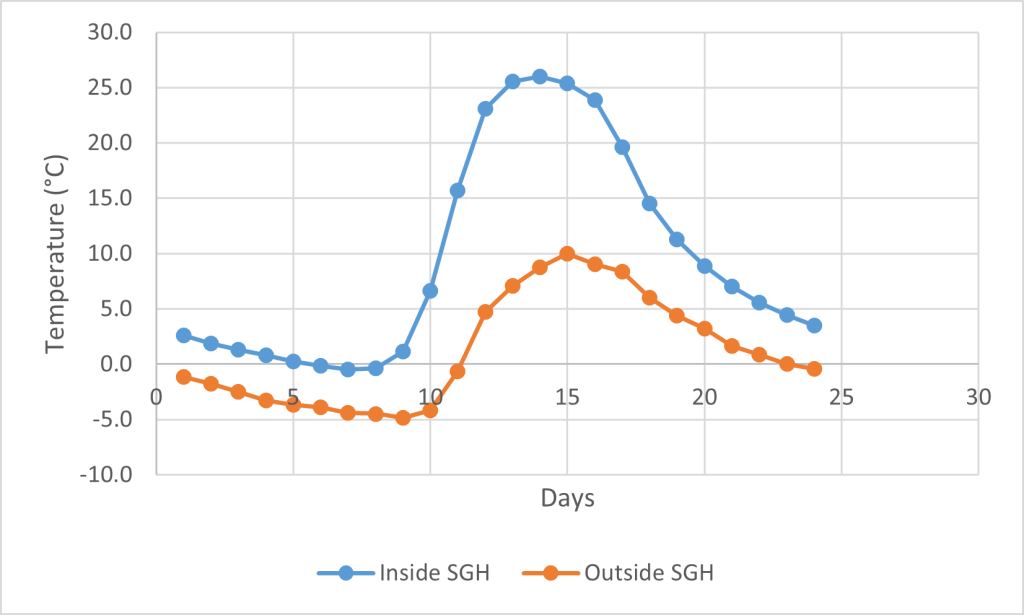
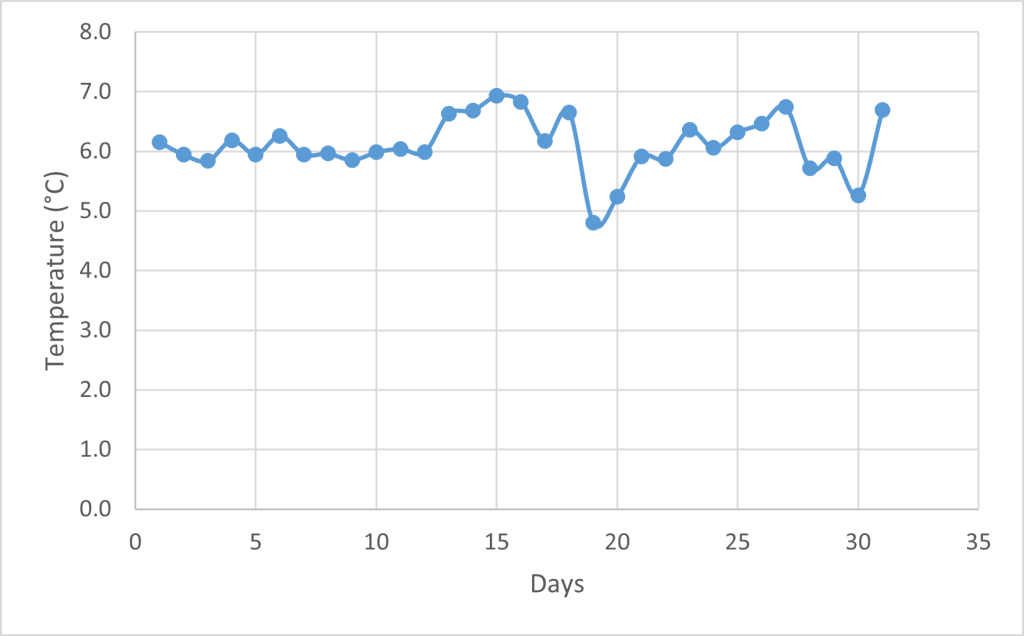
The temperature inside SGH is always high, as expected after applying interventions compared to the outside temperature. Similar comparisons were made for November, January, February, March and April. The data comparison reveals the SGH temperature is always higher by 7 °C on average with outside temperature, as depicted in Figure 9.
The humidity inside and outside of SGH is also recorded, as humidity plays a pivotal role in determining the soil moisture content. Figure 10 shows the daily average humidity during the peak cold winter months. The detailed performance data of SGH can be seen in Dorji et al. (2024).
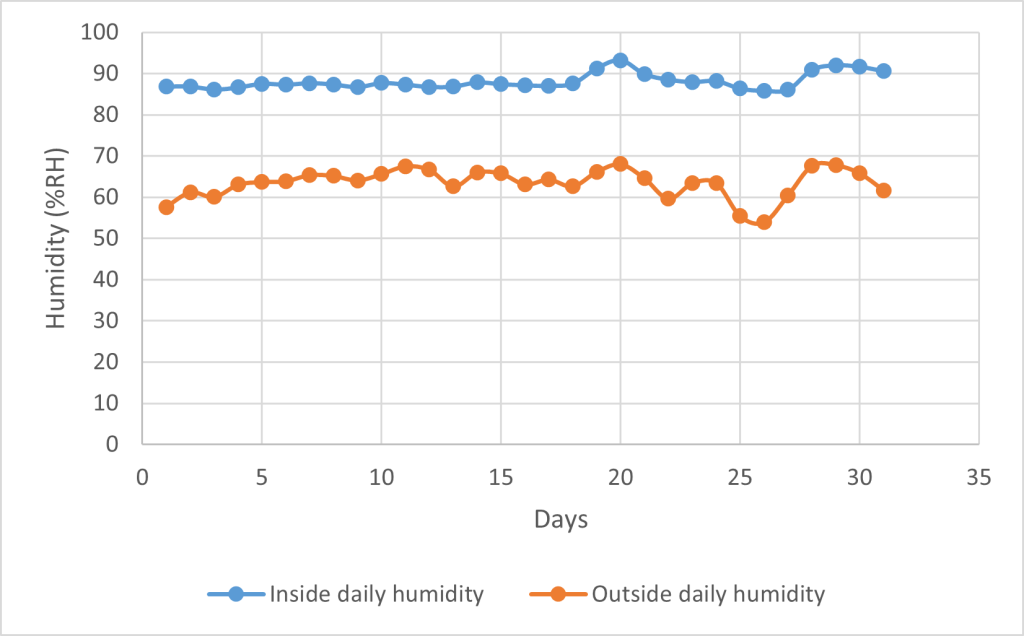
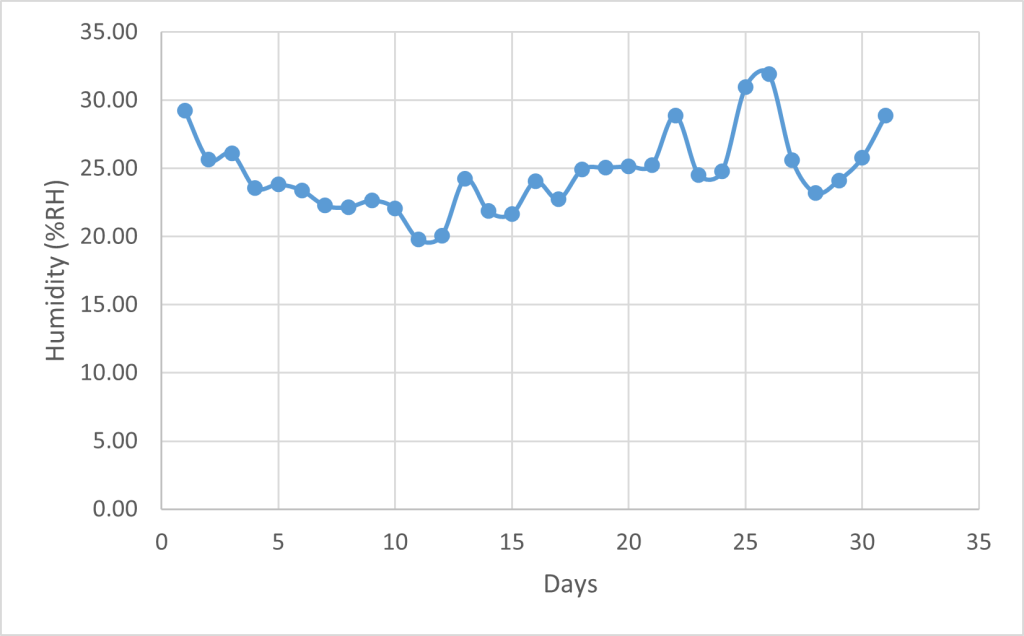
Figure 11 displays the daily average humidity difference for each day in December. On average, a humidity difference of 25% RH supports healthy seed germination and faster crop growth. It was also observed that there is a relationship between temperature and humidity: when the temperature drops, the moisture content in the air increases and vice versa. The increased humidity during low temperatures is attributed to the precipitation rate. Figure 12 illustrates the inverse relationship between temperature and humidity on one of the coldest days. Starting from midnight, the temperature decreases, and humidity increases.
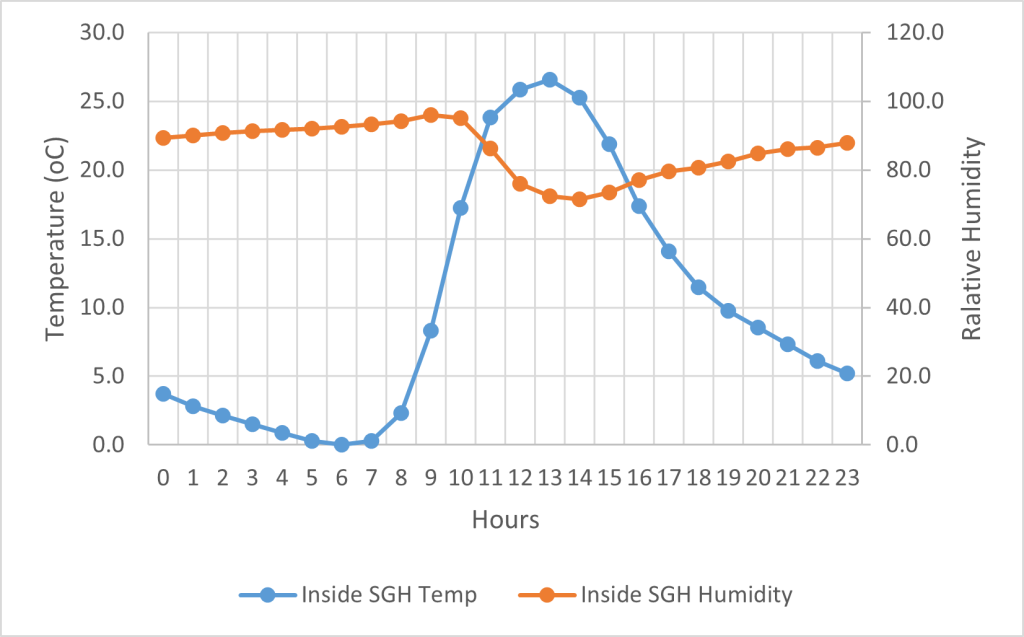
Inside the SGH (assuming this refers to a specific location), the inverse relationship is only observed during the day when the temperature rises, as shown in Figure 13. This indicates that the temperature inside the SGH consistently exceeds the ambient conditions outside.
5. CONCLUSION
The experimental findings from the implementation of the SGH prototype in Genekha, Thimphu, Bhutan, situated in a temperate region, offer insights into its performance concerning both environmental conditions for crops and their growth.
The SGH operates without an external heating source during the daytime. However, when temperatures drop below freezing, the hot water circulation pump activates, providing necessary heating, primarily during the early morning hours. The integration of SWHS (Solar Water Heating System) significantly improves the SGH environment, fostering favourable conditions for crop growth. This accomplishment aligns with the research objective of converting underutilised winter lands in temperate regions into year-round cultivable spaces. This expanded cultivation area is poised to enhance land utilisation rates and subsequently improve food production.
Throughout the experimentation, a notable average temperature difference between the interior and exterior of the SGH was observed. On average, the interior temperature of the SGH increased by 7 °C during winter, indicating its suitability for scaling up SGH initiatives across the region.
The temperature and relative humidity data analysis shows an inverse correlation between the two. As the temperature increases, the relative humidity decreases since water turns into vapour and evaporates inside the greenhouse, as shown in Figures 12 and 13.
Multiple crop experiments were conducted, and their results are shown in Figure 6. While supplementary light via LDR sensors was provided to accelerate crop growth, certain crops, such as cucumber, exhibited fruiting tendencies when subjected to minimal light exposure. Upon adjusting the lighting based on relevant literature, the cucumber started fruiting after a few weeks without light exposure.
Moreover, the SGH demonstrated the ability to expedite seed germination and growth periods. For instance, broccoli, cabbage, spinach and cauliflower sown on November 12th, 2023, showed rapid germination within a week as shown in Figure 14, while the harvesting periods remained consistent. In the experiment inside greenhouse, it took 115 days to sow and reap the harvest.
Vegetables such as chillies and beans grew well, but fruiting was not observed due to the high temperature inside the greenhouse as SGH temperature was set between 2 °C and 35 °C, which is generic for all crops. The general parameter setting for SGH is one of the limitations of this research. To get a clear picture of individual crop’s growth characteristics, each greenhouse should experiment with only one vegetable species and classify the same family crops.
It is imperative to note that this report did not delve into a cost-benefit analysis of the project. However, this area presents an avenue for future exploration and consideration.
6. ACKNOWLEDGEMENT
The authors would like to thank the Asia Pacific Network for Global Change Research (APN) for funding the CRRP2021-07MY-Dorji project. This fund helps procure components required for smart greenhouse project development, including solar collector systems, sensors, greenhouse structure, and covering materials. The authors also would like to thank the Electrical Engineering Department, College of Science and Technology, Jigme Namgyel Engineering College, City University, Kathmandu University and Bangabandhu Sheikh Mujibur Rahman Agricultural University for aspiring faculty to work on this project.
Lastly, the authors would like to thank the publishing team for thoroughly reviewing the manuscript and making a presentable paper.