
CRRP2016-02MY-Santisirisomboon
Future changes in mean and extreme precipitation over Peninsular Malaysia using CORDEX-SEA 5 km simulations
Keywords
CMIP5 · CORDEX-SEA · Downscaling · Peninsular Malaysia · Precipitation · Southeast Asia
HIGHLIGHTS
- High-resolution climate data is made available for key areas in Southeast Asia.
- Further downscaling improves simulated precipitation over Peninsular Malaysia.
- Peninsular Malaysia is projected to have a drier future climate.
1. INTRODUCTION
The CORDEX (Coordinated Regional Climate Downscaling Experiment) programme under the World Climate Research Program (WRCP) plays a crucial role in advancing our understanding of climate change impacts at regional scales (Giorgi, 2019). Aiming to provide high-resolution multi-model climate projections and fulfil climate model data requirements in Southeast Asia (SEA), CORDEX-SEA was established (Tangang et al., 2022). In the first phase implementation of CORDEX-SEA, 11 General Circulation Models (GCM) from the Coupled Model Intercomparison Project phase 5 (CMIP5) were successfully downscaled using seven different regional climate models (RCMs) at a spatial resolution of 25 km (Tangang et al., 2020). The CORDEX-SEA phase 1 product is essential for policymakers, planners and scientists to make informed decisions and develop effective adaptation strategies to mitigate the effects of climate change on local communities. The CORDEX-SEA phase 1 product has contributed to many research articles, national reports and even the most recent Intergovernmental Panel on Climate Change (IPCC) sixth assessment report (AR6).
The CORDEX-SEA phase 2 programme is intended to extend the achievement of phase 1 by further downscaling the 25 km output to a finer 5 km resolution. This enabled the modelling of fine-scale climate features such as extreme events and may improve understanding of the complex interactions between climate, ecosystems and human systems (Hewitson & Crane, 2006). However, the resources needed for such a feat are unbearably high. Thus, the CORDEX-SEA phase 2 5 km downscaling exercise only focussed on four key climate change vulnerable areas in Southeast Asia (Figure 1), namely the Lower Mekong River basin (A) (Hoang-Cong et al., 2022), Mindanao Island of the Philippines (B), Peninsular Malaysia (C) and Java Island of Indonesia (D).
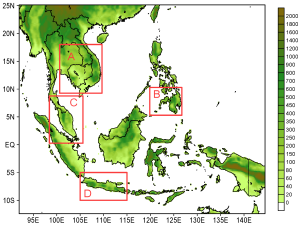
The 5 km downscaling conducted by the CORDEX-SEA phase 2 programme over Peninsular Malaysia enables a proper examination of the future changes in extreme precipitation in this area. Located in Southeast Asia, Peninsular Malaysia houses the capital of Malaysia, i.e. Kuala Lumpur. It also serves as a crucial gateway to the Southeast Asia region and offers easy access to international trade routes. It’s diverse geography provides crucial ecological services that support various industries, such as tourism and agriculture. There is evidence of increasing trends in extreme precipitation over Asia during the last few decades (Choi et al., 2009; Donat et al., 2013; Supari, Tangang, Juneng, & Aldrian, 2017), and this trend is expected to continue as the climate continues to warm. Over Peninsular Malaysia, observational evidence indicates that rainfall extremes have also intensified in recent decades, particularly in the frequency and intensity of heavy rainfall events (Syafrina, Zalina, & Juneng, 2015). Such intensification of rainfall extremes has implications for various socio economic sectors in the country, including agriculture, water resources and infrastructure, and can lead to flooding and landslides.
Having reliable information on future changes in extreme precipitation will be imperative for local policymakers and stakeholders to draw up strategies for adapting and mitigating the potential negative impacts of such a change. Thus, capitalising on the very high-resolution downscaling simulation carried out by the CORDEX-SEA phase 2 programme over Peninsular Malaysia, this study aims to examine the future changes in selected extreme rainfall indices over this area under the IPCC Representative Concentration Pathways Scenarios (RCP) 4.5 and 8.5.
2. METHODOLOGY
2.1. CORDEX-SEA phase 2 simulations
The 5 km × 5 km downscaling simulations over Peninsular Malaysia conducted under the CORDEX-SEA phase 2 programme (Figure 1) were carried out by downscaling the three best performing 25 km × 25 km RegCM4 downscaled simulations from the first phase of SEACLID/CORDEX-SEA programme (Tangang et al., 2020). These simulations are the runs driven by EC-Earth, HadGEM2-ES and MPI-ESM-MR.
The regional climate model (RCM) used in the 5 km downscaling simulation is the newer non-hydrostatic RegCM4.7 (RegCM4.7-NH) (Coppola et al., 2021) developed by International Centre for Theoretical Physics (ICTP). The conducted 5 km downscaling simulations cover the historical period of 1971–2005 and three future time slices, i.e., the early (EC; 2012–2039), mid (MC; 2041–2069) and late 21st century (LC; 2071–2099) considering both RCP 4.5 and RCP 8.5 future scenarios (Table 1). Initial and boundary conditions (ICBC) for the 5 km simulations were interpolated from the 6-hourly output of the first phase CORDEX-SEA 25 km simulations.
| GCM | RCP | Simulated Period | Abbreviation |
|---|---|---|---|
| EC-Earth (EC-Earth consortium) | 4.5 & 8.5 | Hist: 1971–2005 | ECE |
| EC: 2012–2039 | |||
| MC: 2041–2069 | |||
| LC: 2071–2099 | |||
| HadGEM2-ES (Hadley Centre, UK) | Had | ||
| MPI-ESM-MR (MPI-M, Germany) | MPI |
The RCM and the model physical settings used in the CORDEX SEA phase 2 simulations and their forcing 25 km CORDEX-SEA phase 1 simulation are summarised in Table 2.
| Phase 2 (Malaysia) | Phase 1 | |
|---|---|---|
| RCM used | RegCM4.7-NH | RegCM4.3 |
| Model dynamic core | MM5 Non-hydrostatical core | MM4 hydrostatical core |
| Horizontal resolution | 5 km × 5 km | 25 km × 25 km |
| Number of vertical levels | 18 | 18 |
| Domain simulated | Peninsular Malaysia | Southeast Asia |
| Cumulus parameterisation scheme | MIT-Emanuel (Emanuel & Živković-Rothman, 1999) over land and Kain-Fritsch (Kain, 2004; Kain & Fritsch, 1990) over ocean | MIT-Emanuel |
| Boundary layer scheme | Holtslag (Holtslag, De Bruijn, & Pan, 1990) | Holtslag |
| Moisture scheme | SUBEX (Pal et al., 2007) | SUBEX |
| Ocean flux scheme | Zeng (Zeng, Zhao, & Dickinson, 1998) | Zeng |
| Cloud fraction algorithm | SUBEX | SUBEX |
| Radiation scheme | CCSM (Kiehl et al., 1996) | CCSM |
| Land surface scheme | CLM4.5 (Oleson et al., 2013) | BATS1e (Dickinson, 1993) |
2.2. Model performance and projected future precipitation extreme analysis conducted
The model performances were first analysed by comparing the simulated precipitation climatology to that of reference data to quantify the model’s biases. In this assessment, the 25 km simulations will also be included to visualise the improvement the 5 km simulations would have over their respective simulation forcings. Aside from model biases, the annual precipitation cycle simulated by the 5 km simulations, the 25 km forcing simulations and observed by reference data will also be compared. The reference data of choice in this study is that of Climate Hazards Group InfraRed Precipitation with station data 2.0 at 5 km resolution (CHIRPS05) (Funk et al., 2015), which has been shown to perform reasonably well over the study area (Ayoub, Tangang, Juneng, Tan, & Chung, 2020). Another reason CHIRPS05 data was chosen as the preferred reference data is that its 5 km resolution matches that of the CORDEX-SEA phase 2 simulations.
Analysis of future projections of precipitation extremes over Peninsular Malaysia was then carried out by evaluating future changes for near, middle and end of the 21st century for each of the emission scenarios using an ensemble created from all the 5 km simulations following the approach used by Supari et al. (2020) and Tangang et al. (2020). Under this approach, all ensemble members will have an equal weightage in the ensemble created. This analysis used the extreme climate indices based on the Expert Team on Climate Change Detection and Indices (ETCCDI) (Zhang et al., 2011). Table 3 indicates the list of these ETCCDI indices used. Maps of projected changes in extreme precipitation relative to the historical period are made.
| Indices | Description |
|---|---|
| CDD | The maximum length of dry spell, maximum number of consecutive days with precipitation <1 mm in a season |
| CWD | Maximum length of wet spell, maximum number of consecutive days with precipitation ≥1 mm in a season |
| R20mm | Count of days when precipitation ≥20 mm in a season |
| RX1day | Maximum consecutive 1-day precipitation in a season |
3. RESULTS AND DISCUSSION
3.1. Model evaluation and comparison between CORDEX-SEA phase 1 and 2 simulations
This section describes the performances of CORDEX-SEA phase 2 5 km simulations compared to those of CORDEX-SEA phase 1 25 km in simulating seasonal precipitation over Peninsular Malaysia. Figure 2 shows the biases of 25 km and 5 km simulations for DJF (wet season) and JJA (dry season) over Peninsular Malaysia during the historical period.
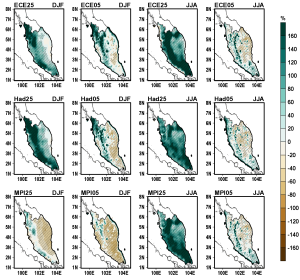
The comparison between precipitation biases in the 5 km and 25 km simulations shows that generally, for both seasons, the biases have been significantly reduced in the 5 km simulations compared to that of the 25 km. This reduction in biases in the 5 km simulations can be attributed to the newer combination of model physics schemes used: the cumulus parameterisation scheme (CPS) was changed from MIT-Emanuel to that of MIT-Emanuel over land and Kain-Fritsch over the ocean, and land surface scheme from Biosphere–Atmosphere Transfer Scheme version 1e (BATS1e) to that of Community Land Model version 4.5. The change in the model physics schemes was made because the CPS MIT-Emanuel and land surface scheme BATS1e combination used in the CORDEX-SEA phase 1 tend to cause the RegCM4 to consistently produce strong precipitation in the Southeast Asia region (Chung, Juneng, Tangang, & Jamaluddin, 2018). While general improvements have been made in the 5 km simulations after replacing the model physics schemes combination, wet biases can still be seen along the coast and the mountainous areas. These imperfections can be attributed to these in the CHIRPS05 itself.
Figure 3 depicts the observed and simulated precipitation annual cycle by CHIRPS05, 5 km and 25 km simulations over two sub-regions in Peninsular Malaysia. The two sub-regions, R1: west coast of Peninsular Malaysia, and R2: east coast of Peninsular Malaysia, were divided based on the distinct precipitation annual cycle pattern shown (Wong et al., 2016). Whereby the precipitation annual cycle pattern over R1 shows a bimodal pattern while that of R2 shows a unimodal pattern, as demonstrated by CHIRPS05 (Figure 3).
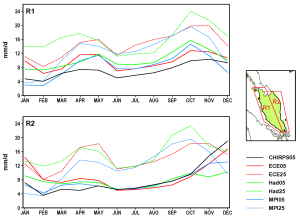
From the plots shown in Figure 3, it can be seen that both the 25 km and 5 km simulations accurately captured the bimodal precipitation annual cycle of sub-region R1. Of course, due to the 5 km simulations having much smaller precipitation biases than 25 km, the amplitude of the annual cycle simulated matches CHIRPS05 better. The most significant discrepancy between the 25 km and 5 km simulations in reproducing the annual precipitation cycle lies in the R2 sub-region. It can be seen that all the 25 km simulations could not faithfully capture the unimodal precipitation annual cycle pattern in this region, unlike that of the 5 km simulations. Thus, by increasing the model horizontal resolution from 25 km to 5 km, the originally missing east-west precipitation contrast of Peninsular Malaysia can be correctly simulated by the model. This could be due to the reason that the 5 km simulations can more faithfully represent the complex mountainous range that separates Peninsular Malaysia into east and west coasts than the 25 km simulations. Hence, the comparison suggests that increasing the horizontal resolution from 25 km to 5 km can improve the precipitation simulations, consistent with other studies (Kim, Kim, & Cha, 2022; Ngai et al., 2020; Tuju, Ferrari, Casciaro, & Mazzino, 2022).
3.2. Projected changes in mean and extreme precipitation
The changes in mean and extreme precipitation (which includes CDD, CWD, R20mm and Rx1day) over Peninsular Malaysia projected by the ensemble of ECE05, Had05 and MPI05 for each of the 21st century future periods were plotted and shown as Figures 4 to 8. Figure 4 shows the projected mean DJF and JJA precipitation changes under RCP 4.5 and RCP 8.5 for EC, MC and LC periods.
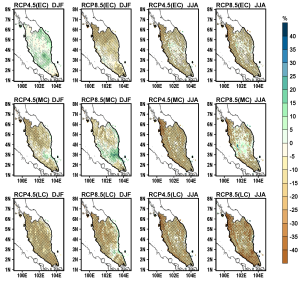
In terms of seasonal mean precipitation (both DJF and JJA), the projections show that there will be a general tendency for gradual dryness over Peninsular Malaysia in the coming future (Figure 4). This dryness tendency will occur under RCP 4.5 and RCP 8.5 futures, which is stronger under the RCP 8.5 scenario. Such results are consistent with those of Kang, Im, and Eltahir (2019) and Tangang et al. (2020). In the EC period, decreases in mean JJA rainfall can be up to 10–15%, especially under RCP 8.5. The level of dryness appears to be higher over the northwestern region of Peninsular Malaysia. During DJF, however, some areas are projected to have increased rainfall for RCP 4.5. Increased mean rainfall is also projected in southern and interior parts of Peninsular Malaysia during the MC period, including RCP 8.5. By the LC period, for both RCPs, the mean rainfall is projected to show a decreasing pattern.
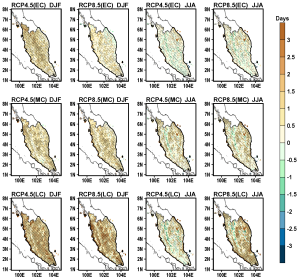
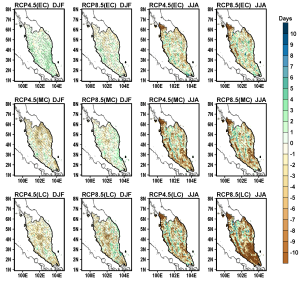
The drying tendency of Peninsular Malaysia in the RCP 4.5 and RCP 8.5 futures is also reflected in the precipitation extremes (Figures 5–8). Alongside the decrease in mean precipitation, an increase in the future CDD is projected (Figure 5). This indicates that the future periods will have longer dry days, especially by the 21st-century MC and LC periods. These projected CDDs are consistent with those of Supari et al. (2020). This general increase in CDD in the future matches well with the projected decrease in CWD (Figure 6). This reduction in CWD is pronounced over the southern region of Peninsular Malaysia during the JJA season in the LC period of RCP 8.5. Consequently, this increase in CDD while a decrease in CWD explains the decrease in the mean precipitation. Nevertheless, a slight increase in CWD during the EC period can also be seen for the DJF season under RCP 4.5.
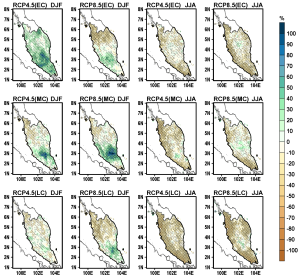
Similar to CDD and CWD, the projected changes in R20mm show a general reduction in frequency in the future periods of both RCP 4.5 and RCP 8.5 futures when compared with the historical periods, particularly during MC and LC of the 21st century (Figure 7). This indicates that Peninsular Malaysia, especially the west coast, will be experiencing fewer days with very heavy precipitation.
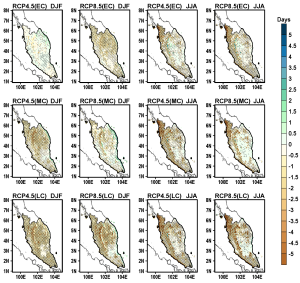
Unlike other indices, the intensity index, Rx1day, shows mixed projected changes in future periods. In the EC period, increased intensity of extreme precipitation during DJF is projected under the RCP 4.5 scenario. A general increase in Rx1day can be seen throughout Peninsular Malaysia. This increase of Rx1day slowly reduced as the 21st century progressed. By the MC period, this increase of Rx1day will only be confined to the southern region of Peninsular Malaysia, and by the LC period, Rx1day generally shows a decreasing pattern. For the RCP 8.5 scenario, this increasing-decreasing tendency of Rx1day during DJF is relatively consistent through the 21st century, where a decreasing tendency will generally be found over the northern region of Peninsular Malaysia, while over the southern region of Peninsular Malaysia, the Rx1day typically showing an increasing tendency. Unlike DJF, JJA Rx1day showed a gradual decreasing tendency throughout the century, especially over the west coast of Peninsular Malaysia. This decrease in Rx1day appeared stronger under the RCP 8.5 scenario than that of RCP 4.5.
4. CONCLUSION
The CORDEX-SEA phase 2 aims to bring the achievements of CORDEX-SEA phase 1 further by providing regional climate change information at a much higher resolution over four key vulnerable areas in the Southeast Asia region. For this purpose, three CORDEX-SEA phase 1 downscaled CMIP5 GCMs (i.e., ECE, Had and MPI) were further downscaled to 5 km × 5 km resolution. The CORDEX-SEA phase 2 simulations were used to investigate changes in seasonal mean and extreme precipitation over Peninsular Malaysia.
Model bias and annual cycle analysis show that the phase 2 simulations generally show improvement over the phase 1 simulations. The phase 2 simulations tend to have much smaller precipitation biases than phase 1. This decrease in bias can be attributed to the newer physics schemes combination used. That said, the phase 2 simulations are not entirely bias-free. Aside from the improvement in biases, these higher resolution simulations were noticeably able to correctly reproduce the annual precipitation cycle over the east coast of Peninsular Malaysia, which the 25 km simulations had failed to do. Moreover, due to the phase 2 simulations having lower precipitation bias, the simulated amplitude of annual precipitation cycles matches that of reference data (i.e., CHIRPS05) better.
An ensemble was created from the three downscaled simulations to assess the projected changes in mean and extreme precipitation over Peninsular Malaysia. Analysis suggests that Peninsular Malaysia will be experiencing a decrease in mean precipitation, especially during the MC and LC periods for both RCP 4.5 and RCP 8.5 scenarios. Aside from the decrease in mean precipitation, CDD is showing an increasing tendency, while CWD is showing a decreasing tendency, suggesting Peninsular Malaysia will be experiencing a long dry spell in the future. At the same time, the frequency of very heavy rainfall (R20mm) is projected to decrease as the 21st century progresses, regardless of the RCP 4.5 or RCP 8.5 scenarios. For Rx1day, the projected future changes show a somewhat mixed signal for DJF but generally show a decreasing trend for JJA. The analysis results from this study imply that Peninsular Malaysia will likely become drier in the future, not limiting to its mean precipitation but the extremes as well. This raises concern because of potential severe implications on the socio-economy of Malaysia, such as in the agricultural and energy sectors, which are highly dependent on the availability of water resources.
Policy development, decision-making processes, and infrastructure planning to enhance adaptation and mitigation strategies must take into account the climate change projection information. Impact modelling communities can utilise the data to assess sector-specific vulnerabilities and the effectiveness of interventions, while planners and engineers can design resilient infrastructure systems and develop localised adaptation measures. However, it is essential to acknowledge the limitations and uncertainties associated with the projections. Future initiatives will prioritise fostering more collaborative studies with potential CORDEX-SEA data users within Southeast Asia to establish best practices in utilising the downscaled projection datasets in addressing climate change challenges.
5. ACKNOWLEDGEMENT
This research is funded by the Asia-Pacific Network for Global Change Research (CRRP2016-02MY-Santisirisomboon) with additional support from the Ministry of Higher Education (MoHE) Malaysia under the Long-Term Research Grant Scheme (LRGS1/2020/UKM/01/6/1), the High-definition Clean Energy, Climate, and Weather Forecasts for the Philippines project, and the Vietnam National Foundation for Science and Technology Development (NAFOSTED) Grant (105.06-2021.14).