Future changes in growing degree days of wheat crop in Pakistan as simulated in CORDEX South Asia experiments
Keywords
Agriculture · Climate change · Food security · Growing Degree Days (GDD) · Temperature · Wheat
Highlights
- Global warming in the coming years is expected to impact food security.
- Growing Degree Days (GDD) is an important parameter determining the crop development.
- Southeastern parts of Pakistan are likely to become unsuitable for wheat production due to temperature extremes over the mid-century.
1. Introduction
Temperature extremes are a global phenomenon having serious consequences, particularly in the agriculture sector, where it has considerably affected production in most of the developing countries (Elum, Modise, & Marr, 2017). This has created a highly vulnerable situation of food insecurity, especially in agrarian countries. In Pakistan, agriculture is one of the most important sectors that contributes about 18.5% to the GDP and provides occupation to more than 51% of the population. The principal crops include wheat, rice, sugarcane, cotton and maize. As in many other parts of the world, wheat is a popular cereal crop in Pakistan used as a staple food. Wheat, in Pakistan, holds high importance among all other cereal crops as it accounts for 8.9% value addition in agriculture and 1.6% in overall GDP with an area of 8.74 m ha under cultivation (Government of Pakistan, 2019). Despite being cultivated on such a large scale, wheat yields have undergone huge fluctuations since the year 2000 due to climatic uncertainties. Climate change, over time, has emerged as a key environmental concern. The cyclic pattern of weather has changed principally as a result of a rise in temperature which is one of the impacts of elevated concentrations of greenhouse gases in the atmosphere (Ahsan et al., 2010). The projections given by the Intergovernmental Panel on Climate Change (2014) have estimated that if the greenhouse gas emission rates continue to accelerate, an increase of 1.5 to 4.5°C is expected by the year 2100. In contrast, Hansen, Sato, and Ruedy (2012) have reported, based on their estimations, a 0.18°C increase in average surface temperature every decade during the 21st century. Production in the agriculture sector is under serious threat due to the change in climatic trends all over the globe (Hu, Weiss, Feng, & Baenziger, 2005; Ding et al., 2006; Tao, Yokozawa, Xu, Hayashi, & Zhang, 2006; Iqbal et al., 2009; Semenov, 2009; Liu et al., 2010; van Ogtrop, Ahmad, & Moeller, 2014; Ahmad & Hussain, 2015; Ahmad et al., 2017: Dettori, Cesaraccio, & Duce, 2017; Abbas et al., 2017; Liu et al., 2018).
Increased temperature can have dire effects on crop productivity, and particularly, winter crops which show highly sensitive behaviours towards temperature change. Wheat appears to be one of the crops showing a higher degree of susceptibility towards temperature changes (Singha, Bhowmick, & Chaudhuri, 2006; Hundal, 2007; Pandey, Patel, & Patel, 2007). Climate change can cause up to 17% decrease in cereal yield, which is a severe reduction in the harvest as a consequence of elevated temperatures (Lobell, Bänziger, Magorokosho, & Vivek, 2011). Crop productivity either directly or indirectly bears the negative consequences of climate change, and the situation becomes inevitably serious in agrarian countries like Pakistan. It has been demonstrated in the study conducted by Aslam et al. (2017) that 1°C may cause a decrease of 4.1 to 6.4% in wheat yields. Zhao et al. (2017), Iqbal and Arif (2010) and Hussain and Muddasser (2007) reported similar findings. High temperatures, above the thresholds, is one of the main reasons for the reduction in wheat yield. The optimum temperature ranges for the wheat crop during anthesis and grain filling stage is from 12 to 22°C. If wheat is exposed to temperatures higher than 30°C at the time of anthesis or grain filling, it can have adverse effects resulting in a massive reduction in wheat yields (Nuttall, Barlow, Delahunty, Christy, & O’Leary, 2018; Farooq, Bramley, Palta, & Siddique, 2011; Porter & Gawith, 1999).
The growing degree days (GDD) is considered an important parameter determining the crop growth and development under different temperature regimes (Kalra et al., 2008; Kingra & Kaur, 2012; Meena & Rao, 2013). It assumes a direct and linear relationship between growth and temperature (Nuttonson, 1955). The crops sown on the recommended time have a higher heat requirement than those of later sown crops. This happens because of the lower temperatures during the early vegetative growth stages and comparatively higher temperatures at the time of reproductive stage (Khichar & Niwas, 2007).
This study is designed to assess the increasing daily maximum as well as minimum temperatures and to determine the impacts of rising daily mean temperature on heat requirements of wheat crop in wheat-growing zones all over Pakistan. The study applies RCP 4.5 and RCP 8.5 over two future time-slices, i.e. near-century and mid-century using the CORDEX datasets.
2. Methodology
2.1 Site selection
Pakistan is predominantly an arid country. The country area is divided into 10 Agro-Ecological Zones (AEZ) based on physiography, climate, land use and water availability. The main limitation for the development of agriculture in Pakistan is water shortage under high temperatures and aridity. Eighty out of the 131 districts (61%) in Pakistan encounters food insecurity and almost half (48.6%) of the population does not have access to sufficient food to have an active and healthy life.
Wheat is the first Rabi crop grown in the semi-arid, arid and rain-fed areas of Pakistan during the winter season. As the dietary staple of Pakistan, supplying 72% of caloric energy in the average diet, wheat ranks first among all the crops in the area under cultivation and production. This fact signifies its role in ascertaining food security at the national scale. In Pakistan, wheat sowing is usually carried out from mid-October to December and harvest from mid-March until mid-May. Figure 1 shows the selected case study sites in Pakistan.
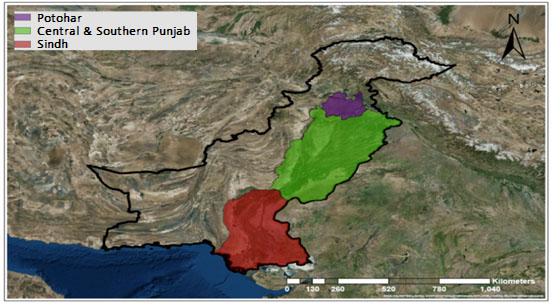
The climate of central and southern Punjab is categorized as dry semi-arid agro-climate, a highly productive agricultural zone due to fertile soils and well-managed canal irrigation system. Wheat crop produced in the Punjab province contributes to almost 75% of the total production in Pakistan.
The province of Sindh ranks second in wheat production. Wheat cultivated areas in lower Sindh are located in the irrigated plains which are fed by fertile alluvium soils deposited by the Indus River. Sindh has a hot and arid climate, with shorter growing season length and higher crop water demands as compared to the northern and central parts of the country. The growth duration of the wheat crop has a thermal dependency; short duration varieties are preferred for cultivation in the southeastern part, which matures in 100 to 120 days. Owing to climatic variations, crop periods range from November to March in lower parts and December to April in the upper plains.
The climate of Potohar region possesses semi-arid features in the southwest and sub-humid in the northeast. In a pluvial rain-fed region like Potohar, wheat cultivation depends on the available soil moisture at the time of sowing. Consequently, prolonged dry spell and late rain can drastically reduce crop yields. This region is considered to be the third-largest wheat contributor to national production.
2.2 Data
2.2.1 Baseline period and future scenarios
For the validation analysis, the baseline period was selected from 1981 to 2005 (25 years). Data of two climate change emission scenarios, Representative Concentration Pathways (RCPs) namely, Medium Controlled scenario RCP 4.5 and Business-as-usual scenario RCP 8.5 were evaluated for two future periods, near-century F1 (2006 – 2040) and mid-century F2 (2041 – 2070) periods.
2.2.2 Observed and reanalysis data set
Observed station data acquired from the Pakistan Meteorological Department (PMD) for the selected study sites were used to validate the selected reanalysis data.
Gridded data set (Harris, Jones, Osborn, & Lister, 2014) from the Climatic Research Unit (CRU), University of East Anglia, UK, was used as reference data to validate climate model data sets for observed climatology and model biases of monthly mean minimum and maximum temperatures over the historical period. Similarly, Reanalysis-gridded data, NASA-MERRA-II, was used for validation purpose for the period 1981 to 2005 for Tmin and Tmax over a daily time scale.
2.2.3 Model data
Six simulations using the Conformal Cubic Atmospheric Model (CCAM) (developed by the Commonwealth Scientific and Industrial Research Organization (CSIRO)) were driven using the lateral boundary conditions of six Global Climate Models were validated against CRU over the historical period. These six simulations showed an almost comparable degree of biases over selected study sites over space and time. Subsequently, an ensemble approach was used, and all six CCAM simulations driven by six different GCMs were averaged using grid points of all dimensions for the selected variable. Ensemble approach was helpful to smooth the positive and negative biases and also to minimize errors.
2.3 Data analyses and techniques
Data analyses include plotting mean monthly biases of regional climate model data set with respect to reference data CRU for minimum and maximum temperature over Rabi season (Nov-May). Data is subset to a specified local region (Pakistan), and temporal and spatial interpolation was performed onto a common spatial grid using the bilinear interpolation scheme.
Growing Degree Day (GDD) bias was calculated for the historical period with reference to the MERRA data. Future projections of GDD were calculated. For calculating GDD, the first unit of the RCM data was converted from degree Fahrenheit to degree Centigrade. Later, the Rabi season was constructed which consisted of seven months, i.e. November to May. Seasonal aggregation was performed using Climate Data Operators (CDO) by first selecting November and December months from the year 1980/2004 and January, February, March, April, May from year 1981/2005. Both files were merged temporally, and resulting data were shifted ahead by two months in order to get 25-year data with all months of a season in every single year. In the next step, GDDs were accumulated in an individual season by first splitting all the years, each one containing daily values of GDD of the whole season (Nov-May), which were then added together to obtain the sum of a single season. Lastly, all seasons’ calculations were merged to gather to get a single file of 25 years daily accumulated GDD during the Rabi season. Accumulated Growing Degree Days (GDD) were calculated using a base temperature of 5°C with the help of the following equation,
\(GDD_{k} = \sum_{n=1}^{D}max \left \{ \left (\frac{TMAX_{nk}+TMIN_{nk}}{2}-B\right ), 0 \right \} \)
where \(GDD_{k}\) is the growing degree days accumulated through the growing season for the k-th weather station, \(TMAX_{nk}\) and \(TMIN_{nk}\) are defined as the maximum and minimum temperatures, respectively, for the n-th day of the m-th month for the k-th weather station, \(B\) is a baseline temperature below which it is assumed that no growth occurs, and \(D\) represents the number of days in the growing season.
3. Results and discussion
3.1 Observed climatology and model biases (Minimum and maximum temperature)
One of the most straightforward approaches to evaluate models is to compare simulated quantities, including global distributions of temperature, precipitation and solar radiation, with corresponding observationally-based estimates (Gleckler, Taylor, & Doutriaux, 2008; Pincus, Batstone, Hofmann, Taylor, & Glecker, 2008; Reichler & Kim, 2008).
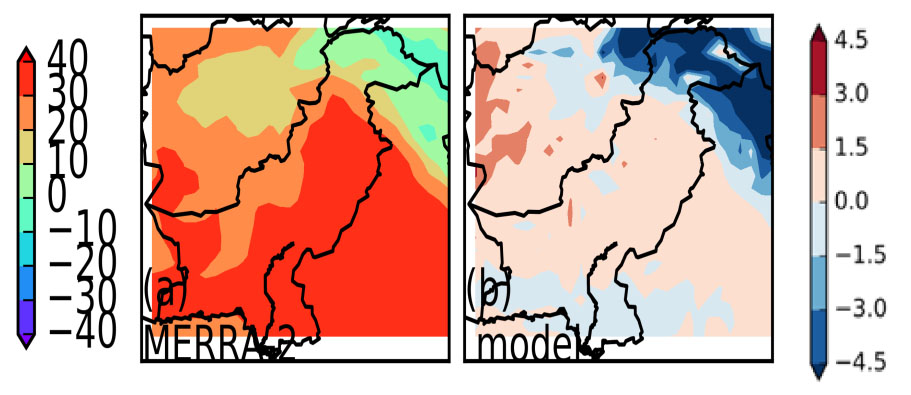
This study compares the simulated temperatures of CSIRO-CCAM-RCM ensemble with observed MERRA 2 data, for Pakistan. Model simulations for maximum temperature (Figure 2) in Rabi (November to May) season show that the model was able to reproduce agreeable skill scores with a general trend of minor bias ranging from 0 to 1°C over selected study sites. In the northern region, the ensemble depicts a bias of relatively wider range (>4.5°C). However, wheat cropping zones, i.e. Punjab simulations, show a positive bias of 0-1°C and in Sindh, there is a negative bias of -0-1°C. Overall, patterns of temperature bias are nearly similar for observed data as well as model simulations. A study carried out by Ahmad and Mahmood (2017) determined the observed, simulated and projected extreme climate indices in Pakistan using CSIRO-CCAM ensemble for a historical period of 35 years (1980 to 2004).
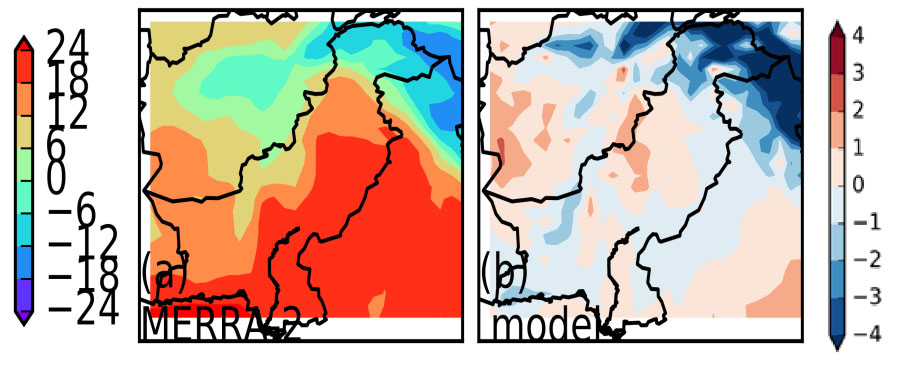
Minimum temperature during early Rabi season is of utmost importance as the germination of the wheat seed depends on it (Ahmad & Shahzad, 2012). Seedling does not emerge if the required temperature conditions do not prevail. Figure 3 shows Tmin biases. CSIRO-CCAM has simulated minimum temperatures across the country with least bias of mixed nature in a greater portion of the country except for extreme northern parts where the largest values (>-4°C) of negative bias have been estimated. The findings of Ahmad and Mahmood (2017) also mark an increase of temperature by <1°C, which appears to be in strong agreement with our results. As Central Punjab estimations show a mixed trend with biases not higher than 1°C. Lower values of biases (Potohar <-1 °C, Sindh <+1°C and Central Punjab within 1°C) indicate that the results are reliable and model is recommended for simulations in the given area. A correlation of 0.99 and a standard deviation of 1.03°C were found between our selected model and observational data rendering the model as best pick for simulations of climatological parameters in Pakistan.
3.2 Observed climatology and model biases (Growing Degree Days)
Growing Degree Day (GDD) is a measurement of the heat accumulation above a specific base temperature. It relates plant growth, development and maturity (Parthasarathi, Velu, & Jeyakumar, 2013) in terms of specific GDD requirement of each phenological stage. On the whole, the growing season length and actual dry matter production critically depend on seasonal temperature conditions (Tsvetsinskaya et al., 2003). In the present study, the historical period consists of the growing season dating back from 1981 to 2005 for growing degree days of wheat crop during the winter season. For evaluation of CCAM model, MERRA-2 data has been used to collate bias estimation of CCAM for the historic period. The results generated by CCAM (Figure 4) are well-founded for GDD bias in wheat-growing zones of Pakistan. In areas of Potohar, Central Punjab and most of the Sindh territory, model estimation exactly overlaps the reference results showing no bias at all whereas in South-Western Sindh model estimates a bias of up to 100 GDD. Although the biases in the Hindu-Kush-Himalayan (HKH) region are conspicuous, yet they can be overlooked as the area of this study does not include the HKH region. The inferences drawn from the results for wheat-growing areas render the model as preferably recommended for bias estimation, specifically in the given area.
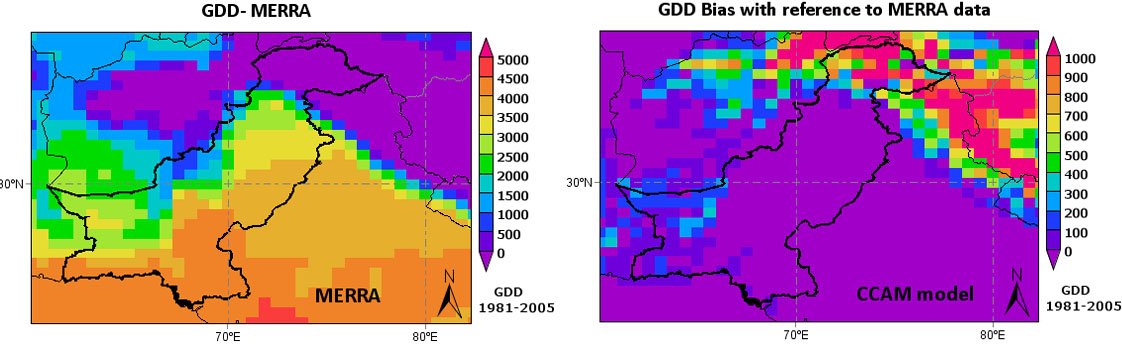
The reference figure showing results of MERRA-2 illustrates a wide range of heat requirement in wheat zones all over Pakistan. The magnitude of GDD goes on increasing linearly from Potohar to Sindh in a wide range of 3000 to 4500 heat units as determined by MERRA-2 data. The figure portrays that crop grown in Potohar requires the least heat units and stays in the field for a longer duration (to accumulate the number of heat units required for maturity) than the crop grown in central Punjab and Sindh. The results of this study are in agreement with the findings of Ruiz and Gaitan (2016), where growing degree days for the historical period (1961 to 2004) ranged from 2400 to above 3,500 GDD.
3.3 Future changes in growing degree days of wheat crop in Pakistan
Figure 5 delineates the spatial distribution of seasonal GDD’s required by the wheat crop all over Pakistan for three-time slots (near, mid and far century) under two RCPs (4.5 and 8.5). These maps aim to identify the areas with the greatest change in GDDs in the future over major wheat-producing areas in Pakistan.
The calculations for growing degree days are performed by obtaining the difference in daily mean temperature and base temperature. GDDs are accumulated by adding each day’s GDDs.
The base temperature is the lower limit beyond which the plant cannot continue to grow and develop. In this experiment, the base temperature is assumed to be at 5°C (Gill, Babuta, Kaur, Kaur, & Sandhu, 2014). Base temperature can be different for each crop depending upon its genetic traits. An increase in the daily mean temperature indicates an accumulation of more degree days; shortening the crop duration accordingly which is very likely to be the reason for reduced crop yields (Ahmed, & Fayyaz-ul-Hassan, 2015). Higher temperature together with reduced soil moisture decreases the season’s length of crop growing which alters the plant growth stage and affects the partitioning and quality of biomass causing yield reduction (Hakim, Hossain, Silva, Zvolinsky, & Khan, 2012).
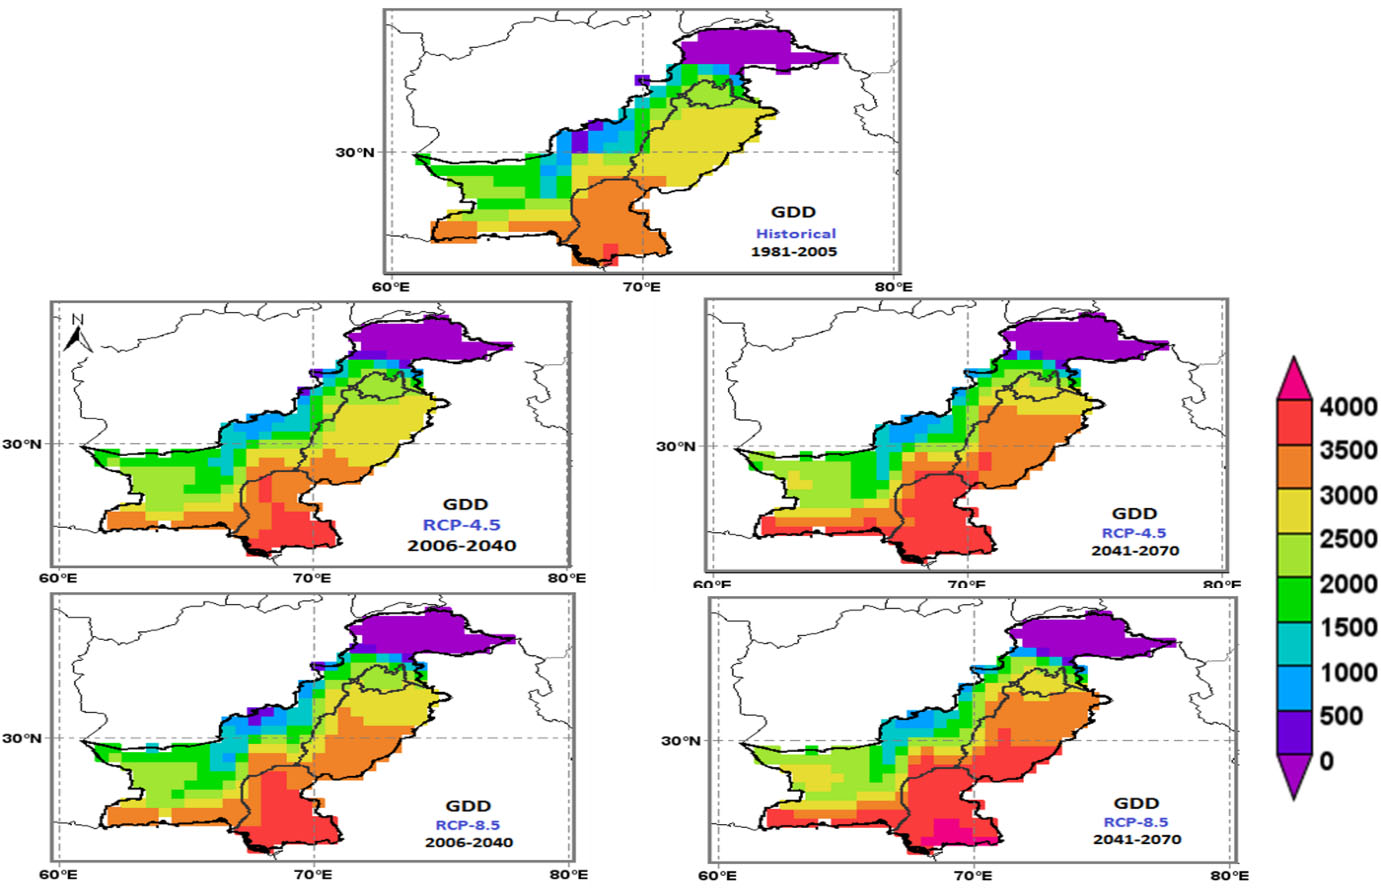
Figure 5 shows an increase in accumulated growing degree days in all major wheat producing zones of Pakistan including Sindh Central, Southern Punjab and Potohar region which is dominated by rain-fed wheat production under both RCP scenarios RCP 4.5 and RCP 8.5.
However, this increase is more intense in RCP 8.5 during mid-century. An overall increase of 1000 GDD between historical and late century extreme scenario in southeastern parts (lower Sindh province) of Pakistan has been observed. Results show the southeastern side of Pakistan, including wheat-producing districts of Sindh province (Thatta, Badin, Umerkot, Hyderabad and Sanghar) are likely to become unsuitable for wheat production due to temperature extremes during mid-century.
4. Conclusion
Daily mean temperature significantly affects phenology and grain yield of spring wheat. An increase in temperature is expected to shorten the crop lifecycle and lowering grain yields as a result of faster accumulation of GDDs in wheat crop. Studies indicate that temperatures in the southern part of Pakistan have shown to exceed the thresholds at the times of flowering and ripening. An overall increase of 1000 Growing Degree Days (GDDs) between past and mid-century extreme scenarios (RCP8.5) has been observed in case of wheat, implying that southeastern side of Pakistan is likely to become unsuitable for wheat production due to temperature extremes in future. An urgent response is required to help combat heat stress in cereal crops in order to ensure sustainability in food security. It requires high-quality research and policy planning for adopting to local scale, nationally oriented and forward-looking climate-smart practices and well-suited adaptation strategies, for resilient agriculture. Based on our study results, it is suggested that strategies like bringing more area under cultivation in North-Western and Mid-Western sides of Pakistan, considering multi-cropping and terracing options, early planting to avoid heat stress, and developing drought tolerant and heat resistant varieties can be wise options to minimize climate change impacts on wheat crop in Pakistan.
Acknowledgement
We are thankful to Asia-Pacific Network for Global Change Research (APN) for funding this project and their generous support and cooperation in providing guidelines and recommendations during this project (CAF2016-RR07-CMY-Shaheen). We are also thankful to Global Change Impacts Studies Centre (GCISC), all research scientists and research assistants for their contributions in achieving the project objectives.
References
- Abbas, G., Ahmad, S., Ahmad, A., Nasim, W., Fatima, Z., Hussain, S., … Hoogenboom, G. (2017). Quantification the impacts of climate change and crop management on phenology of maize-based cropping system in Punjab, Pakistan. Agricultural and Forest Meteorology, 247, 42–55. doi:10.1016/j.agrformet.2017.07.012
- Ahmad, B., & Hussain, A. (2017). Evaluation of past and projected climate change in Pakistan region based on GCM20 and RegCM4. 3 outputs. Pakistan Journal of Meteorology, 13(26).
- Ahmad, B., & Mahmood, S. (2017). Observed, simulated and projected extreme climate indices over Pakistan. Anchor Academic Publishing.
- Ahmad, S., Abbas, G., Fatima, Z., Khan, R. J., Anjum, M. A., Ahmed, M., … Hoogenboom, G. (2017). Quantification of the impacts of climate warming and crop management on canola phenology in Punjab, Pakistan. Journal of Agronomy and Crop Science, 203(5), 442–452. doi:10.1111/jac.12206
- Ahmad, T., & Shahzad, J. e S. (2012). Low temperature stress effect on wheat cultivars germination. African Journal of Microbiology Research, 6(6), 1265–1269. doi:10.5897/ajmr11.1498
- Ahmed, M., & Fayyaz-ul-Hassan. (2015). Response of Spring Wheat (Triticum aestivum L.) Quality Traits and Yield to Sowing Date. PLOS ONE, 10(4), e0126097. doi:10.1371/journal.pone.0126097
- Ahsan, S., Ali, M. S., Hoque, M. R., Osman, M. S., Rahman, M., Babar, M. J., … Islam, K. R. (2010). Agricultural and Environmental Changes in Bangladesh in Response to Global Warming. In Climate Change and Food Security in South Asia, 119–134. doi:10.1007/978-90-481-9516-9_9
- Aslam, M. A., Ahmed, M., Stöckle, C. O., Higgins, S. S., Hassan, F. ul, & Hayat, R. (2017). Can Growing Degree Days and Photoperiod Predict Spring Wheat Phenology? Frontiers in Environmental Science, 5. doi:10.3389/fenvs.2017.00057
- Dettori, M., Cesaraccio, C., & Duce, P. (2017). Simulation of climate change impacts on production and phenology of durum wheat in Mediterranean environments using CERES-Wheat model. Field Crops Research, 206, 43–53. doi:10.1016/j.fcr.2017.02.013
- Ding, Y. H., Ren, G. Y., Shi, G. Y., Gong, P., Zheng, X. H., Zhai, P. M., … & Luo, Y. (2006). National assessment report of climate change (I): climate change in China and its future trend. Advances in Climate Change Research, 2(1), 3-8.
- Elum, Z. A., Modise, D. M., & Marr, A. (2017). Farmer’s perception of climate change and responsive strategies in three selected provinces of South Africa. Climate Risk Management, 16, 246–257. doi:10.1016/j.crm.2016.11.001
- Farooq, M., Bramley, H., Palta, J. A., & Siddique, K. H. M. (2011). Heat Stress in Wheat during Reproductive and Grain-Filling Phases. Critical Reviews in Plant Sciences, 30(6), 491–507. doi:10.1080/07352689.2011.615687
- Field, C. B. (Ed.). (2014). Climate change 2014: Impacts, adaptation and vulnerability: Regional aspects. Cambridge University Press.
- Gill, K., Babuta, R., Kaur, N., Kaur, P., & Sandhu, S. (2014). Thermal requirement of wheat crop in different agroclimatic regions of Punjab under climate change scenarios. Mausam, 65, 417-424.
- Gleckler, P. J., Taylor, K. E., & Doutriaux, C. (2008). Performance metrics for climate models. Journal of Geophysical Research, 113(D6). doi:10.1029/2007jd008972
- Government of Pakistan. (2019). Economic Survey of Pakistan, 2018-19. Economic Advisory Wing, Finance Division, Govt. of Pakistan, pp. 15-18.
- Hakim, M. A., Hossain, A., Silva, J. A. T. da, Zvolinsky, V. P., & Khan, M. M. (2012). Protein and Starch Content of 20 Wheat (Triticum aestivum L.) Genotypes Exposed to High Temperature Under Late Sowing Conditions. Journal of Scientific Research, 4(2), 477. doi:10.3329/jsr.v4i2.8679
- Hansen, J., Sato, M., & Ruedy, R. (2012). Perception of climate change. Proceedings of the National Academy of Sciences, 109(37), E2415–E2423. doi:10.1073/pnas.1205276109
- Harris, I., Jones, P. D., Osborn, T. J., & Lister, D. H. (2013). Updated high-resolution grids of monthly climatic observations – the CRU TS3.10 Dataset. International Journal of Climatology, 34(3), 623–642. doi:10.1002/joc.3711
- Hu, Q., Weiss, A., Feng, S., & Baenziger, P. S. (2005). Earlier winter wheat heading dates and warmer spring in the U.S. Great Plains. Agricultural and Forest Meteorology, 135(1–4), 284–290. doi:10.1016/j.agrformet.2006.01.001
- Hundal, S. S. (2007). Climatic variability and its impact on cereal productivity in Indian Punjab. Current Science, 506-512.
- Hussain, S. S., & Mudasser, M. (2007). Prospects for wheat production under changing climate in mountain areas of Pakistan – An econometric analysis. Agricultural Systems, 94(2), 494–501. doi:10.1016/j.agsy.2006.12.001
- Iqbal, M. M., & Arif, M. (2010). Climate-change aspersions on food security of Pakistan. A Journal of Science for Development, 15.
- Iqbal, M. M., Goheer, M. A., Noor, S. A., Salik, K. M., Sultana, H., & Khan, A. M. (2009). Climate Change and Rice Production in Pakistan: Calibration, Validation and Application of CERES-Rice Model. Islamabad: Global Change Impact Studies Centre.
- Kalra, N., Chakraborty, D., Sharma, A., Rai, H. K., Jolly, M., Chander, S., … & Lal, M. (2008). Effect of increasing temperature on yield of some winter crops in northwest India. Current Science, 94(1) 82-88.
- Khichar M. L & Niwas, R. (2007). Thermal effect on growth and yield of wheat under different sowing environments and planting systems. Indian Journal of Agricultural Research, 41. 92-96.
- Kingra, P. K., & Kaur, P. (2012). Effect of dates of sowing on thermal utilization and heat use efficiency of groundnut cultivars in central Punjab. Journal of Agricultural Physics, 12(1), 54-62.
- Liu, S., Mo, X., Lin, Z., Xu, Y., Ji, J., Wen, G., & Richey, J. (2010). Crop yield responses to climate change in the Huang-Huai-Hai Plain of China. Agricultural Water Management, 97(8), 1195–1209. doi:10.1016/j.agwat.2010.03.001
- Liu, Y., Chen, Q., Ge, Q., Dai, J., Qin, Y., Dai, L., … & Chen, J. (2018). Modelling the impacts of climate change and crop management on phenological trends of spring and winter wheat in China. Agricultural and Forest Meteorology, 248, 518-526.
- Lobell, D. B., Bänziger, M., Magorokosho, C., & Vivek, B. (2011). Nonlinear heat effects on African maize as evidenced by historical yield trials. Nature Climate Change, 1(1), 42–45. doi:10.1038/nclimate1043
- Meena, H. M. & Rao, A.S. (2013). Growing degree days requirement of sesame (Sesamum indicum) in relation to growth and phonological development in Western Rajasthan. Current Advances in Agricultural Sciences. 5. 107-110.
- Meena, R. S., Yadav, R. S., & Meena, V. S. (2013). Heat unit efficiency of groundnut varieties in scattered planting with various fertility levels. The Bioscan, 8(4), 1189-1192.
- Nuttonson, M. Y. (1955). Wheat-climate relationships and the use of phenology in ascertaining the thermal and photo-thermal requirements of wheat based on data of North America and of some thermally analogous areas of North America in the Soviet Union and in Finland. American Institute of Crop Ecology, Washington DC, USA, 388.
- Nuttall, J. G., Barlow, K. M., Delahunty, A. J., Christy, B. P., & O’Leary, G. J. (2018). Acute High Temperature Response in Wheat. Agronomy Journal, 110(4), 1296–1308. doi:10.2134/agronj2017.07.0392
- Pandey, V., Patel, H. R., & Patel, V. J. (2007). Impact assessment of climate change on wheat yield in Gujarat using CERES-wheat model. Journal of Agricultural Meteorology, 9(2), 149-157.
- Parthasarathi, T., Velu, G., & Jeyakumar, P. (2013). Impact of crop heat units on growth and developmental physiology of future crop production: a review. Journal of Crop Science and Technology, 2(1), 2319-3395.
- Pincus, R., Batstone, C. P., Hofmann, R. J. P., Taylor, K. E., & Glecker, P. J. (2008). Evaluating the present-day simulation of clouds, precipitation, and radiation in climate models. Journal of Geophysical Research, 113(D14). doi:10.1029/2007jd009334
- Porter, J. R., & Gawith, M. (1999). Temperatures and the growth and development of wheat: a review. European Journal of Agronomy, 10(1), 23–36. doi:10.1016/s1161-0301(98)00047-1
- Reichler, T., & Kim, J. (2008). How Well Do Coupled Models Simulate Today’s Climate? Bulletin of the American Meteorological Society, 89(3), 303–312. doi:10.1175/bams-89-3-303
- Ruiz Castillo, N., & Gaitán Ospina, C. (2016). Projecting Future Change in Growing Degree Days for Winter Wheat. Agriculture, 6(3), 47. doi:10.3390/agriculture6030047
- Semenov, M. A. (2008). Impacts of climate change on wheat in England and Wales. Journal of The Royal Society Interface, 6(33), 343–350. doi:10.1098/rsif.2008.0285
- Singha, P., Bhowmick, J., & Chaudhuri, B. K. (2006). Effect of temperature on yield and yield components of fourteen wheat (Triticum aestivum L.) genotypes. Environment and Ecology, 24(3), 550.
- Tao, F., Yokozawa, M., Xu, Y., Hayashi, Y., & Zhang, Z. (2006). Climate changes and trends in phenology and yields of field crops in China, 1981–2000. Agricultural and Forest Meteorology, 138(1-4), 82–92. doi:10.1016/j.agrformet.2006.03.014
- Tsvetsinskaya, E. A., Mearns, L. O., Mavromatis, T., Gao, W., McDaniel, L., & Downton, M. W. (2003). Climatic Change, 60(1/2), 37–72. doi:10.1023/a:1026056215847
- Van Ogtrop, F., Ahmad, M., & Moeller, C. (2013). Principal components of sea surface temperatures as predictors of seasonal rainfall in rainfed wheat growing areas of Pakistan. Meteorological Applications, 21(2), 431–443. doi:10.1002/met.1429
- Zhao, C., Liu, B., Piao, S., Wang, X., Lobell, D. B., Huang, Y., … Asseng, S. (2017). Temperature increase reduces global yields of major crops in four independent estimates. Proceedings of the National Academy of Sciences, 114(35), 9326–9331. doi:10.1073/pnas.1701762114