Future changes in annual precipitation extremes over Southeast Asia under global warming of 2°C
Keywords
Future changes · Multi-model ensemble · Precipitation Extremes · SEACLID/CORDEX-SEA · Southeast Asia
Highlights
- The models simulated the characteristics of observed precipitation extremes
- Significant and robust changes in CDD over Indonesia and in RX1day over Indochina
- Significant and robust changes in CDD, R50mm and RX1day over northern Myanmar
1. Introduction
Southeast Asia is a region highly exposed and vulnerable to the impacts of climate change. It is a problem compounded by the low resilience and adaptive capacity of the mostly developing and least developed countries in the region (Hijioka et al., 2014). The Fifth Assessment Report of the Intergovernmental Panel on Climate Change (IPCC AR5) has indicated that Southeast Asia has already been experiencing long-term changes in climate (Christensen et al., 2013) with consequent impacts (Hijioka et al., 2014). Continued warming would likely affect the region more in the future. However, there has been no detailed study of future changes in precipitation extremes in Southeast Asia.
While the Paris Agreement provides a ray of hope for countries in the region, given its main goal to limit global warming below 2°C relative to pre-industrial level, recent studies suggested that current commitments of the agreement appear insufficient in achieving this goal (e.g., Raftery, Zimmer, Frierson, Startz, & Liu, 2017; Rogelj et al., 2016). In fact, Rogelj et al. (2016) estimated that with the current commitments in the Paris Agreement, there is a 10% likelihood that mean global temperature will exceed 3.9°C with a median range of 3.5–4.2°C. Raftery Zimmer, Frierson, Startz, and Liu (2017) also indicated only a 5% (1%) likelihood of warming below 2°C (1.5°C) by the end of the 21st century.
This study provides detailed information of future changes in precipitation extremes in Southeast Asia under global warming of 2°C, which is policy-relevant for countries in the region.
2. Methodology
The analysis in this paper was based on the output of multi-model simulations of the Southeast Asia Regional Climate Downscaling / Coordinated Regional Climate Downscaling Experiment (SEACLID/CORDEX–SEA) (Cruz et al., 2017; Juneng et al., 2016; Ngo-Duc et al., 2017; http://www.ukm.edu.my/seaclid-cordex). In SEACLID/CORDEX–SEA, many general circulation models (GCMs) have been dynamically downscaled to a 25 km resolution, except for the 50 km coupled global ocean-regional atmosphere model (ROM) (Sein et al., 2013). The models have been integrated over a domain of 85.5°E–146.5°E, 15°S–27°N, using multiple regional climate models (RCMs). Table 1 lists the 10 ensemble members used in the analysis. Most simulations started earlier than the 1970s and continued until 2100, depending on the model. The reference period in this study is 1986–2005. The year 2041 was determined as the time when global mean temperature reaches 2°C above pre-industrial level for the RCP8.5 scenario based on Karmalkar and Bradley (2017), which used the ensemble average global mean temperature from 35 GCMs of the Coupled Model Intercomparison Project Phase 5 (CMIP5). The RCP8.5 scenario, which represents a very high baseline emission scenario (van Vuuren et al., 2011), was chosen to mimic the pathway of unmitigated climate change.
| Ensemble member | GCM | RCM |
| 1 | CNRM-CM5 (CNRM, France) | RegCM4 (ICTP, Italy) |
| 2 | HadGEM2-AO (Hadley Centre, UK) | RegCM4 (ICTP, Italy) |
| 3 | MPI-ESM-MR (MPI-M, Germany) | RegCM4 (ICTP, Italy) |
| 4 | EC-Earth (EC-Earth consortium) | RegCM4 (ICTP, Italy) |
| 5 | CSIRO MK3.6 (CSIRO, Australia) | RegCM4 (ICTP, Italy) |
| 6 | HadGEM2-AO (Hadley Centre, UK) | WRF (NCAR USA) |
| 7 | CNRM-CM5 (CNRM, France) | RCA4 (SMHI, Sweden) |
| 8 | HadGEM2-ES (Hadley Centre, UK) | RCA4 (SMHI, Sweden) |
| 9 | HadGEM2-ES (Hadley Centre, UK) | PRECIS (Hadley Centre, UK) |
| 10 | MPI-ESM-LR (MPI-M, Germany) | ROM (GERICS-AWI, Germany) |
TABLE 1. List of GCMs and RCMs considered in this study.
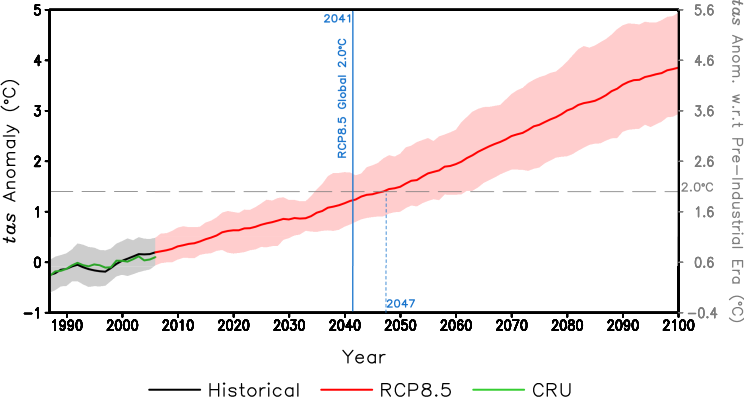
Figure 1 shows the ensemble mean temperature anomalies with the range of maximum and minimum values over Southeast Asia from the SEACLID/CORDEX–SEA simulations following RCP8.5 scenario. Interestingly, the ensemble mean warming over Southeast Asia is projected to reach the 2°C threshold by 2047, which suggests that temperature in SEA region is slightly lower than the global average. To derive the climatology of precipitation extremes around the year 2041, we consider 2031–2051 as the averaging period. Many studies have indicated that a window of 20 years is sufficient for calculating a stable climatology of extremes (e.g., Lelieveld et al., 2016). Four extremes indices were selected from the set of indices described by the Joint CCI/CLIVAR/JCOMM Expert Team on Climate Change Detection and Indices (ETCCDI) (see http://etccdi.pacificclimate.org/list_27_indices.shtml) (Table 2). These indices were used to examine the characteristics of precipitation extremes on an annual scale.
| Index | Abbreviation | Description | Units |
| Total Precipitation | PRCPTOT | Annual total precipitation in wet days | mm |
| Consecutive Dry Days | CDD | Annual maximum number of consecutive days when daily precipitation < 1 mm | days |
| Number of extremely heavy precipitation days | R50mm | Annual count of days when daily precipitation ≥ 50 mm | days |
| Maximum 1-day precipitation amount | RX1day | Annual maximum 1-day precipitation | mm |
TABLE 2: List of precipitation extreme indices used in this study.
The ensemble model mean of each index was evaluated using daily gridded precipitation data of the Climate Hazards Group InfraRed Precipitation with Station data (CHIRPS) (http://chg.geog.ucsb.edu/data/chirps/) from the historical period. Annual anomalies of the indices were first derived relative to respective climatological means. Then the probability density function (PDF) of the anomaly of each index was computed from both modelled and observed data (e.g., King, Karoly, & Henley, 2017). Future changes in precipitation over the 2031–2051 period when global warming reaches 2.0°C are expressed as percentage of change relative to the climatological mean. Hatching is used in the spatial maps of changes in each index to indicate areas where the climate change signal is stronger than interannual variability at a 95% significance level. The significance was determined using a Monte Carlo technique (Baez & Tweed, 2013). The robustness of the projected changes at 95% level is indicated by red dots if at least 7 models agreed in the sign of change out of the total 10 ensemble members. The number 7 was determined using a binomial probability distribution (Vautard et al., 2014).
3. Results and Discussion
3.1 Validation of modelled precipitation extremes
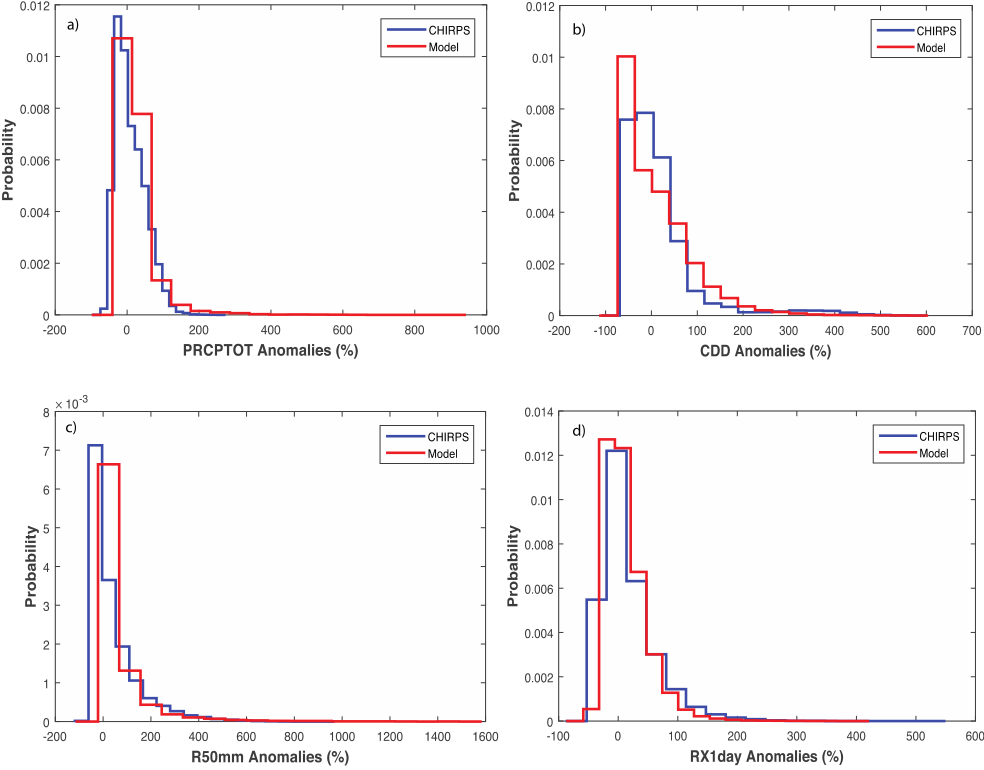
Figure 2 shows the PDFs of the anomalies in PRCPTOT, CDD, R50mm and RX1day for both the observed CHIRPS dataset and model output. Similarities in the observed and modelled PDFs show that the regional climate simulations reasonably captured the characteristics of the observed extreme precipitation anomalies over Southeast Asia. The models have not only reasonably simulated the PRCPTOT anomalies but also the CDD, R50mm, and RX1day. Nevertheless, there are some minor differences between observed and modelled PDFs for CDD and R50mm, which could be due to the shortcomings in the model or CHIRPS data itself.
3.2 Projected changes in precipitation extremes
Understanding the changes in precipitation extremes is crucial since these changes will drive the results from any impact assessment. Since there has been no previous study assessing changes in precipitation extremes under 2°C global warming over Southeast Asia, it is not possible to compare the consistency of the results with other studies. However, there is good confidence in these results given the use of the multi-model approach with 10 ensemble members. In addition, the resolution of 25 km should be high enough to resolve regional processes. Many studies have indicated “added values” of RCM compared with GCM in simulating extremes (e.g., Kanamitsu & DeHann, 2011). However, investigating the added values of RCM is outside the scope of this study.
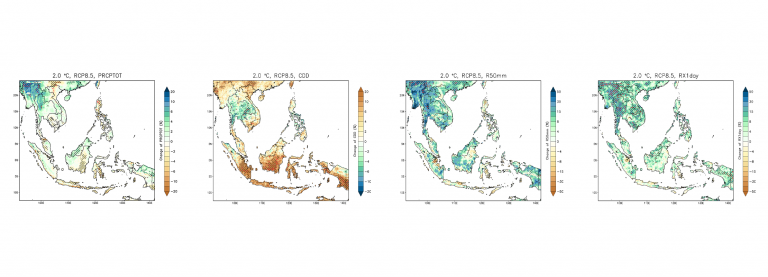
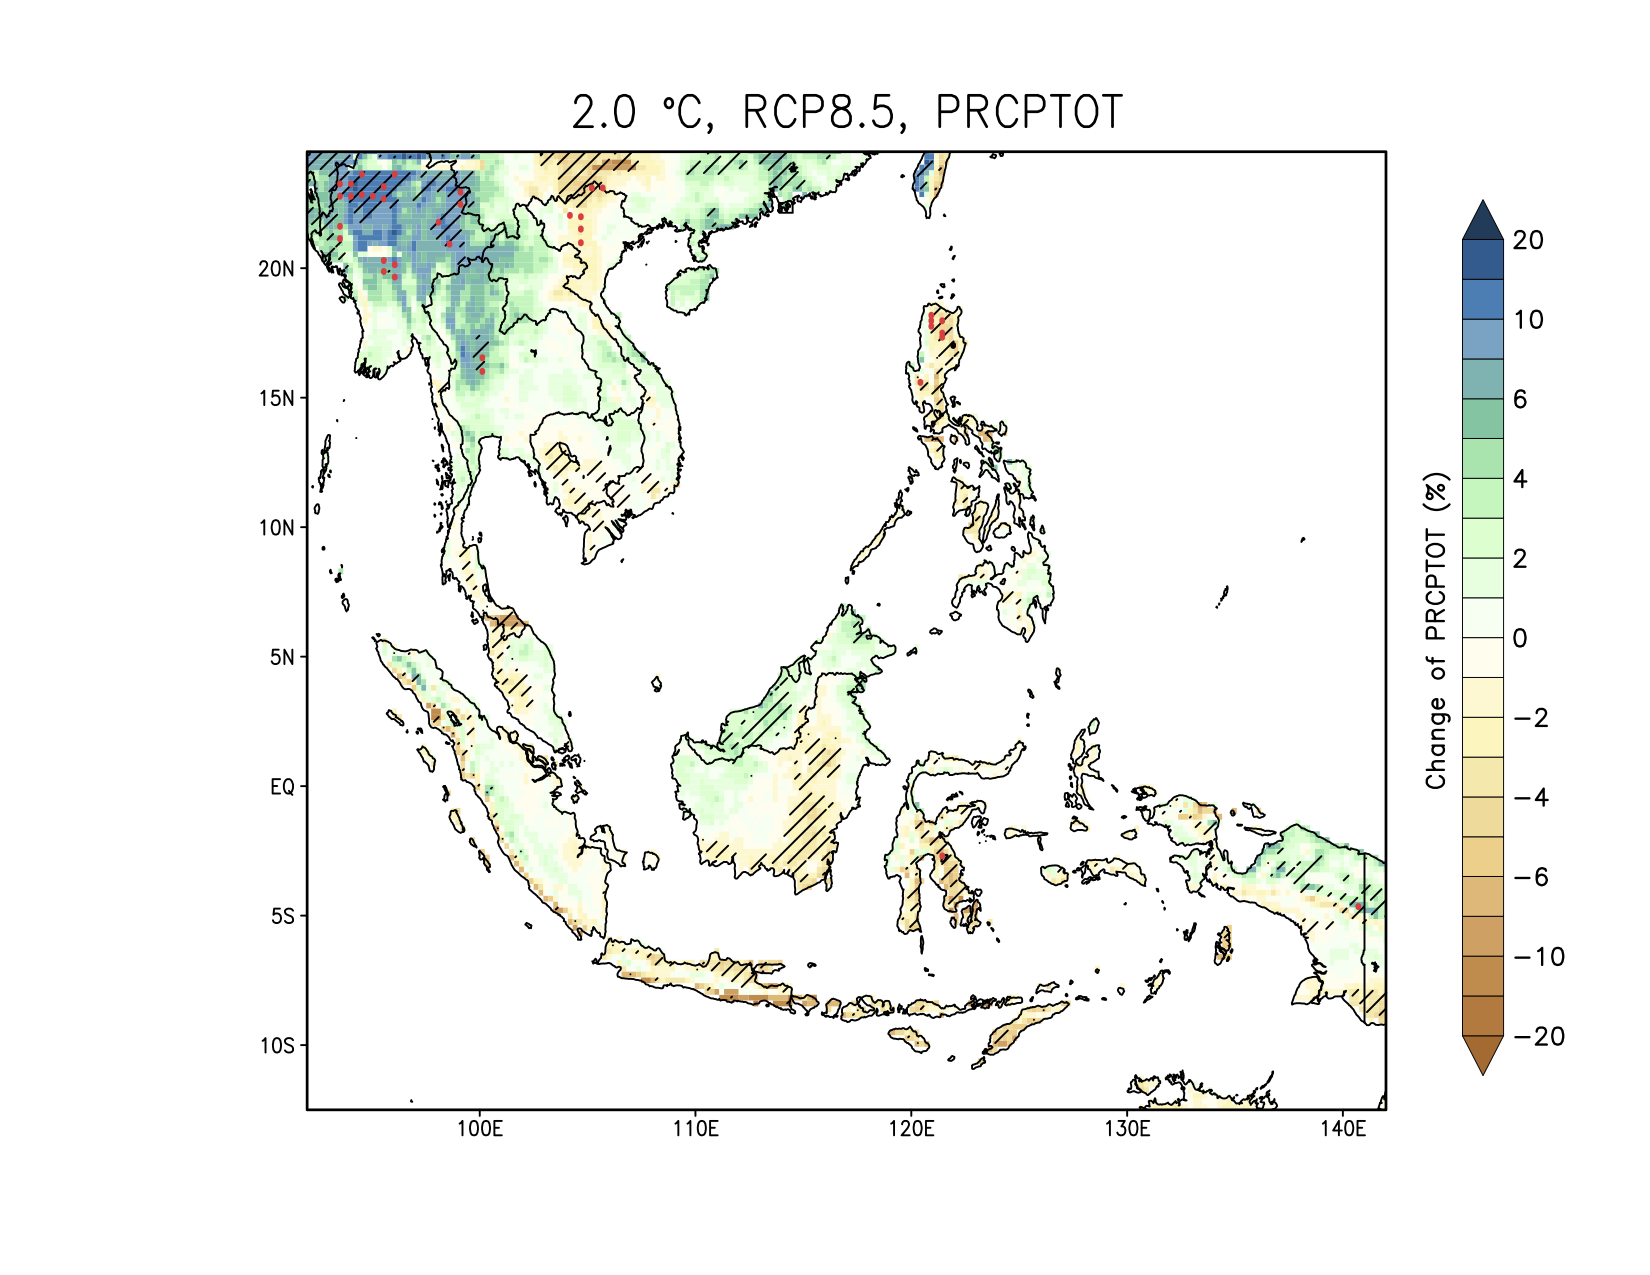
The projected changes in PRCPTOT when the global mean temperature reaches 2°C above pre-industrial level are shown in Figure 3. Noticeably some areas indicate increases, others decreases, but the percentage of change is generally relatively small. The largest increase can be seen over northern Myanmar where the projected increase is 10-15%, which is both significant and robust. Other regions are projected to experience significant decreases and increases but these changes are not robust.
Generally, annual CDD is projected to increase over Indonesia (Figure 4). The changes are most significant and robust over southern Sumatra, Kalimantan, Sulawesi and Papua. The north-western region of Myanmar is also anticipated to have a longer duration of dry conditions. Furthermore, CDD is projected to increase over northern Vietnam and Java, and to decrease in central-eastern Thailand but these changes are mostly not significant, except in eastern Thailand.
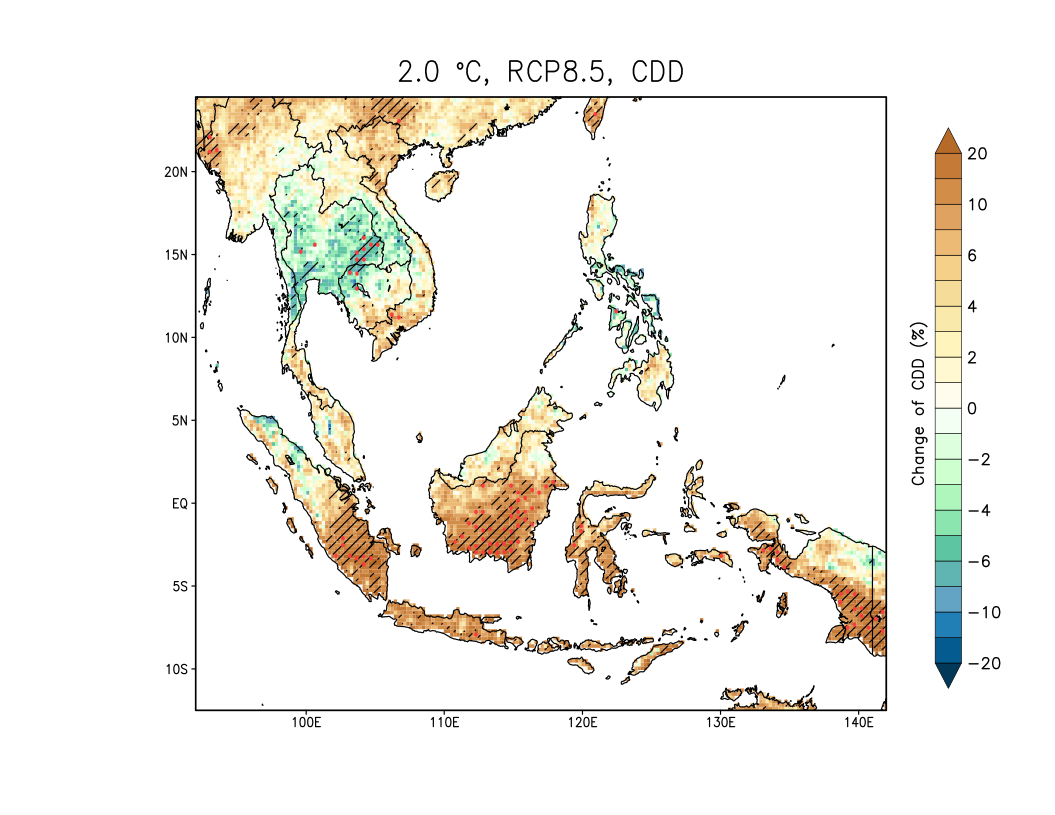
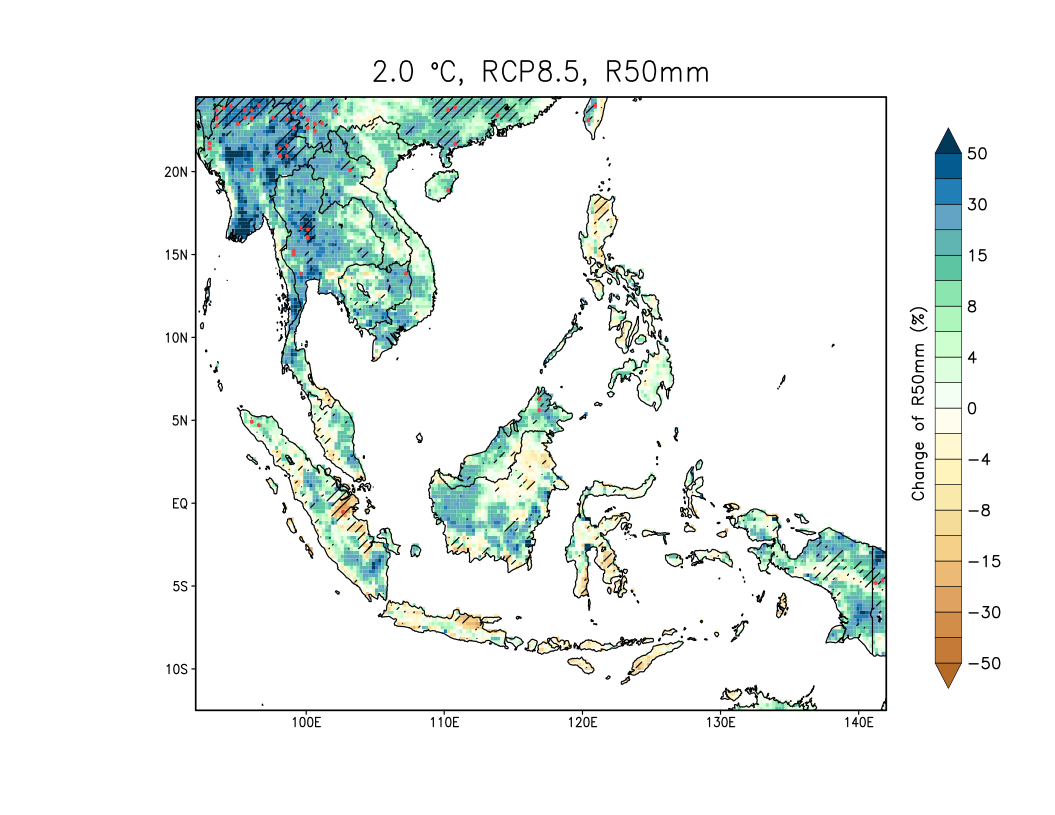
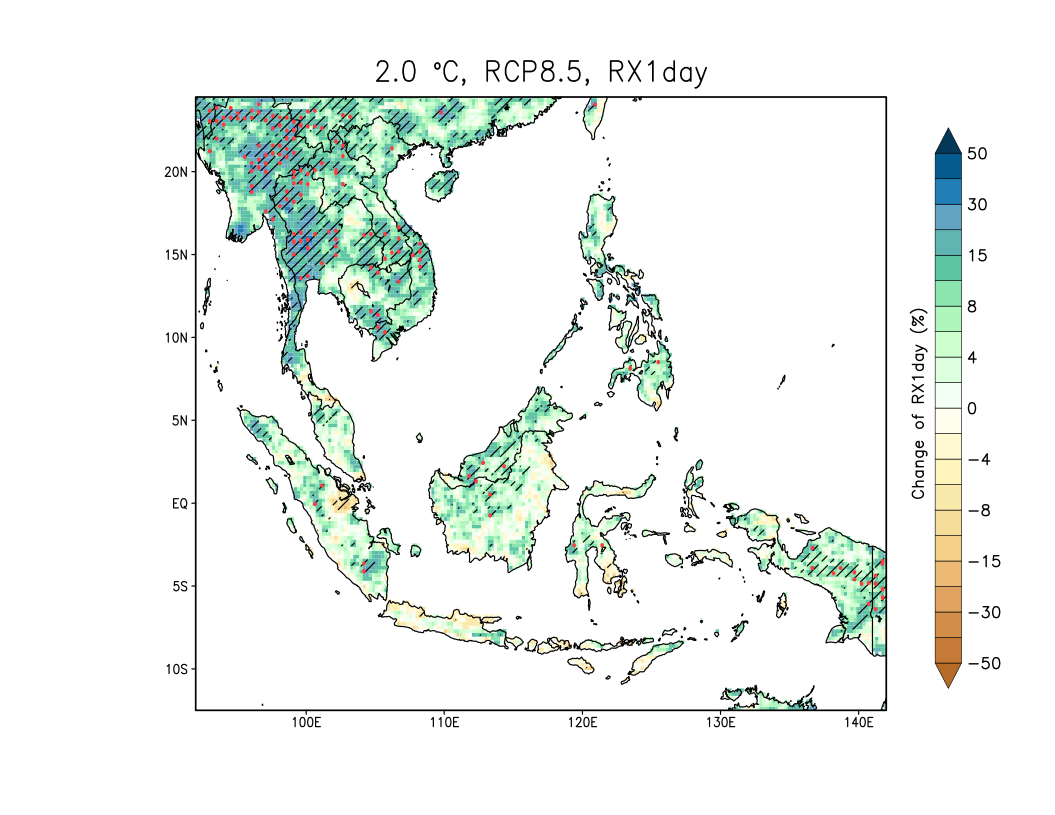
Despite the tendency to have prolonged dry days in the future, not all regions are projected to experience significant reduction in total rainfall (Figure 3). For example, despite the increase in CDD in southern Sumatra, there is no significant decrease in total rainfall over the area (Figure 3). The decrease in rainfall due to the increase in CDD could be offset by the increase in either frequency or intensity of extreme rainfall or both. Indeed, both the frequency (R50mm; Figure 5) and the intensity (RX1day; Figure 6) of extreme precipitation events largely show increased changes albeit not significant over Sumatra. Interestingly, over northern Myanmar, changes in CDD, R50mm and RX1day are largely significant and robust (Figures 4, 5 and 6). In most areas the projected changes in R50mm are largely not significant and not robust. However, projected changes in RX1day in many areas in Indochina are generally significant and robust, which suggests the occurrence of more intense rainfall events in this region.
4. Conclusion
This study evaluates the changes in annual precipitation extremes when global mean temperature reaches 2°C above pre-industrial level (ca. 2041) under the unmitigated climate change scenario (RCP8.5) based on the multi-model simulation outputs of SEACLID/CORDEX–SEA. The results are likely to be policy-relevant for countries in this region, especially in light of the lingering doubt in achieving the target of capping global warming below 2°C under the Paris Agreement. The most notable changes are the significant and robust increase in CDD over most of Indonesia, and increase in RX1day over many areas in Indochina. Most likely, even larger changes are projected if the seasonal timescale is considered. Hence, this result may have some implications on water resources and food security if global warming continues above 2°C. Northern Myanmar is projected to experience largely significant and robust changes in CDD, R50mm and RX1day. This implies an increased likelihood not only for droughts to occur in the area, but also more frequent and intense extreme precipitation events in the future.
Acknowledgement
This research is funded by the Asia-Pacific Network for Global Change Research (ARCP2013-17NMY-Tangang, ARCP2014-07CMY-Tangang, ARCP2015-04CMY-Tangang) with additional support from Universiti Kebangsaan Malaysia (ICONIC-2013-001), Thailand Research Fund (RDG5630019), National Research Council of Thailand (2557-73 and 2559-226), BMKG Research Fund (National Budget for FY 2013-2018), Hanoi University of Science (QG.15.06), French Government financial support for REMOSAT and LOTUS laboratories at USTH, Vietnam, DOST-SEI of the Philippines, Pilipinas Shell Foundation, Inc., and APEC Climate Center. ROM model simulations were performed at the German Climate Computing Center (DKRZ).
References
- Baez, J.C., & Tweed, D. (2013). Monte Carlo Methods in Climate Science. Math Horizons, 21, 5-8.
- Christensen, J.H., Krishna Kumar, K., Aldrian, E., An, S.-I., Cavalcanti, I.F.A., de Castro, M., … Zhou, T. (2013). Climate phenomena and their relevance for future regional climate change. In T.F. Stocker, D. Qin, G.-K. Plattner, M. Tignor, S.K. Allen, J. Boschung, … P.M. Midgley (Eds.), Climate Change 2013: The Physical Science Basis. Contribution of Working Group I to the Fifth Assessment Report of the Intergovernmental Panel on Climate Change (pp. 1217–1308). Cambridge, United Kingdom and New York, NY, USA: Cambridge University Press.
- Cruz, F., Narisma, G., Dado, J., Singhruck, P., Tangang, F., Linarka, U., … Aldrian, E. (2017). Sensitivity of temperature to physical parameterization schemes of RegCM4 over the CORDEX-Southeast Asia region. International Journal of Climatology, 37, 5139–5153. http://doi.org/10.1002/joc.5151
- Hijioka Y., Lin E., Pereira, J.J., Corlett, R.T., Cui X., Insarov, G.E., … Surjan, A. (2014). Asia. In V.R. Barros, C.B. Field, D.J. Dokken, M.D. Mastrandrea, K.J. Mach, T.E. Bilir, … L.L. White (Eds.), Climate Change 2014: Impacts, Adaptation, and Vulnerability. Part B: Regional Aspects. Contribution of Working Group II to the Fifth Assessment Report of the Intergovernmental Panel on Climate Change (pp. 1327–1370). Cambridge, United Kingdom and New York, NY, USA: Cambridge University Press.
- Juneng, L., Tangang, F., Chung, J.X., Ngai, S.T., Tay, T.W., Narisma, G., … Aldrian, E. (2016). Sensitivity of Southeast Asia rainfall simulations to cumulus and air-sea flux parameterizations in RegCM4. Climate Research, 69, 59–77. http://doi.org/10.3354/cr01386.
- Kanamitsu, M., & DeHann, L. (2011). The Added Value Index: a new metric to quantify the added value of regional models. Journal of Geophysical Research 116, D11106, http://doi.org/10.1029/2011JD015597.
- King, A.D., Karoly, D.J., & Henley, B.J. (2017). Australian climate extreme at 1.5 °C and 2 °C of global warming. Nature Climate Change, 7, 412-416. http://doi.org/10.1038/nclimate3296
- Karmalkar, A.V., & Bradley, R.S. (2017). Consequences of Global Warming of 1.5 °C and 2 °C for Regional Temperature and Precipitation Changes in the Contiguous United States. PLoS ONE 12(1), e0168697. http://doi.org/10.1371/journal.pone.0168697
- Lelieveld, J., Proestos, Y., Hadjinicolaou, P., Tanarhte, M., Tyrlis, E., & Zittis, G. (2016). Strongly increasing heat extremes in the Middle East and North Africa (MENA) in the 21st century. Climatic Change, 137, 245–260. http://doi.org/10.1007/s10584-016-1665-6
- Ngo-Duc, T., Tangang, F.T., Santisirisomboon, J., Cruz, F., Trinh-Tuan, L., Nguyen-Xuan, T., … Aldrian, E. (2017). Performance evaluation of RegCM4 in simulating extreme rainfall and temperature indices over the CORDEX-Southeast Asia region. International Journal of Climatology, 37, 1634–1647. http://doi.org/10.1002/joc.4803
- Raftery, A.E., Zimmer, A., Frierson, D.M.W., Startz, R., & Liu, P. (2017). Less than 2 °C warming by 2100 unlikely, Nature Climate Change, 7, 637–641. http://doi.org/10.1038/nclimate3352
- Rogelj, J., den Elzen, M., Höhne, N., Fransen, T., Fekete, H., Winkler, H., … Meinshausen, M. (2016). Paris Agreement climate proposals need a boost to keep warming well below 2 °C. Nature, 534, 631-639. http://doi.org/10.1038/nature18307
- Sein, D.V., Mikolajewicz, U., Gröger, M., Fast, I., Cabos, W., Pinto, J.G., … Jacob, D. (2015), Regionally coupled atmosphere-ocean-sea ice- marine biogeochemistry model ROM: 1. Description and validation. Journal of Advances in Modeling Earth Systems, 7, 268–304. http://doi.org/10.1002/2014MS000357.
- Vautard, R., Gobiet, A., Sobolowski, S., Kjellström, E., Stegehuis, A., Watkiss, P., … Jacob, D. (2014). The European climate under a 2 °C global warming. Environmental Research Letters, 9. http://doi.org/10.1088/1748-9326/9/3/034006
- van Vuuren, D.P., Edmonds, J., Kainuma, M., Riahi, K., Thomson, A., Hibbard, K., … Rose, S.K. (2011). The representative concentration pathways: an overview. Climatic Change, 109, 5-31. http://doi.org/10.1007/s10584-011-0148-z