
Formation mechanism and source apportionment of nitrate in atmospheric aerosols
Keywords
Formation mechanism · Isotope · MixSIAR · PMF · Source apportionment
HIGHLIGHTS
- Detailed formation mechanisms of atmospheric nitrate are presented.
- The application of the N/O isotope technique in source apportionment is reviewed.
- The isotope method is compared with the PMF method to reach a promising direction.
1. INTRODUCTION
2. FORMATION MECHANISM OF NITRATE
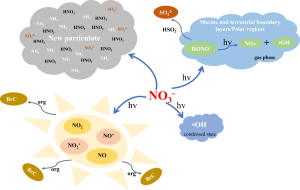
NOx is the major precursor of atmospheric nitrate. Once emitted into the atmosphere, NO can be quickly oxidised into NO2 by atmospheric oxidants such as O3, HO2∙, RO2∙, and halogen oxides (XO, X representing Br, Cl, and I), as demonstrated by the Chemical Equation (R1). Meanwhile, NO2 can also photolyze at λ < 398 nm to form NO + O during the day. The conversion rate of NOx between NO and NO2 during the day is several orders of magnitude higher than the oxidation rate of NOx to form NO3− (Michalski, Scott, Kabiling, & Thiemens, 2003).
As shown in the chemical equations, the major oxidation pathways from NOx to NO3− include the oxidation by ∙OH (R2) during the day and hydrolysis of N2O5 (R3–R4) at night (Alexander et al., 2009). According to the reactive halogen chemistry simulated using tropospheric chemical models, inorganic nitrate produced through the hydrolysis of halogen nitrate (XNO3, X representing Br, Cl, and I) (R5) is also an important sink of NOx, which can further affect the formation of tropospheric O3, ∙OH, reactive halogen, and aerosols (von Glasow & Crutzen, 2004; Yang et al., 2005; Parrella et al., 2012; Saiz-Lopez et al., 2012; Long et al., 2014; Schmidt et al., 2016; Sherwen et al., 2016). Other formation pathways of inorganic nitrate include the heterogeneous uptake of NO2 and NO3 (R6), reaction between NO3 radical and hydrocarbons (HC) or dimethyl sulfide (DMS) (R7), hydrolysis of organic nitrate (R8–R9), direct oxidation of NO by HO2∙ (R10) and heterogeneous reaction between N2O5 and particulate Cl− (R11) (Atkinson, 2000). The two major oxidation pathways from NOx to NO3−, i.e., oxidation by ∙OH and hydrolysis of N2O5, contribute equally to the formation of NO3− globally in the lower atmosphere with altitude <1 km, while the total contribution of other formation pathways of NO3− is generally less than 6% globally (Alexander et al., 2020). However, exceptions could occur in particular regions during a particular time. For example, Luo et al. (2020) found that the formation pathways of NO3− via N2O5 + H2O/Cl−, NO3 + VOCs, and ClNO3 + H2O contributed around 53%–89% to NO3− formation during the severely polluted period in Beijing, but ∙OH + NO2 was the dominant formation pathway of NO3− during the non-polluted period with the contribution of 37%–69% to NO3− formation.
The partition between gaseous HNO3 and particulate NO3− depends on the abundance of aerosols, aerosol water content and chemical composition, and temperature. The inorganic nitrate returns to the earth’s surface through dry and wet deposition, and the life cycle for deposition is around 3–4 days (Park, Jacob, Field, Yantosca & Chin, 2004).
\mathrm{NO + O_3/HO_2/RO_2/XO \rightarrow NO_2} \quad (R1)^*
$$
$$
\mathrm{NO_2 + \cdot OH \rightarrow HNO_3} \quad (R2)
$$
$$
\mathrm{NO_2 + O_3 \rightarrow NO_3} \quad (R3)
$$
$$
\mathrm{NO_3 + NO_2 \rightarrow N_2O_5 \overset{hydrolyse}{\rightarrow} HNO_3} \quad (R4)
$$
\mathrm{NO_2 + XO \rightarrow XNO_3 \overset{hydrolyse}{\rightarrow} HNO_3} \quad (R5)^*
$$
\mathrm{NO_2 + H_2O \rightarrow HNO_3} \quad (R6)
$$
\mathrm{NO_3 + HC/DMS \rightarrow HNO_3} \quad (R7)
$$
\mathrm{NO_3 + BVOCs \rightarrow RONO_2 \overset{hydrolyse}{\rightarrow} HNO_3} \quad (R8)
$$
\mathrm{NO + RO_2 \rightarrow RONO_2 \overset{hydrolyse}{\rightarrow} HNO_3} \quad (R9)
$$
\mathrm{NO + HO_2 \rightarrow HNO_3} \quad (R10)
$$
\mathrm{N_2O_5 + Cl^- \overset{aerosol}{\rightarrow} HNO_3} \quad (R11)
$$
* In Reactions 1 and 5, XO represents halogen oxides, with X representing Br, Cl, and I.
3. SOURCE APPORTIONMENT OF NITRATE
3.1. Sources of nitrate
Nitrate is dominantly formed by the gaseous precursor NOx through secondary reactions in the atmosphere. Therefore, the sources of nitrate are virtually the sources of NOx, except that some emission sources, such as the ammonium nitrate fertiliser plants, can also release nitrate into the atmosphere directly.
Anthropogenic emission sources such as fossil fuel combustion, biofuel combustion and agricultural fertilisation are the major sources of NOx in the atmosphere (Jaegle, Steuberger, Martin, & Chance, 2005). The anthropogenic emissions of NOx varied with time historically. At the end of the 20th century, fossil fuel combustion took 95% of the total NOx emission globally (Anenberg et al., 2017), with 90% in Europe (Sutton et al., 2011), 88% in East Asia (Ohara et al., 2007), and 96% in North America (Air Pollutants Emissions Inventory, 2023), respectively. However, the contribution of non-fossil fuel sources to NOx emission has greatly increased in recent years. According to the work of Song et al. (2021), non-fossil fuel sources took over 50% of the total NOx emission globally; the annual emission of NOx from non-fossil fuel sources was 21.6 ± 16.6 Mt in East Asia, 7.4 ± 5.5 Mt in Europe, and 21.8 ± 18.5 Mt in North America, respectively. The anthropogenic emissions of NOx also show great spatial variability globally. Vehicular emission used to be the major source of NOx in developed countries in North America and Europe. However, with the implementation of control measures targeting stationary and mobile emission sources, non-fossil fuel sources have shown an increased contribution to NOx. The soil-related sources, such as agricultural land, forest, and animal manure emissions, now contribute highly to NOx in developed countries (Almaraz et al., 2018; Guo et al., 2020; Skiba et al., 2021). In comparison, in many developing countries, fossil fuel combustion remains the major source of NOx due to the growing urbanisation and industrialisation processes. For example, the energy and industry sectors were India’s dominant source of NOx, followed by vehicular emission (Garg, Bhattacharya, Shukla, & Dadhwal, 2001). Similarly, the mobile source took 46.1% of total NOx emission in Tehran, Iran (Shahbazi, Hassani, & Hosseini, 2019), and the roadside NOx emission flux could reach as high as (36.46 ± 12.86) × 1024 molec./s in Beijing, China (Huang et al., 2020).
Because atmospheric nitrate is dominantly formed through the reactions of NOx, the sources of nitrate show similar spatial and temporal variability to NOx. However, the formation mechanism of nitrate is complicated, and some primary sources also contribute to nitrate in the atmosphere. Therefore, it may not be completely effective to control atmospheric nitrate pollution by merely understanding the sources of NOx. A recent study conducted in the North China Plain showed that with a considerable reduction of NOx by 31.8% in 2010–2017, the atmospheric surface concentration of NO3− only decreased by 0.2% (Fu et al., 2020). A thorough understanding of the sources and formation mechanisms of nitrate is essential for the successful mitigation of nitrate.
3.2. Source apportionment of nitrate based on isotope analysis
Since nitrate is dominantly formed in the atmosphere, it is difficult to apply the common source apportionment methods of atmospheric aerosols, such as emission inventories, receptor models, and source diffusion models, to identify nitrate sources and formation mechanisms in the atmosphere. Particularly, the nitrogen/oxygen (N/O) isotope technique coupled with the Bayesian isotopic mixing model (MixSIAR) is a powerful tool to trace nitrate aerosols’ sources and formation pathways. The isotope technique was first developed in the 1950s and used to apportion the sources of nitrate in rainwater (Eriksson, 1959; Freyer, 1978; Freyer, 1991). Later, with the aggravation of air pollution worldwide, the isotope technique was applied to apportion the sources of nitrate in TSP, PM10, and PM2.5 (Widory, 2007; Zong et al., 2017; Lin et al., 2021). With the establishment of the N/O isotopic composition data pool of different sources and the development of source apportionment models, the nitrogen/oxygen (N/O) isotope technique has now been widely used to trace the sources of NO3−/NOx in the atmosphere (Song et al., 2019; Zong et al., 2020a; Lin et al., 2021).
The nitrogen stable-isotope composition of nitrate (δ15N–NO3−) is influenced by the sources of NOx and shows spatial and temporal variability due to the impact of different human activities (Felix et al., 2012; Felix & Elliott, 2014; Walters, Goodwin, & Michalski, 2015; Fibiger & Hastings, 2016; Zong et al., 2020b). The δ15N–NO3− technique has been well extended with the continuous investigation of the nitrogen isotopic compositions of NOx. Felix et al. measured δ15N–NOx of coal-fired power plant (Felix, Elliott, & Shaw, 2012) and that of NOx emitted from soil and animal manure (Felix & Elliott, 2014), finding that the δ15N–NOx value of coal-fired power plant was higher than that of NOx from other emission sources. Walters and Michalski (2015) measured δ15N–NOx of gasoline and diesel vehicles and found negative correlations between δ15N–NOx and the NOx concentration as well as the vehicle running time. Miller et al. (2018) revealed a significant difference of δ15N–NOx in the agricultural land applied with different fertilisers, which was affected by nitrification and NO consumption. In general, the δ15N–NOx value of NOx from coal combustion is higher than that from vehicular or soil emissions.
The nitrogen isotope fractionation is related to the oxygen isotope fractionation during the reaction of NOx to form NO3−. Therefore, the measurement of oxygen isotope can be used to evaluate the nitrogen isotope fractionation effect (Walters & Michalski, 2015, 2016). Generally, the oxygen stable-isotope composition of nitrate (δ18O–NO3−) is dependent on the contributions of different reaction pathways to NO3− formation. Thus the stable oxygen isotope is a powerful tool to efficiently evaluate the contributions of different formation mechanisms of nitrate. According to the current research findings, the formation of NO3− is highly affected by the gaseous oxidation of NOx by ∙OH during the day and hydrolysis of N2O5 at night (Alexander et al., 2009). Besides, the reaction of NO3 + HC/DMS may also contribute highly to NO3− formation under heavy pollution conditions. According to the work of Hastings, Sigman, and Lipschultz (2003), for NO3− formed during the reaction of ∙OH + NO2, 2/3 of δ18O–NO3− comes from NOx and 1/3 of δ18O–NO3− comes from ∙OH; meanwhile, for NO3− formed during the hydrolysis of N2O5, 5/6 of δ18O–NO3− comes from O3 and 1/6 of δ18O–NO3− comes from H2O. Generally, higher δ18O–NO3− is associated with O3 (+90%0–+122%0 δ18O) oxidation, while lower δ18O–NO3− is associated with ∙OH (−25%0–0%0 δ18O) oxidation (He et al., 2018; Wu et al., 2021; Zhang et al., 2021). Zong et al. (2020b) measured δ18O–NO3− in five megacities in China in 2013–2014 and observed significant seasonal variation of δ18O–NO3−. The ∙OH + NO2 reaction contributed highly to NO3− in summer, with the contribution reaching 58.0 ± 9.82%, but the contribution of ∙OH + NO2 was relatively low in winter, with a contribution of 11.1 ± 3.99%. Zhang et al. (2021) estimated the contributions of different mechanisms to NO3− formation in Beijing during the winter of 2017–2018, and the contributions of ∙OH + NO2, N2O5 + H2O, and NO3 + HC to NO3− formation were 45.3%, 46.5%, and 8.2%, respectively.
3.3. Limitations of the source apportionment methods of nitrate
By tracing the direct emission sources of NOx, the nitrogen/oxygen (N/O) isotope technique coupled with the Bayesian isotopic mixing model can be effectively used to apportion the sources of NO3−. However, the sources resolved by this method are limited by the availability of N/O isotopic composition of each source. The MixSIAR model can only quantify the contributions of sources with known isotopic composition. Previous studies mostly included vehicular emission, coal combustion, biomass burning, and soil biogenic emission as the sources of NO3− (Liu et al., 2017; Song et al., 2019; Zong et al., 2020a, 2020b; Lin et al., 2021; Rai et al., 2021). However, other emission sources, such as industrial emissions and mineral dust, can also contribute to NO3− in the atmosphere. Besides, when the number of sources > the number of isotopic tracers + 1, the MixSIAR model results would not be sole, and the sources resolved by the model could show a significant negative correlation. The significant negative correlation between the resolved sources indicates overlap and overestimation of such sources (Stock et al., 2018; Lin et al., 2021). For example, in previous studies, there were occasions when vehicular emission and biomass burning (Zhang et al., 2021) or coal combustion and biomass burning (Lin et al., 2021) could not be differentiated using the MixSIAR model.
In addition to the MixSIAR model based on the isotopic technique, the positive matrix factorization (PMF) model based on chemical tracers is also a powerful tool for apportioning the sources of atmospheric aerosols (Zong et al., 2018). Based on a large quantity of samples and careful selection of source tracers, PMF can provide a full view of the sources of atmospheric aerosols. Therefore, the PMF source apportionment result may compensate for the limited sources resolved by the isotope technique. However, while the PMF model can differentiate primary sources and secondary formation, it is difficult to link the species that are largely formed in the atmosphere to the direct emission sources, which happens to be the strength of the isotope technique (Zhu et al., 2018). Therefore, combining the two methods, isotope/MixSIAR and PMF, appears to be a promising direction for apportioning the sources of NO3−, which will not only provide complete information on the contributing sources but also quantify the primary and secondary contributions of different sources.
4. IMPLICATIONS FOR AIR POLLUTION CONTROL
Major cities in East Asia, such as Beijing and Ulaanbaatar, are still facing severe air pollution problems. In recent years, strict measures on air pollutant mitigation have been implemented in China, leading to a rapid transition of energy demand from solid fuels to cleaner energy, such as natural gas. For example, Beijing has 100% completed the Clean Heating Plan for Northern China in Winter and used natural gas instead of coal for central heating in winter (Ai et al., 2023). In Beijing, owing to the efforts on air pollution mitigation, the particulate SO42− has decreased by 63% (from 24.0 µg m−3 to 7.4 µg m−3) and the particulate NH4+ has decreased by 51% (from 15.5 µg m−3 to 7.6 µg m−3) in 2013–2020. Compared to SO42− and NH4+, NO3− showed a smaller reduction of 44% (from 24.9 µg m−3 to 14.0 µg m−3) and has become the dominant inorganic species in PM2.5 (Lei et al., 2021). During the haze episodes, the mass percentage of NO3− in PM2.5 can reach as high as 50% (Sun et al., 2015), indicating that NO3− could be one of the key factors driving the occurrence of heavy pollution. In Ulaanbaatar, SO42− is still the dominant inorganic species in PM2.5 due to the high dependence on coal combustion. However, the government has implemented several mitigation measures to reduce air pollutants, mainly targeting stationary sources with coal combustion. It is predictable that NO3− will also become the major pollutant in PM2.5 in Ulaanbaatar as a result of the control measures, similar to the evolution of air pollution in Beijing. Therefore, understanding the pollution characteristics and sources of NO3− in the atmosphere would help to formulate effective measures to mitigate local air pollution.
5. ACKNOWLEDGEMENT
This work was supported by the Asia-Pacific Network for Global Change Research (CRECS2020-01MY-Tseren-Ochir).