Farmers’ perceptions on the impact of climate change: Case study of the agricultural sector of Cambodia
HIGHLIGHTS
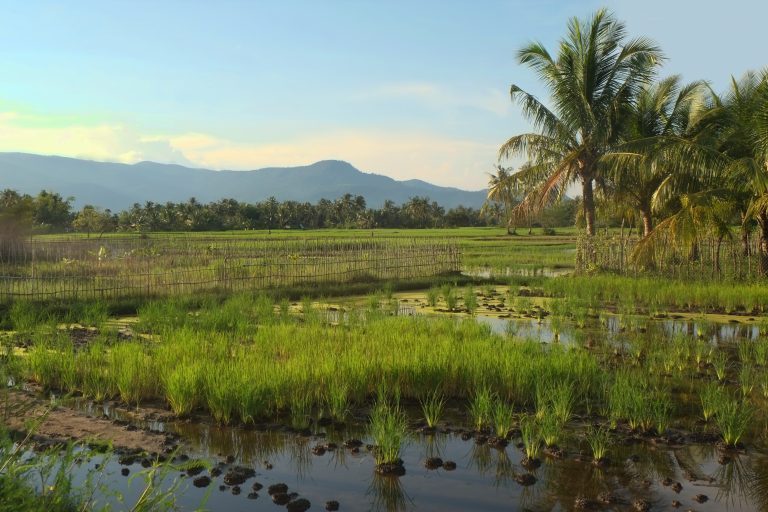
- Cambodia is an agrarian country that mostly depends on climatic condition.
- Cambodia farmers perceived climate change impacts on daily livelihood and agricultural practices.
- Some adaptation options were found; however, more farmers do nothing to respond to climate change.
- Future intervention on cropping calendars appropriate for climate change adaptation should be prioritised.
1. INTRODUCTION
Cambodia is an agricultural country in Southeast Asia that frequently faces the challenges of climate change. The impacts of climate change have manifested in various ways, notably through rising sea levels, increasing temperatures, and shifts in precipitation patterns. Consequently, Cambodia has experienced far-reaching effects across all sectors, with some areas being particularly severely affected, such as agriculture, water resources, forest ecology, coastal regions, public health and infrastructure. The Ministry of Environment (MoE) survey in 2011 and 2015 regarding climate change impacts indicated that 98% of total respondents had experienced climate variabilities and extreme weather change, such as increasing temperatures and irregular rainfall in their regions (Ministry of Environment [MoE], 2016).
However, climate change has impacted many countries globally, and Cambodia is one of the most vulnerable countries due to limitations on adaptation capacity, particularly in the agricultural sector (De Young, Soto, Bahri, & Brown, 2012). Although many people sense climate change, the number of people who understand the causes and adaptation to climate change is relatively low (MoE, 2016; NCSD/MoE, 2020). Since Cambodians are likely to experience the anticipated increase of effects from climate change directly, it is crucial to understand how they have encountered and responded to climate change. Rice production and livestock are the most susceptible to climate change disasters such as floods, drought, and pest and disease outbreaks (Ros, Nang, & Chhim, 2011).
This study seeks to evaluate the perception of farmers regarding the impacts of climate change and to identify the coping mechanisms they currently employ for climate change adaptation. The result of this assessment will contribute to climate change risk reduction, strengthening climate change adaptive capacity and adaptation planning.
2. METHODOLOGY
The main approaches for data collection were inclusive, participatory and rights-based. Household surveys were utilised as a key tool for this research. Quantitative and qualitative approaches were employed using questionnaires, with closed and open-ended questions and observation, which were used for interpreting and clarifying results. The samples were selected from villagers living in a target area longer than ten years using a random sampling technique with 320 sample sizes based on the number of households in the target area. The sites selected for the study were eight districts in the following four provinces: Preyveng, Kampot, Kratie, and Preahvihear. The sample size was applied equally to each targeted province (80 sample/province). These provinces were identified as Cambodia’s most vulnerable to climate change (Yusuf, 2010). These provinces frequently face flooding, drought, pest outbreaks, and lightning strikes, which are signs of vulnerability to climate change. IBM’s statistical software, SPSS version 21, was used to analyse data, mainly descriptive statistics (frequency and percentage). Microsoft Excel was used for creating tables and figures.
3. RESULTS AND DISCUSSION
Table 1 represents the demographic characteristic of respondents and other independent variables. Male-headed and female-headed households accounted for 80% and 20% of the total respondents, respectively. Female-headed households included widows, divorcees, those with sick or disabled husbands, or husbands who migrated for employment outside the village/province. Although the agricultural population of males (48%) and females (52%) are not significantly different (FAO/GSO/MoP, 2010), climate change affected men and women differently, with women seeming to be the more vulnerable (CDRI, 2021). For example, research showed that men tended to be stronger physically, allowing them to do heavier work, such as the ability to carry water for greater distances during times of drought. As a result, women’s farms suffered damage due to insufficient water to irrigate. In short, that research concluded that women’s climate change adaptive capacity was limited in comparison to men. It was also noted by various research outputs that women experienced greater vulnerability due to generally having less access to education (Ikeda et al., 1995; Miller & Rodgers, 2009; Vyas & Watts, 2009).
| Item | Frequency | Percentage (%) | Max | Min | Mean | Std. | |
|---|---|---|---|---|---|---|---|
| Household head sex | Male | 256 | 80 | ||||
| Female | 64 | 20 | – | – | – | – | |
| Total | 320 | 100 | |||||
|
|
|
|
|
|
|
|
|
| Age | 19–30 years | 26 | 8 | ||||
| 31–40 years | 73 | 23 | |||||
| 40–50 years | 85 | 27 | 80 | 19 | 46.64 | 12.27 | |
| Above 50 years | 136 | 43 | |||||
| Total | 320 | 100 | |||||
|
|
|
|
|
|
|
|
|
| Household size | 1–3 Persons | 56 | 18 | ||||
| 4–6 Persons | 203 | 63 | |||||
| Over 7 Persons | 61 | 19 | 12 | 1 | 4.87 | 1.73 | |
| Total | 320 | 100 | |||||
|
|
|
|
|
|
|
|
|
| Land size | Less than 1 hectare | 104 | 33 | ||||
| 1-5 hectares | 183 | 57 | 14.50 | 0.01 | 2.38 | 2.14 | |
| More than 5 hectares | 33 | 10 | |||||
| Total | 320 | 100 | |||||
|
|
|
|
|
|
|
|
|
| Education | Illiterate | 68 | 22 | ||||
| Primary School | 144 | 45 | |||||
| Secondary School | 71 | 22 | 15 | 0 | 4.34 | 3.15 | |
| High School | 27 | 9 | |||||
| University | 8 | 2 | |||||
| Total | 320 | 100 | |||||
|
|
|
|
|
|
|
|
|
| Perceptions of temperature change | Temperature changed | 295 | 92 | ||||
| Temperature not changed | 25 | 8 | – | – | – | – | |
| Total | 320 | 100 | |||||
|
|
|
|
|
|
|
|
|
| Perceptions of precipitation change | Precipitation changed | 293 | 92 | ||||
| Precipitation not changed | 27 | 8 | – | – | – | – | |
| Total | 320 | 100 | |||||
|
|
|
|
|
|
|
|
|
| Access to irrigation | Accessible | 206 | 64 | ||||
| Inaccessible | 114 | 36 | – | – | – | – | |
| Total | 320 | 100 | |||||
|
|
|
|
|
|
|
|
|
| Access to water extension service | Accessible | 135 | 42 | ||||
| Inaccessible | 186 | 58 | – | – | – | – | |
| Total | 320 | 100 | |||||
|
|
|
|
|
|
|
|
|
| Access to credit | Available | 158 | 49 | ||||
| Unavailable | 162 | 51 | – | – | – | – | |
| Total | 320 | 100 | |||||
|
|
|
|
|
|
|
|
|
| Access to climate information | Accessible | 141 | 44 | ||||
| Inaccessible | 179 | 56 | – | – | – | – | |
| Total | 320 | 100 | |||||
| Note: Max = Maximum Value; Min = Minimum Value; Std. = Standard Deviation. | |||||||
The proportion of 43% of respondents were above 50 years, 26% were between 19–30 years, and the rest were between 30–50 years. FAO/GSO/MoP (2010) reported that the age group between 30–50 years is active age Cambodian agriculture due to their experience in farming, power, education, and so on. Similarly, this research found that those aged above 50 years had limited access to education and information and experienced problems with health (e.g., illness). We found that while some young respondents aged 19–30 faced job shortages in farming, they had some experience in cultivation.
The household size shows 63%, 19%, and 18% of the respondents had four to six members, more than seven members, and less than three members, respectively (Table 1). In this research, the average number of people per family is 5.1, which seemed higher than in other research (4.7 persons per family), with average female-headed households as four people per family, while the male-headed average was 4.9 (NIS, 2015; San, Sriv, Spoann, Var, & Seak, 2012).
Furthermore, the average land size held by respondents was 2.38 hectares, with 57% having 1–5 hectares and 10% greater than five hectares (Table 1), which is higher than the average domestic farming area was only 1.4 hectares reported in NIS (2015). The higher average in the study can be caused by the site selection of the province (Battambang province) with the most significant agricultural land size in Cambodia. However, 33% of respondents held less than 1 hectare for farming.
The respondents’ education shown in Table 1 indicated that 45% were educated in primary school, 22% in secondary school, 9% in high school, and 2% in university. From the analysis, 22% of respondents identified as illiterate and having difficulties in reading or writing. Moreover, illiteracy poses challenges in understanding information on new agricultural technologies and strategies to adapt to climate change.
The general perception of respondents on long-term changes in temperature over the years showed that 92% noticed the temperature change, while 8% said that the temperature stayed the same (Table 1). Regarding the perception of long-term precipitation, 92% claimed that the precipitation has changed in their community, while the rest (8%) noticed no change (Table 1). Therefore, the majority of farmers expressed experiencing climate change in their community.
The accessibility of respondents to the irrigation system (Table 1) was 64%, but not sufficient water for their farming needs, while 36% could not access the irrigation system. The result indicated that their farming solely depended on rainfall. An extension service was said to be very important for improving farming productivity in the community. However, 42% of respondents mentioned that they had never received an agricultural extension service, while 58% used to access it (Table 1). Access to credit was necessary in farming when farmers wanted to expand production or faced unexpected circumstances. In this case, the research found that half of the respondents could not access credit to improve their farming. Table 1 also illustrates respondent perceptions of climate change information, such as meteorology information. More than half of respondents (56%) reported difficulties accessing climate information, limiting their ability to adapt to climate change.
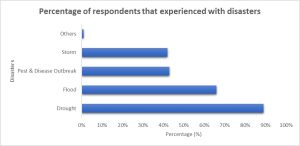
Respondents acknowledged that they experienced disaster impacts. The negative impact of the disaster on the following factors: food availability, agricultural production, health, education, water resource, and infrastructure. Multiple disasters and their effects on communities were reported during the survey in target areas, with at least three types of disasters reported. Drought and flood were the most common disasters that occurred in the target areas and were reported by the majority of the respondents (89% and 66%, respectively). Pest and disease outbreaks were also reported by (43%) of the respondents, followed by storms (42%). Regarding the frequency of the occurrences encountered by households, the average incidents were reported 3 to 4 times drought (range from 1 to 6 times) and 2 to 3 times Flooding (range from 1 to 5 times) within the last ten years (Figure 1).
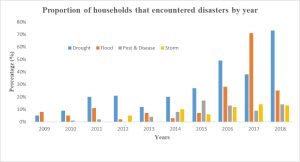
From 2009 until 2018, there were notable increases in the number of reported disaster incidents encountered by households in the target area (Figure 2). In 2011, a steady increase in drought was observed from 5% to around 73%, pest and disease outbreak was nil to 17%, and the storm was nil to 14%. However, floods were steady from 2009 to 2015 and rapidly increased from 10% to 71% by 2018. These reported variations and increases cause significant negative impacts on households in target areas’ living and economic conditions.
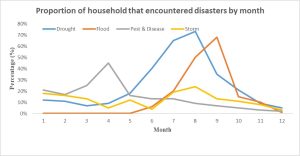
Regarding seasonal variation in disaster occurrence, a relatively higher proportion of households reported that disasters were more frequent in the wet season than in the dry season (Figure 3). However, drought and flood were experienced in similar proportions. Pest and disease outbreaks and storms were reported throughout the year. Drought commonly extended from May to September (peaking in August), whereas floods frequently lasted from August to October (peaking in September).
Perceived general impacts were also captured during the survey by asking respondents to list and rank impact areas by disaster type. The level of disaster impact seemed to be very high across all types of disasters according to different sectors, including agricultural production, livestock production, health issues, water utility (use, quality, and availability), household assets, and educational access for children.
| Type of impact | Percentage by disasters | |||||
|---|---|---|---|---|---|---|
|
|
|
|
|
|||
| N | Percent | Drought | Flood | Pest and disease | Storm | |
| Crop loss | 314 | 98 | 88 | 70 | 41 | 17 |
| Animal loss | 86 | 27 | 22 | 20 | 3 | 3 |
| Human health incidents | 118 | 37 | 32 | 26 | 2 | 34 |
| Lack of water | 170 | 53 | 49 | 19 | 2 | 1 |
| Loss of household assets | 16 | 5 | 3 | 4 | 1 | 56 |
| No access to education | 26 | 8 | 5 | 7 | 1 | 1 |
| Adaptation strategies | Respondents’ percentage (%) |
|---|---|
| No adaptation | 8.1 |
| Changing the planting/harvesting date | 35 |
| Change Varieties | 20 |
| Change the level of input | 19.2 |
| Invest in an irrigation system | 17.7 |
| Total number of respondents | 320 |
All households (100%) in the target areas reported negative impacts from disaster occurrences. Nearly all respondents (98%) encountered loss of crop products from disaster impacts (mainly drought and flood). Around 40% claimed crop loss, a negative impact of pest and disease outbreaks. Approximately half of the households were concerned by a lack of water due to drought and flood. In addition, nearly one-third of respondents mentioned human health incidents and animal loss, describing storms as a source of these issues. Out of all respondents, almost half reported that drought had the most severe impact on crop loss and similar proportions with crop loss due to flooding. Drought was considered the primary source of negative impacts due to water scarcity and affected human health. At the same time, the flood was considered the main cause of animal loss. Overall, disasters such as drought and flood significantly impact household economic status due to the destruction of crops, scarcity of water utility, and incidents of human disease (Figure 2, Table 2).
Table 3 describes strategies that farmers used to adapt to climate; as a result, those who mentioned that they had taken action in adapting to climate change indicated the following varieties of adaptation strategies: changing in planting/harvesting date, change of rice varieties, investment in the irrigation system, changing level of input. These adaptation strategies were similar to findings from research conducted in the region near Cambodia (Afifi et al., 2016; Dharmarathna, Herath, & Weerakoon, 2014; Mainuddin, Kirby, & Hoanh, 2011). The results indicated that 35% of surveyed farmers decided to change the planting/harvesting date to minimise the impact of climate change. Furthermore, 20% of respondents choose to change their rice variety, such as using those tolerant to drought, flood, and pests. Changes to input levels for rice production were reported by 19.2% of respondents as an option, and 17.7% mentioned investment in an irrigation system as their choice. It was also revealed that 8.1% of experienced respondents do nothing despite them realising how climate had already affected their farming. Overall, farmers who apply changing planting/harvesting dates tend to adapt better to climate change as they can minimise the negative impact and reduce the risk.
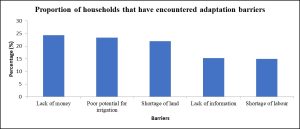
Some barriers were reported by respondents in adaptation to climate change, as shown in Figure 4. Those who did nothing in response to climate change provided reasons such as insufficient resources (money), lack of irrigation system, shortage of land, limited information, and shortage of labour. Lack of money, lack of irrigation system, and shortage of land were mentioned by 24.3%, 23.4%, and 22% of respondents respectfully. Lack of information and shortage of labour was 15.3% and 15%, respectively. Thus, these findings point to a lack of choice for some farmers in adopting methods to respond to climate change. To deal with these issues, the Royal Government of Cambodia have been developing and implementing some policies and strategic plan for climate change adaptation, such as the Cambodia Climate Change Strategic Plan 2014–2023.
4. CONCLUSION
Several types of disasters, such as drought, flood, storm, pest and disease outbreaks, were commonly experienced by most households surveyed in the target areas. Farmers already perceived these impacts. These impacts have a significant and serious effect on the livelihoods and social activities of target households due to the destruction of crop production, loss of livestock production, limit to availability and accessibility of water for household uses, destruction of household assets or property, increase in commodity prices, and poor access to social services. It is evident from the survey results that drought occurrences have the most significant impact on the economic destruction of households in the target areas due to their frequency, and damage is higher if compared to other disaster types. Followed by drought, flood is also one of the significant disaster effects on livelihood.
Based on the practices of farmers, changing planting and harvesting dates emerges as the most favourable choice for climate change adaptation. This option proves to be cost-effective and helps minimise the risks associated with climate change in agricultural activities. Another popular strategy among farmers is the adoption of different crop varieties that can better tolerate the current climate conditions and align with market demands. However, some farmers face challenges in implementing adaptation strategies. Changing the level of inputs and investing in irrigation systems are considered secondary options due to their high costs, which make them less accessible to some farmers who cannot afford such investments. Additionally, some farmers cannot take any action despite acknowledging climate change, primarily because they lack the capacity to cope with its effects.
For Cambodian farmers, the obstacles in adapting to climate change include financial constraints, limited potential for irrigation, land scarcity, lack of information and labour shortage. These challenges hinder their ability to effectively address and prepare for the impacts of climate change on their agricultural practices.
5. ACKNOWLEDGEMENT
The author would like to acknowledge the Asia-Pacific Network for Global Change Research (APN) for supporting this research publication under the project referenced CBA2021-09SY-Sopheak.