
Environmental and economic impact assessment of the Low Emission Development Strategies (LEDS) in Shanghai, China
Highlights
- By the implementation of LEDS through slower socioeconomic development and stronger energy efficiency policies, the cumulative carbon emissions can be reduced by approximately 17.6 MtCO2-eq.
- LEDS present excellent opportunities to contribute significantly to job creations and raise GDP by the tertiary sector.
- Shanghai’s government should continue to pursue its policy to relocate its heavy industry to make room for the tertiary sector.
1. Introduction
The concept of LEDS has been included in the negotiating texts under the UNFCCC since the run-up to COP15 in Copenhagen in 2009 and is part of both the Copenhagen Accord and the Cancun Agreements (United Nations Framework Convention on Climate Change, 2011), which recognize that LEDS is indispensable to sustainable development and that incentives are required to support the development of such strategies in developing countries. In practice, the plans are often combinations of new and existing elements, all combined in a new way to address pre-existing policy objectives along with the need to slow climate change and prepare for its impacts. A growing number of international organizations and consultancies have also been involved in LEDS, including the UNDP, UNEP, the World Bank (including through its Energy Sector Management Assistance Program (ESMAP), Climate Works, the Climate Development Knowledge Network, WWF, the European Union and a variety of bilateral donors. Japan currently has an edge in the majority of environmental and energy technologies. However, it is vital to layout medium- to long-term LEDS to keep responding to global needs in the future and contribute to the reduction of 50% global GHG emission by 2050.
1.1. Policy structure and LEDS in Shanghai
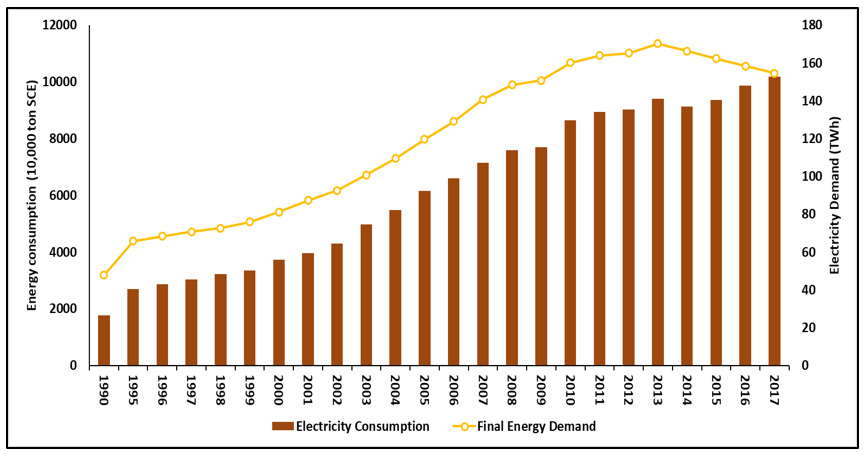
Shanghai is one of the four direct-controlled municipalities of China, with a population of more than 26.3 million as of 2018, rendering it the most populous city in China. Shanghai covers an area of 6340 Km2, and is divided into 16 districts. The centre city of Shanghai bounded with the outer ring road covers an area of 660 Km2 (Cui & Shi, 2012). According to the latest issued Shanghai 2035 Master Plan, Shanghai has different management policies and planning targets upon the different spatial scales of the city (World Wide Fund for Nature, 2012). Shanghai shows one growing city power in the global cities network with rapid social-economic development in recent years. In the 2011-2016 Global Power City Index (GPCI) issued annually by Mori Memorial Foundation, Japan, Shanghai’s rank in 40 global cities grew from 26th place in 2011 to 14th in 2013 and 12th in 2016, with the comprehensive power comparison including economy, research and development, culture interaction, livability, environment and accessibility (Yamato, Hamada, Matsuda, Dustan, & Taki, 2017). With the rapid growth of the population and urbanization in recent years, the demand for energy has also increased, resulting in the growth of the total energy consumption in Shanghai. The six drivers include (1) population and urbanization, (2) economic growth, (3) industrial structure, (4) technology progress and innovation, (5) welfare, and (6) energy supply structure. These main drivers impact Shanghai’s energy consumption and related emissions. Shanghai’s economy has built up in the post-1978 reform era. Its GDP increased from 25 billion CNY in 1995 to 494 billion CNY in 2018 (Census and Economic Information Center, n.d.). The historical trends of final energy demand and electricity consumption are depicted in Figure 1 which shows the rapid growth of energy consumption from 2001-2010, with the highest growth rate in 2005 of up to 9.2 %., After that, energy consumption decreased in the period 2011-2015 (Shanghai Municipal Bureau of Statistics, 2017). Among all sectors in Shanghai, the industry sector, including the mining, manufacturing, power, and construction accounts for the largest consumer of energy, followed by the transport sector and other sub-sectors in the tertiary industry. Energy supply mainly relies on fossil energy and electricity imported from other provinces, and the share of new energy is still negligible.
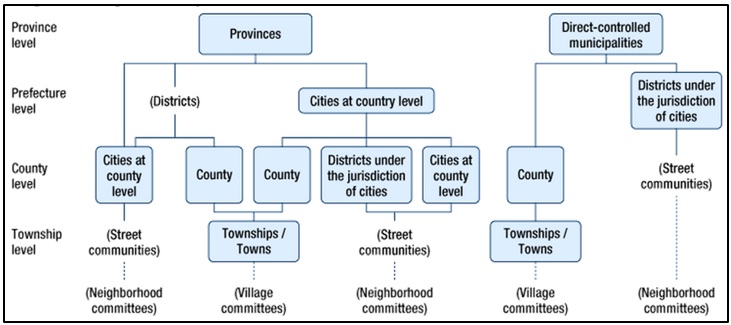
The strong vertical linkage between the central government and local government provides the favourable institutional setting for LEDS experiments. In China, municipal authorities are required to achieve targets set by the central government, although the actual input may vary greatly depending on their level of motivation and capacity. There are three layers of plans in the policy related to spatial planning and territorial development in China; socioeconomic development plans, national spatial plans (land use plans), and urban and rural plans. Socioeconomic development plans are drafted at the national, provincial, prefectural and county levels. Urban and rural plans can be divided into urban system plans, urban plans, town plans, township plans, and village plans. Urban and rural plans are drafted at the national, provincial, prefectural, county, township, and village levels (see Figure 2). Such an institutional setting leaves much room for local governments to conduct policy experiments aiming at policy learning while fulfilling the task. Shanghai is designated as a Pilot Low-carbon City, which opened opportunities for various policy experiments to incubate innovations. With the city’s efforts, several creative policy practices emerged in Shanghai, e.g., introducing regular planning cycle at a local level, and going beyond the top-down target (Cheng, Kamath, Rowe, Wood, & Yue, 2014). In this sense, the vertical cooperation of governments across levels presented in the case of Shanghai is facilitated by the institutional setting in China.
There are several characteristics of Shanghai’s LEDS, as summarized below. The city’s LEDS are embedded and integrated into the existing policy framework instead of an entirely new strategy. LEDS in Shanghai can be divided into two stages:
- The implicit stage: Before 2009, which is the implicit stage, Shanghai has been on its way to adjusting industrial structure, improving energy efficiency and controlling air pollution, etc., the co-benefits of which contribute to GHG control.
- The explicit stage: The Shanghai LEDS were precisely introduced as an integrated policy strategy, tackling multiple challenges in this city. The LEDS were rooted in the city’s existing policy framework. The approach of hooking “low-carbon” onto other local policy schemes is common and not necessarily initiated in Shanghai. However, Shanghai’s LEDS are more than re-interpreting traditional policy schemes with low-carbon implication, but with new low-carbon policy measures such as local pilot low-carbon developing districts, and carbon labelling.
Shanghai LEDS to reduce its energy-related challenges are divided into the following categories:
- Developing renewable energies,
- Increasing gas supply, and
- Improving energy efficiency, particularly in industries, transport, and buildings.
2. Methodology
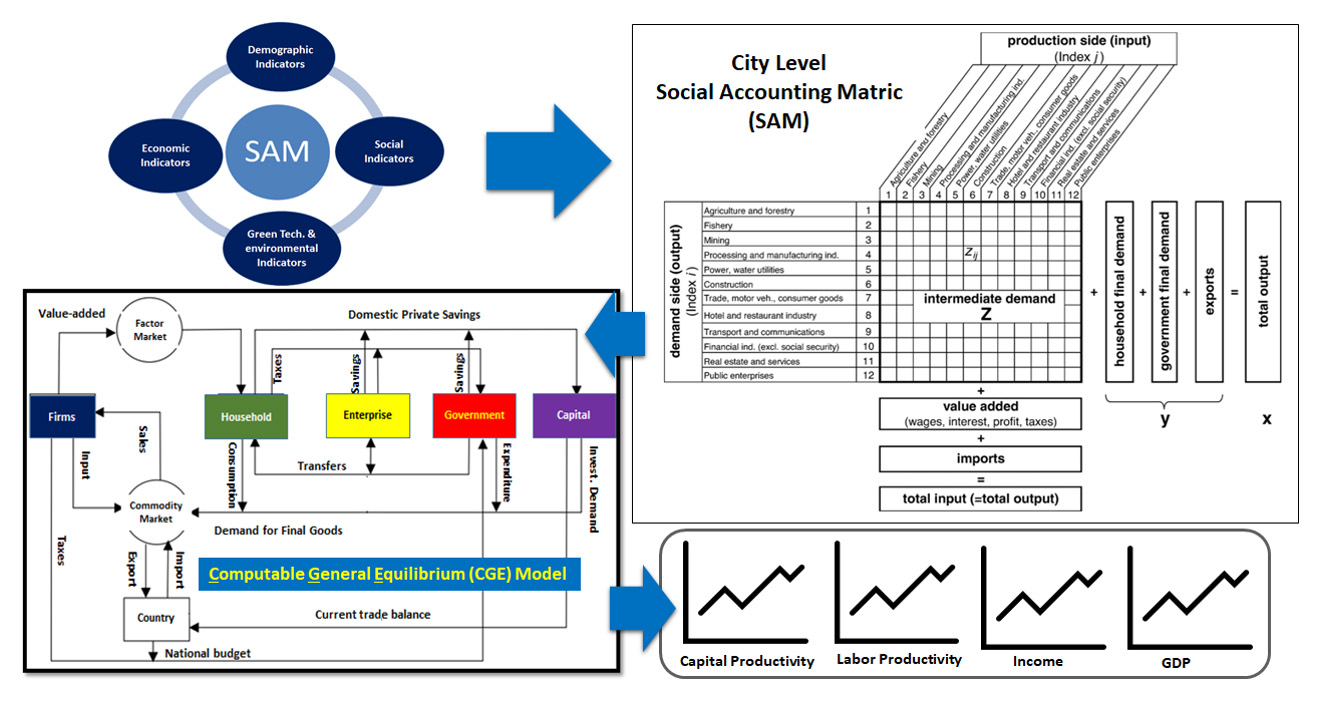
To evaluate the multiple benefits of the implementation of LEDS in Shanghai, a city-level CGE (computable general equilibrium) model was developed based on the general equilibrium theory. It uses actual economic data from a SAM (Social Accounting Matrix) which is an accounting framework that reflects the circular flow of city’s economic activity to estimate how a city might react to changes in clean energy policies. The CGE model has two main parts: supply and demand. On the supply side, the microeconomic principles have been utilized to develop a concept that would represent the behaviour of an urban energy system in a market with perfect competition. The local government, as a decision-maker in this market, strives for maximum satisfaction (minimization of the total cost) of delivering certain energy services to the end-users, such as providing required electricity at the end-user level (Farzaneh, Doll, & Puppim de Oliveira, 2016). The modeling approach used to formulate the above concept is given below (Farzaneh, 2017a):
\(Min Total Cost = \sum_i F_i p_i \) (1)
Subject to
\(f (F_i, … , F_n) \geq D^* \) (2)
\(\sum_i F_i \leq R_i \) (3)
\(F_i \leq L_i \) (4)
\(F_i \geq 0 \) (5)
Where:
\(F_i\): production factor \(i\) such as (energy, material and capital)
\(D^*\): Given demand for the utilities
\(R_j\): Available resource of production factor \(i\)
\(L_i\) Bound on using or consumption of production factor \(i\)
\(P_i\): Unit cost of determinant factor \(i\) (i.e. cost of technologies and energy carriers)
On the demand side, a spreadsheet simulation model based on bottom-up end-user method and the Avoid-Shift-Improve (A-S-I) approach was applied to the end-user level (buildings, transport, and waste) to assess the effect of different scenarios of socioeconomic, technological, and demographic developments on energy consumption and emissions of the city-wide energy system in a multi-sectoral context (Farzaneh, 2017a). The model systematically relates the GHG and air pollution emissions based on the specific energy demand in the end-user sectors in cities to the corresponding social, economic, and technological factors that affect this demand (Figure 3). The CGE model was implemented as a mixed-integer linear programming problem using the GAMS (General Algebraic Modeling System) to find the minimum total cost of delivering a certain level of energy service through the optimal combination of available technologies and resources in the urban energy system (Farzaneh, 2017b; Farzaneh, 2019).
3. Results and Discussion
3.1. Key drivers of Shanghai’s LEDS
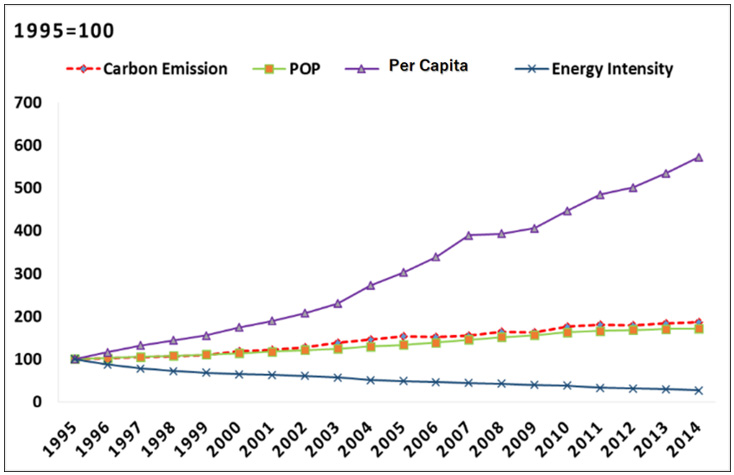
Population and economic growth are the two main drivers that are behind Shanghai’s urban expansion. Both population and economic growth in Shanghai have moderated since their height in 2007, yet both remain high, generating continued pressure on urban infrastructure. Figure 4 shows that as energy intensity decreased over the period, the economic growth partially decoupled from energy use. The combined growth in population and per capita GDP led to a dramatic increase in carbon emissions in this city between 1995 and 2014. Increases in population and per capita GDP result in more production and consumption activities, which, in turn, raise energy consumption and emissions. While Shanghai’s energy intensity decreased by 77%, this improvement in energy efficiency had minimal impact on carbon emissions, which means that most of the energy efficiency improvement is offset by increased energy consumption.
The results of the analysis of the historical trends of carbon emissions, population, per capita GDP, foreign direct investment and the different sector’s share of GPD are reported in Table 1.
| Elasticity | |
| Population | 0.1747 |
| Per Capita GDP | 0.3862 |
| Primary sector’s share of GDP | 0.0100 |
| Secondary sector’s share of GDP | 0.2950 |
| Tertiary sector’s share of GDP | -0.0959 |
| Foreign direct investment | 0.0624 |
Table 1. Carbon Intensity Elasticities in Shanghai.
Among the variables, per capita GDP (0.386), population (0.175), secondary sector’s share of GDP (0.2950) and foreign direct investment (0.0624) are positively correlated with carbon emissions, whereas the tertiary sector’s share of GDP is negatively correlated (-0.0959). Shanghai’s economic development has led to increased construction and land use development in both the residential and commercial sectors over the last few years. The increase in economic growth also brought forth Foreign Direct Investment (FDI), which has contributed to the higher energy consumption and carbon emissions of Shanghai. The secondary sector comprises energy-intensive, fossil fuel users and plays a leading role in increasing carbon emissions through enhancing both direct and indirect consumption resulting in increased carbon emissions. The negative value for the tertiary sector shows that the growth of this sector based on modern, knowledge-intensive, and service-based, has been effective in reducing carbon emissions. Therefore, Shanghai’s government should continue to pursue its policy to relocate its heavy industry to make room for the tertiary sector. Moreover, the local government needs to strengthen its economic restructuring policy, not only rely on technological improvements alone to reduce carbon emissions.
3.2. Shanghai Master Plan
According to the Shanghai master plan, the local government aims at introducing measures for controlling the population growth and construction in this city, which will result in improving public safety and local air quality. The detailed information about the Shanghai Master Plan 2016-2040 is given in Table 2 (Leading Group Office of Shanghai Master Plan, 2015).
| Objective | Target |
| Population Control | Population resident will be controlled at 25 million by 2040 |
| Construction land control | Construction land will be controlled at 3200 km2 by 2040 |
| Public transportation coverage | Length of Railway (designed speed as 100-250 km/h) planned to be more than 1000 km |
| Length of subway (designed speed as 80km/h)and light rail (60-80 km/h) increases to 1000 km | |
| Use of public transportation reach to 50% in main urban zone | |
| Use of green transportation researches up to 85% by 2040 | |
| The density of rail transit increases to 1.1 km/km2 in the city centre | |
| Rail transit accessible for the new town with a population more than 100,000 | |
| Green Space increase | Public green space per capital reaches to 15 m2 by 2040 |
| Forest coverage area reaches to 25% | |
| Public green space per capital reaches to 7.6 m2 by 2040 | |
| Green Building Construction | All newly built buildings should completely meet the green construction standard |
| Air Quality Improvement | The annual average concentration of PM2.5 which is controlled at 25 ug/m3 |
| Renewable energy and Climate Change Mitigation | The share of renewable energy reaches 20% in the total primary energy supply mix |
| Total carbon emission reduces to 85% of the peak emission by 2040 |
Table 2. Main objectives and targets in Shanghai Master Plan 2016-2040.
Required data for the multiple benefits assessment of the Shanghai Master Plan were mainly drawn from government statistical yearbooks. Shanghai’s energy data can be found in the China Energy Statistical Yearbooks (National Bureau of Statistics of China, 2018). Other statistics for Shanghai, including GDP, population, sectoral output, government investments in the environment, and foreign direct investment were obtained from the Shanghai Statistical Yearbook (Shanghai Municipal Bureau of Statistics, 2017). To simulate future changes in carbon emissions, we compared the results of the Shanghai Master Plan with three scenarios of future socioeconomic development. Among all determinants in all scenarios, GDP and population are the most important ones.
Meanwhile, the results reveal that energy consumption and renewable energy generation significantly affect carbon emissions in Shanghai. Based on the findings discussed above, four planning indicators were selected for scenario construction. The predicted values of these planning indicators were based on expert workshops and interviews with the local experts and also literature reviews. Accordingly, the average annual GDP growth rate for Shanghai is expected to be approximately 7% for 2016-2020 and 6% for 2020-2040 (Shanghai Municipal Bureau of Statistics, 2017). The indicators of population growth rate, GDP growth rate, Annual decrease rate of energy consumption and growth rate of the share of renewable energies in total energy mix were adjusted as shown in Table 3 to obtain the following four scenarios: slower socioeconomic development, rapid socioeconomic development and the master plan which was defined as a slower socioeconomic development with reinforced energy efficiency programs.
| Baseline | Slow Socio | Rapid Socio | Master plan | |
| Average annual growth rate of permanent population (%) | 1 | 0.5 | 1.3 | 0.5 |
| Annual GDP growth rate (%) | 7 | 6 | 8 | 6 |
| Annual decrease rate of energy consumption (%) | -5 | -5 | -5 | -6 |
| Share of Renewable energy in total supply (%) | <1 | <1 | <1 | 20 |
Table 3. Scenario definition for the LEDS assessment in Shanghai.
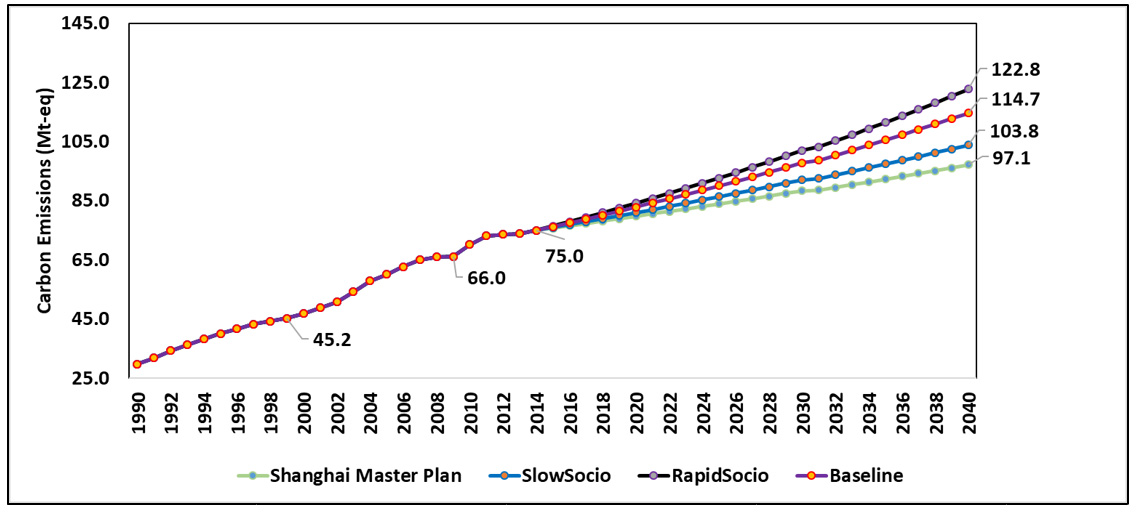
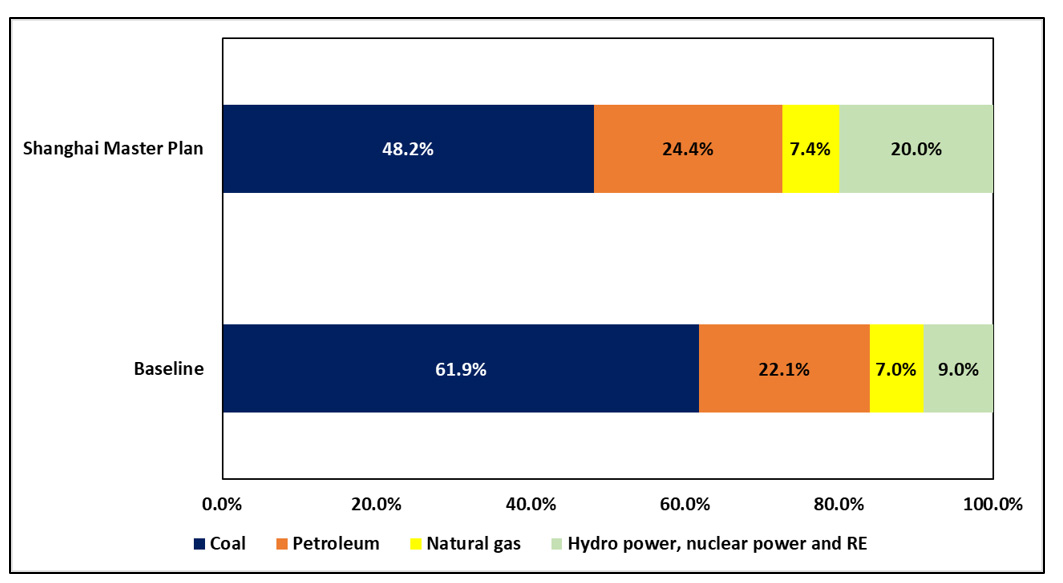
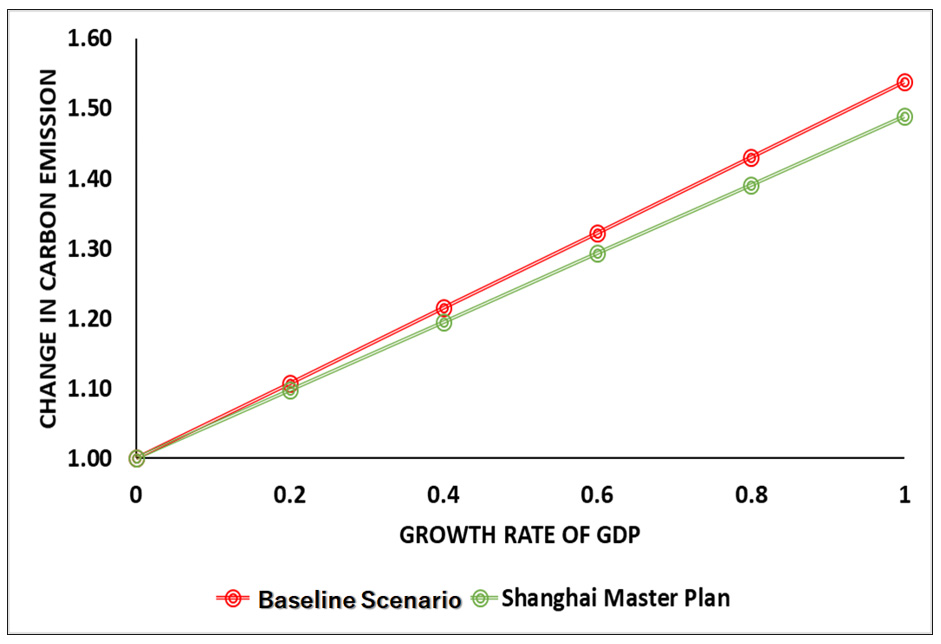
As shown in Figure 5, future carbon emissions in Shanghai show an increasing trend in all scenarios. The baseline scenario predicts that the cumulative carbon emissions will reach 114.7 MtCO2-eq., while three scenarios predict emissions of 103.8 (slow Socio), 122.8 (Rapid Socio), and 97.1 (Master plan), respectively. The master plan predicts the least amount of carbon emissions. Comparison of the master plan and the baseline scenario reveals that with slower socioeconomic development and stronger energy efficiency policies, the cumulative carbon emissions can be reduced by approximately 17.6 MtCO2-eq. Thus, reinforcing energy efficiency policies through relocating the carbon-intensive industries and making room for the knowledge-intensive and service-based tertiary sector could have a significant impact on reducing the total carbon emissions in Shanghai. Although current energy efficiency policies in electricity generation and industries in Shanghai are contributing to total carbon emission mitigation, it is difficult to ignore the fact that a high rate of socioeconomic development will increase carbon emissions in the absence of a major breakthrough in energy-saving technologies. This indicates that the implementation of the Shanghai master plan leads to more efficient resource use, and merely curbing the economic development and population growth does not improve efficiency and may even reduce the efficiency of resource use. The comparison between the energy mix in the baseline scenario and the master plan is represented in Figure 6. This effect is due to the rate of GDP growth being slower than the rate of carbon emissions growth as shown in Figure 7.
The major reduction in coal consumption is expected from boosting green mobility, shutting more outdated steel and coke capacity and gradually improving clean coal’s share in the industry sector through replacing it with natural gas and alternative fuels.
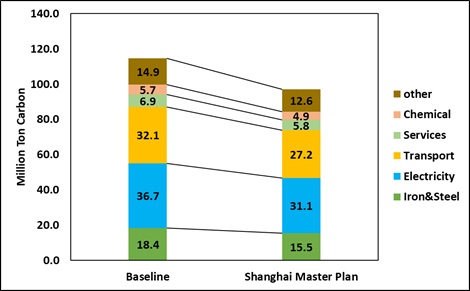
The decline in the total amount of carbon emissions from the major sectors such as iron and steel complexes, power plants, transport sector, service sector, chemical industries, and other sectors, compared to the baseline scenario is expected to be approximately 2.8, 5.6, 4.9, 1.1, 0.9 and 2.3 MtCO2-eq, respectively (Figure 8). As coal has often been criticized for its higher impact on the environment, Shanghai has made a move to close down smaller old coal-fired plants to open bigger high technology ones that not only have higher capacities but are also more energy-efficient. In fact, the older coal-fired plants are estimated to consume 30-50% more coal than newer models. While they make up for half of Shanghai’s yearly coal use, they can only generate 30% of Shanghai’s total power supply. For Shanghai Municipality, all power plants with small generation units of 2.108 GW shall be shut down during the implementation of the master plan. The Three Gorges Dam mainly generates the 8000 MW of Shanghai’s imported power. Acceding to the master plan, Shanghai municipality is supposed to import more hydropower, which is considered as renewable and clean energy to reduce its controversial high share of coal-generated power. Shanghai municipality will increase the wind power installed capacity to 200-300 MW in 2030.
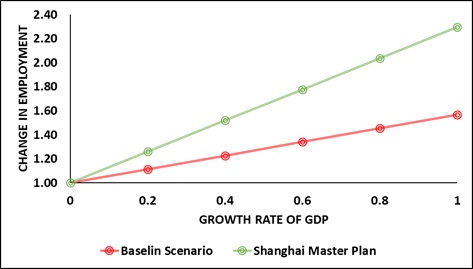
Nevertheless, offshore wind farms bear a higher potential for Shanghai in the future. While Shanghai tries to promote clean energies, it must be noted that the main goal will remain to ensure power supply security. Even state authorities acknowledge that renewable energies will only play a marginal role in the future, mainly because of higher generation costs and lack of space. Shanghai Municipality is favouring the extension of the domestic natural gas network as it is considered cleaner energy. Thus, efforts are made to increase the population’s access to natural gas, especially in populated areas. Comparison of the Shanghai master plan and other scenarios also shows that reinforcing energy efficiency policies will have positive effects on per capita carbon emissions and per unit GDP carbon emissions, and the lowest per capita carbon emissions occurred in the master plan. Hence, controls on economic development and population growth are essential in reducing total carbon emissions in Shanghai. However, it is challenging to realize sustainable socioeconomic development by controlling only economic development and population growth. Therefore, to achieve more sustainable and environmentally friendly socioeconomic development, evaluating the economic and social benefits of the Shanghai master plan is essential. Implementation of the Shanghai master plan presents excellent opportunities to contribute significantly to the job creations and raise GDP by the tertiary sector to increase the share of green employment in Shanghai total workforce by 46% in 2030, if LEDS technologies are acquired by China (Figure 9).
4. Conclusion
In this research, three scenarios of slower socioeconomic development, rapid socioeconomic development and the shanghai master plan, which was defined as a slower socioeconomic development with reinforced energy efficiency programs were considered. The significant reduction in coal consumption is expected from boosting green mobility, shutting more outdated steel and coke capacity, and gradually improving clean coal’s share in the industry sector through replacing it with natural gas and alternative fuels. In Shanghai, reinforcing LEDS will have positive effects on per capita carbon emissions and per unit GDP carbon emissions. Evaluation of the Shanghai Master Plan in Shanghai showed that the growth of the tertiary sector based on modern, knowledge-intensive and service-based would result in increasing the multiple economic-environmental benefits from this plan. Therefore, Shanghai’s government should continue to pursue its policy to relocate its heavy industry to make room for the tertiary sector. Moreover, Shanghai’s local government needs to strengthen its economic restructuring policy, not only rely on technological improvements alone to reduce carbon emissions.
Acknowledgement
We gratefully acknowledge the financial support provided by the Asia-Pacific Network for Global Change Research (CRRP2017-07SY-Farzaneh). We are grateful to data providers in China. We also thank all young scientists and students for their active involvement in this project.
References
- Cui, L., & Shi, J. (2012). Urbanization and its environmental effects in Shanghai, China.Urban Climate, 2, 1-15. doi:10.1016/j.uclim.2012.10.008
- Cheng W.H.T., Kamath G., Rowe k., Wood E. & Yue T. (2014). Low Carbon Shanghai: Avoiding Carbon Lock-In through Sustainable Urbanization. Cambridge: Belfer Center for Science and International Affairs
- Census and Economic Information Center. (n.d.). Retrieved from October 10, 2019 from https://www.ceicdata.com/en/china/gross-domestic-product-prefecture-level-city/cn-gdp-shanghai
- Yamato,N., Hamada, Y., Matsuda, M., Dustan, P., & Taki, N. (2017). Global Power City Index 2017. Institute for Urban Strategies, The Mori Memorial Foundation. Retrieved from October 10, 2019 from http://mori-m-foundation.or.jp/pdf/GPCI2017_en.pdf
- Farzaneh, H., Doll, C. N., & Puppim de Oliveira, J. A. (2016). An integrated supply-demand model for the optimization of energy flow in the urban system.Journal of Cleaner Production, 114, 269-285. doi:10.1016/j.jclepro.2015.05.098
- Farzaneh, H. (2019). Energy systems modeling: Principles and applications. Singapore: Springer.
- Farzaneh, H. (2017a). Development of a bottom-up technology assessment model for assessing the low carbon energy scenarios in the urban system.Energy Procedia, 107, 321-326. doi: 10.1016/j.egypro.2016.12.163
- Farzaneh, H. (2017b). Multiple benefits assessment of the clean energy development in Asian cities. Energy Procedia, 136, 8-13. doi:10.1016/j.egypro.2017.10.249
- National Bureau of Statistics of China. (2018). China energy statistical yearbook. Retrieved from October 10, 2019 from https://www.chinayearbooks.com/tags/china-energy-statistical-yearbook
- Shanghai Municipal Bureau of Statistics. (2017). Shanghai statistical yearbook 2017.Retrieved from October 10, 2019 from https://www.chinayearbooks.com/shanghai-statistical-yearbook-2017.html
- Leading Group Office of Shanghai Master Plan. (2015). 2040 Shanghai, Outline of Shanghai Master Plan (2015-2040). Retrieved from October 10, 2019 from https://img.thupdi.com/news/2016/01/1453791519864576.pdf
- UNFCCC (2011). Report of the Global Environment Facility to the Conference of the Parties. Retrieved from October 10, 2019 from https://unfccc.int/resource/docs/2011/cop17/eng/07.pdf
- WWF (2012). Baoding and Shanghai low carbon. Retrieved from October 10, from https://wwf.panda.org/?204411/Baoding-and-Shanghai-lowcarbon