
Energy and water footprints comparison of East Asia: A heterogeneity analysis
Highlights
- A database of energy and water use at the sectoral level was created for analysis.
- The national characteristics of embodied energy and water in East Asia were captured.
- The key sectors of embodied energy and water were identified.
1. Introduction
Water and energy are essential for economic activity and are closely linked to regional development (Fan, Feng, Dong, & Zhang, 2022). As the material basis for economic and social development, water and energy have been over-consumed in the last decades. Over the last two decades, the global annual per capita availability of freshwater has decreased by more than 20% (Food and Agriculture Organization of the United Nations [FAO], 2021), and the world’s total annual energy consumption has increased by 187.04 EJ (The British Petroleum Company plc [BP], 2021). In addition, on the one hand, economic and social development and population growth have exacerbated the worldwide energy and water crisis, especially in countries with energy and water shortages (Liu & Chen, 2020; McPhearson et al., 2016). On the other hand, accelerated globalization has improved the trade ties among different countries and regions (Fan, Zhang, Wang, & Wang, 2019). The global supply and production chains have not only fundamentally changed the way of production, exchange and consumption of commodities but also changed the location and scale of the environmental and social impacts they cause (Acquaye et al., 2017; Wiedmann & Lenzen, 2018).
As one of the most economically active regions, East Asia plays an important role in global supply chains. Major countries in East Asia have long maintained 8-10% GDP growth rates over time and have realized industrialization, urbanization, electrification, and motorization in 20-30 years (White, Hubacek, Feng, Sun, & Meng, 2018). East Asia’s total export as a share of total world exports grew from 17.8% in 2010 to 22.9% in 2020, and total import as a share of total world imports grew from 16.2% in 2010 to 19.2% in 2020 (Asian Development Bank [ADB], 2021). East Asian countries are still facing environmental and resource sustainability challenges with rapid economic development. All East Asian countries had less renewable inland freshwater resources per capita than the world average in 2017 (14017.8 m3 and South Korea’s renewable inland freshwater resources per capita are less than 1/10 of the world average (World Bank, 2021). In addition, economic development has led to a rapid increase in energy consumption in East Asia. For example, Chinese total energy consumption had tripled from 42.45 EJ to 145.46 EJ between 2000 and 2020 (BP, 2021 ). Therefore, ensuring water and energy security is crucial to achieving sustainable development goals for a country or a region.
In recent years, many studies have focused on the impact of the production and consumption of economies on environmental resources. The existing studies vary in the environmental indicators, with most focusing on single embodied energy or embodied water. For example, Rodríguez, Camacho, Almeida, and Molina (2021) identified the key sectors of embodied energy in Brazil through the MRIO method and distinguished the domestic and foreign energy use of various industries. The results showed that more and more domestic industries relied on foreign energy imports. The emission reduction responsibilities related to the end energy consumption of various departments were borne by different countries with the supply chain distribution. A few studies research the combination of the two indicators. Based on an input-output model, Fan, Chen, and Zhang (2020) investigated the impact of residents’ consumption activities on embodied energy and embodied water in China from a consumer perspective. The results showed that the electricity and agriculture industries were the key sectors with high energy and water consumption in 2012. Furthermore, large economies have been the focus of studies on embodied energy or embodied water, such as China (Zhang, Qiao, Chen, & Chen, 2016) and the EU (Camacho, Almeida, Rodriguez, & Molina, 2021), while the relevant studies of East Asian countries mainly focus on a single sector or single index and mainly discusses from the consumer side. Therefore, to explore the energy and water consumption caused by end consumption in East Asia from the sector level, this paper constructs a global multi-regional input-output table for 2014 based on the latest GTAP10 database and innovatively matches the sectoral water withdrawal database and energy use data for each country. On this basis, this paper analyzes the structural heterogeneity of sectoral water and energy consumption under each end-use category from the perspective of production and consumption in East Asia to provide a policy reference for addressing energy and water issues at the national and sectoral levels.
2. Methodology
2.1 EE-MRIO Model
The environmentally extended multi-regional input-output (EE-MRIO) model can analyze multiple environmental impacts driven by production or consumption and describe the input-output relationship between sectors and regions in a specific area or multiple sectors in different areas (Boulay, Hoekstra, & Vionnet, 2013; Meng et al., 2018; Zhao & Chen, 2014). For a multi-input-output table with m regions and n sectors, there is a value balance that can be expressed as a matrix on the equation relationship:
1
\(X = AX + Y\)where \(X\) is the total output of all regions with \(mn \times 1\) dimension, \(A\) is a complete matrix composed of the direct input coefficient matrix of each region with \(mn \times mn\) dimension, \(Y\) represents the final demand matrix with \(mn \times 1\) dimension, each element \(y^{rs}\) is a \(n \times 1\) vector, which can be further divided into household consumption \(y_{household}^{rs}\), government consumption \(y_{government}^{rs}\), and investment \(y_{investment}^{rs}\) in the framework of the GTAP10 database, representing the three types of final demand from region r to region s.
Equation 1 can be further rearranged as:
2
\(X=(I-A)^{-1}Y=LY\)\(I\) is an identity matrix with \(mn \times mn\) dimension, \(L\) is an inverse matrix of Leontief with \(mn \times mn\) dimension.
2.2 Selection of relevant sectors
To measure the environmental impact at the sectoral level, specific sectoral scopes need to be further defined. Due to research needs, we aggregated the 65 sectors in GTAP10 into 45 sectors based on sector similarity. Briefly, we have made certain modifications to the original codes in the GTAP10 database, and the corresponding sector code and sector description are shown in Table 1. The research scope of this study is the independent 45 sectors in new sector numbers and codes.
|
New No. |
New code |
GTAP No. |
GTAP code |
Sector description |
|
19 |
OtherMing |
13 |
frs |
Forestry |
|
14 |
fsh |
Fishing |
||
|
18 |
oxt |
Minerals nec |
||
|
25 |
TexWapp |
27 |
tex |
Textiles |
|
28 |
wap |
Wearing apparel |
||
|
30 |
OtherLightMnfc |
43 |
mvh |
Motor vehicles and parts |
|
44 |
otn |
Transport equipment nec |
||
|
45 |
omf |
Manufactures nec |
||
|
36 |
OtherHeavyMnfc |
34 |
bph |
Basic pharmaceutical products |
|
36 |
nmm |
Mineral products nec |
||
|
40 |
ele |
Computer, electronic and optic |
||
|
41 |
eeq |
Electrical equipment |
||
|
42 |
ome |
Machinery and equipment nec |
||
|
45 |
Other Service |
50 |
trd |
Trade |
|
55 |
whs |
Warehousing and support activity |
||
|
56 |
cmn |
Communication |
||
|
57 |
ofi |
Financial services nec |
||
|
58 |
ins |
Insurance |
||
|
59 |
rsa |
Real estate activities |
||
|
60 |
obs |
Business services nec |
||
|
61 |
ros |
Recreational and other services |
||
|
62 |
osg |
Public Administration |
||
|
63 |
edu |
Education |
||
|
64 |
hht |
Human health and social work |
||
|
65 |
dwe |
Dwellings |
2.3 Data source and processing
The available GTAP database is balanced and has enough information to construct a multiregional input-output table. Therefore, we have combined various data to form various sub-matrices of the multiregional input-output table for 2014 by referring to Peters, Andrew, and Lennox (2011). The process was as follows: first, we used the GTAPAgg2 program, which is used to aggregate GTAP sectors, to aggregate the original 65 GTAP sectors to the 45 sectors needed for the study; then, we extracted the relevant data with the help of the ViewHAR program (a GTAP database visualization software) and Excel; finally, we distributed and adjusted the import data and the domestic data for intermediate use and final consumption, obtaining a multi-regional input-output table of 141×45. In addition, since bilateral trade data from region r to region s only provide information on export product sector \(i\) and not on consumption sector \(j\), as described in Peters et al. (2011), we allocated bilateral exports (in the prices of the producing country) proportionally to the intermediate use sector and final consumption according to the import structure of the importing region (in prices of the consuming country), which ensures output balance while constructing the non-diagonal matrix \(Z^{rs}\) and \(y^{rs}\).
3
\(Z^{rs}_{ij} = \frac{(Z^m)^s_ij }{vim^s_j}e^{rs}_i\)4
\(y^{rs}_{ij} = \frac{(y^m)^s_ij }{vim^s_j}e^{rs}_i\)\(Z^{rs}_{ij}\) represents the input from sector \(i\) in region \(r\) to sector \(j\) in region \(s\), \(y^{rs}_{i}\) represents the final consumption of region \(s\) for the products of sector \(i\) in region \(r\), \(vim^{s}_{i}\) represents total import of \(i\) into region \(s\), \(e^{rs}_{i}\) represents export of \(i\) from region \(r\) to region \(s\), \((Z^m)^{s}_{ij}\)represents the use of products in sector \(i\) by sector \(j\) in region \(s\), \((y^m)^{s}_{i}\) represents the final consumption of products in sector \(i\) by region \(s\).
The energy consumption of each sector in the 141 countries and regions is taken from the corresponding GTAP10 database account. Since the GTAP database does not contain sector-level freshwater withdrawals for 2014, we extrapolated global sector-level withdrawals through multiple calculation methods. Based on the definition of water use (National Bureau of Statistics [NBS], 2015), we divided water withdrawals into three categories (i.e., agricultural, industrial, and residential withdrawals). The freshwater withdrawals data and the proportions of the three types of withdrawals were obtained from the World Development Indicators (WDI) database (World Bank, 2021) . The three types of freshwater withdrawals were assigned to 45 sectors. The proportions of water use in the agricultural subsector by country in 2014 were obtained based on freshwater withdrawals in the agricultural subsector from the 2011 GTAP water accounts. Assuming that the relative water withdrawal intensity between the industrial subsectors is constant for each country and does not significantly vary across the different regions, the ratios of industrial subsectors were used to allocate the total industrial amount into subsectors and obtained from Fan, Wang, Zhang, Kong, and Song (2019). The distribution of water withdrawal in the service sector is similar to the industrial sector, while ecological water withdrawal was not considered in this study. For the regions with missing data in total water withdrawal or industrial distribution, sectoral water intensity was replaced by the global average water intensity at the sectoral level.
3. Results and Discussion
3.1 The overview of energy and water footprint of East Asian countries
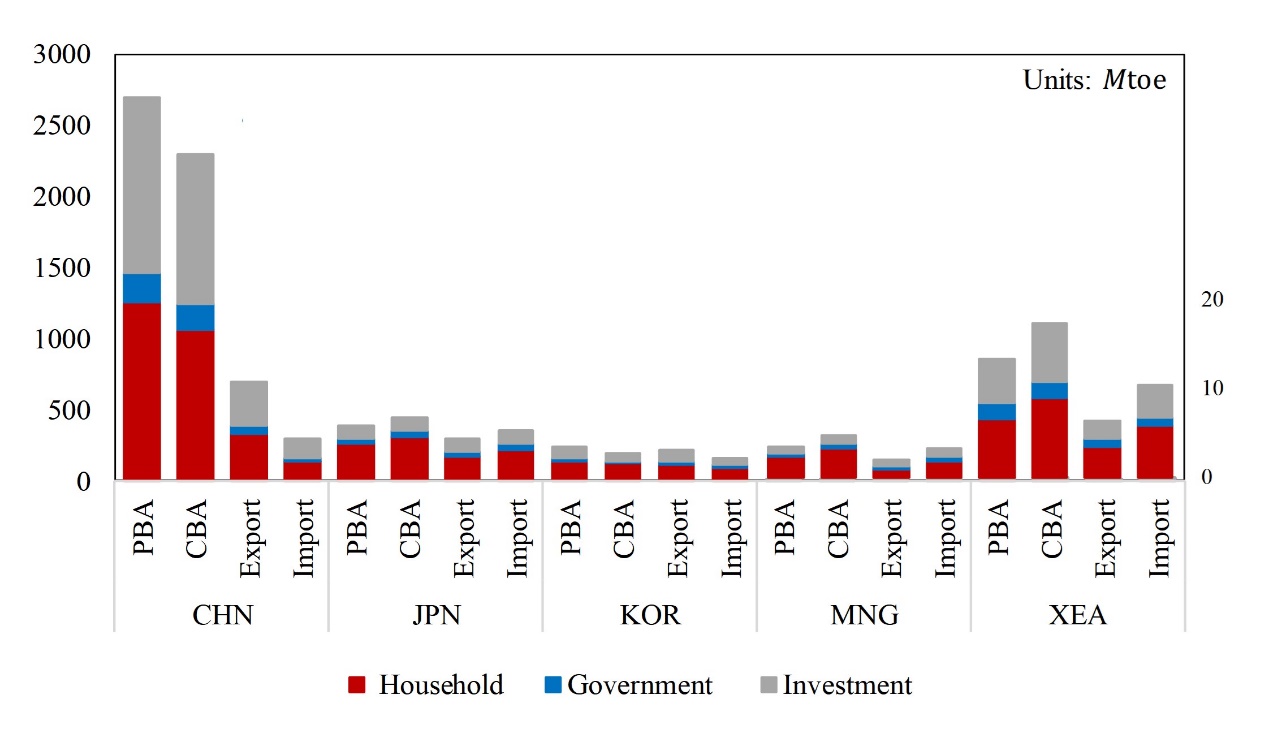
The total global energy use embodied in the products of production (consumption) and exports (imports) in 2014 were 9,649 and 7,573 Mtoe, respectively. There is a significant difference between the embodied use of energy for production-based accounting (PBA) and consumption-based accounting (CBA) in East Asian countries (Figure 1). CBA embodied energy use is greater than PBA embodied energy use in Japan, Mongolia, and other East Asian countries or regions. And, PBA embodied energy use is only 51 Mtoe higher than CBA embodied energy use in South Korea. In contrast, China’s PBA embodied energy use (2,687 Mtoe) is significantly higher than its CBA embodied energy use (2,295 Mtoe), suggesting that China has undertaken many embodied energy exports to meet the final demands in the rest of the world. At the same time, closely related to the large population, China’s production-side and consumption-side embodied energy use both have a large global share, accounting for 28% and 24%, respectively. In addition, China’s embodied energy of exports and imports account for only 13% and 26% of the total on the consumption and production sides, indicating that most of the energy supply is self-sufficient in China’s domestic market, while the proportions of energy imports and exports in embodied energy use for the rest East Asian countries are all at a high level.
In terms of the different end-use categories, in East Asia, household consumption is dominant in the end-use of embodied energy for all countries except China. Specifically, the share of household consumption in Japan, South Korea, Mongolia, and other East Asian countries is above 60%, while the share of household consumption in China is 45%. In addition, energy use is driven by investment consumption and accounts for a relatively large proportion of the energy use structure of various countries, whereas the embodied energy use on the production side has similar results.
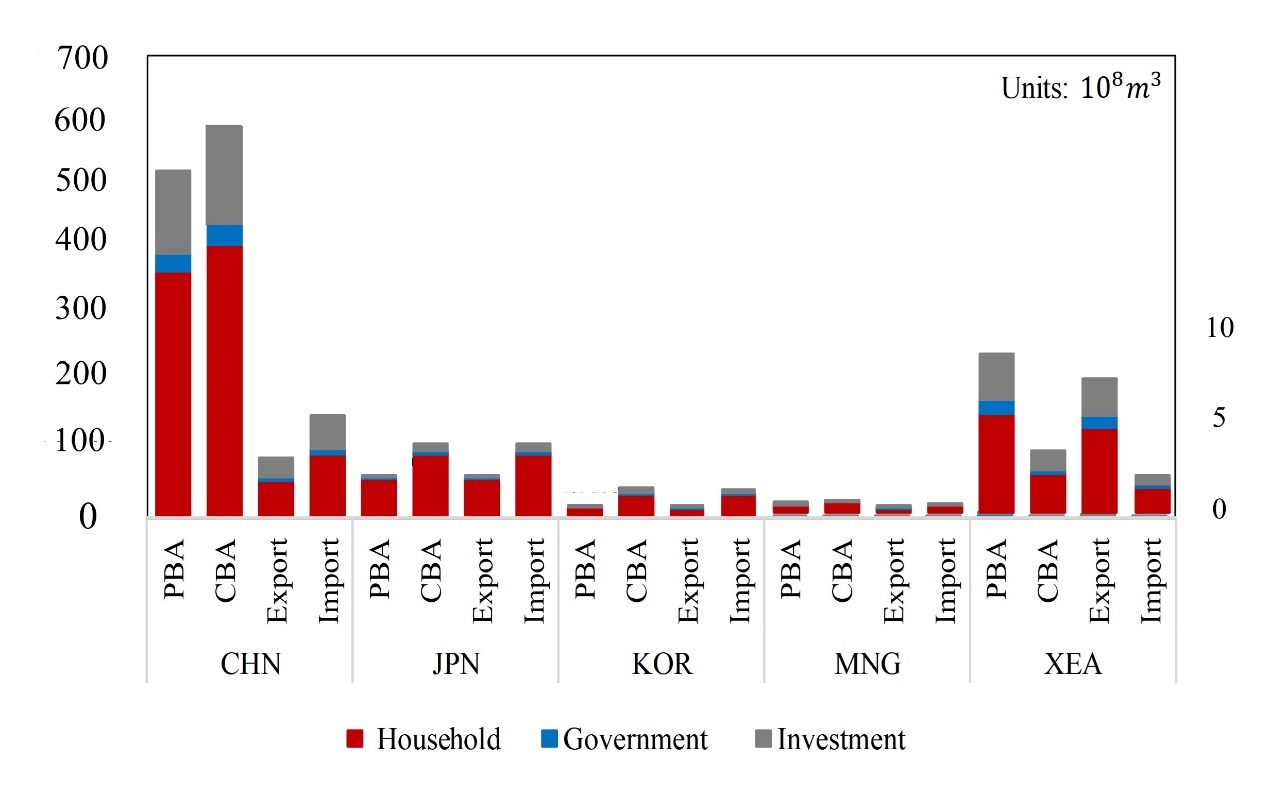
In 2014, the global total water use for production (consumption) and export (import) reached 398 billion m3 and 332 billion m3, respectively. The embodied water of CBA/imports is greater than PBA/exports for all countries except for other regions in East Asia where there is less embodied water, indicating that East Asia is a net importer of embodied water in global trade relations (Figure 2). China’s PBA embodied water and CBA embodied water are large, accounting for over 10% of the world total, with 52,671 and 59,181 million m3 of water used on the production and consumption side. Japan and South Korea have a relatively small world share of PBA and CBA embodied water, with CBA embodied water higher than PBA embodied water. Similar to energy use, imports and exports are still the main reason for embodied water use on the consumption and production side in all countries except China, where exports and imports account for only 26% and 17% of the consumption and production side.
The embodied water driven by household consumption in East Asia accounts for a large proportion of all embodied water. The proportion of embodied water use of residents in five countries or regions is more than 60%. Among them, the embodied water use of residents in Japan and Mongolia accounts for more than 80%, and the total amount is 98.13Gm3 and 0.52Gm3, respectively. China has a relatively low water use share of 70% for household consumption, but due to its extremely large population, its total household water use is higher at 69.49 Gm3.
3.2 The sector structure of embodied energy and embodied water in East Asia
There is significant heterogeneity in embodied energy use driven by household consumption among different sectors in both the production and consumption sides in East Asia (Figure 3). In terms of embodied energy use on the production side, industry sectors, like the electricity, petroleum and coal products sectors, are the main energy-using sectors in East Asian countries. In South Korea and Japan, PBA energy use in both sectors are over 90%, while PBA energy use in the electricity sector of Mongolia accounts for 88% of the total production-side embodied energy use. In terms of CBA embodied energy use on the consumption side. At the same time, industry sectors, dominated by the petroleum and coal products sectors are still the main sectors consuming energy in each country in East Asia. The services sectors have increased significantly in terms of their share in end-use energy, becoming the most energy-intensive sectors in East Asian countries in addition to the industry sectors. The share of embodied energy use in the service sectors of the total in South Korea, Japan, and Mongolia is 44%, 41%, and 28%, respectively.
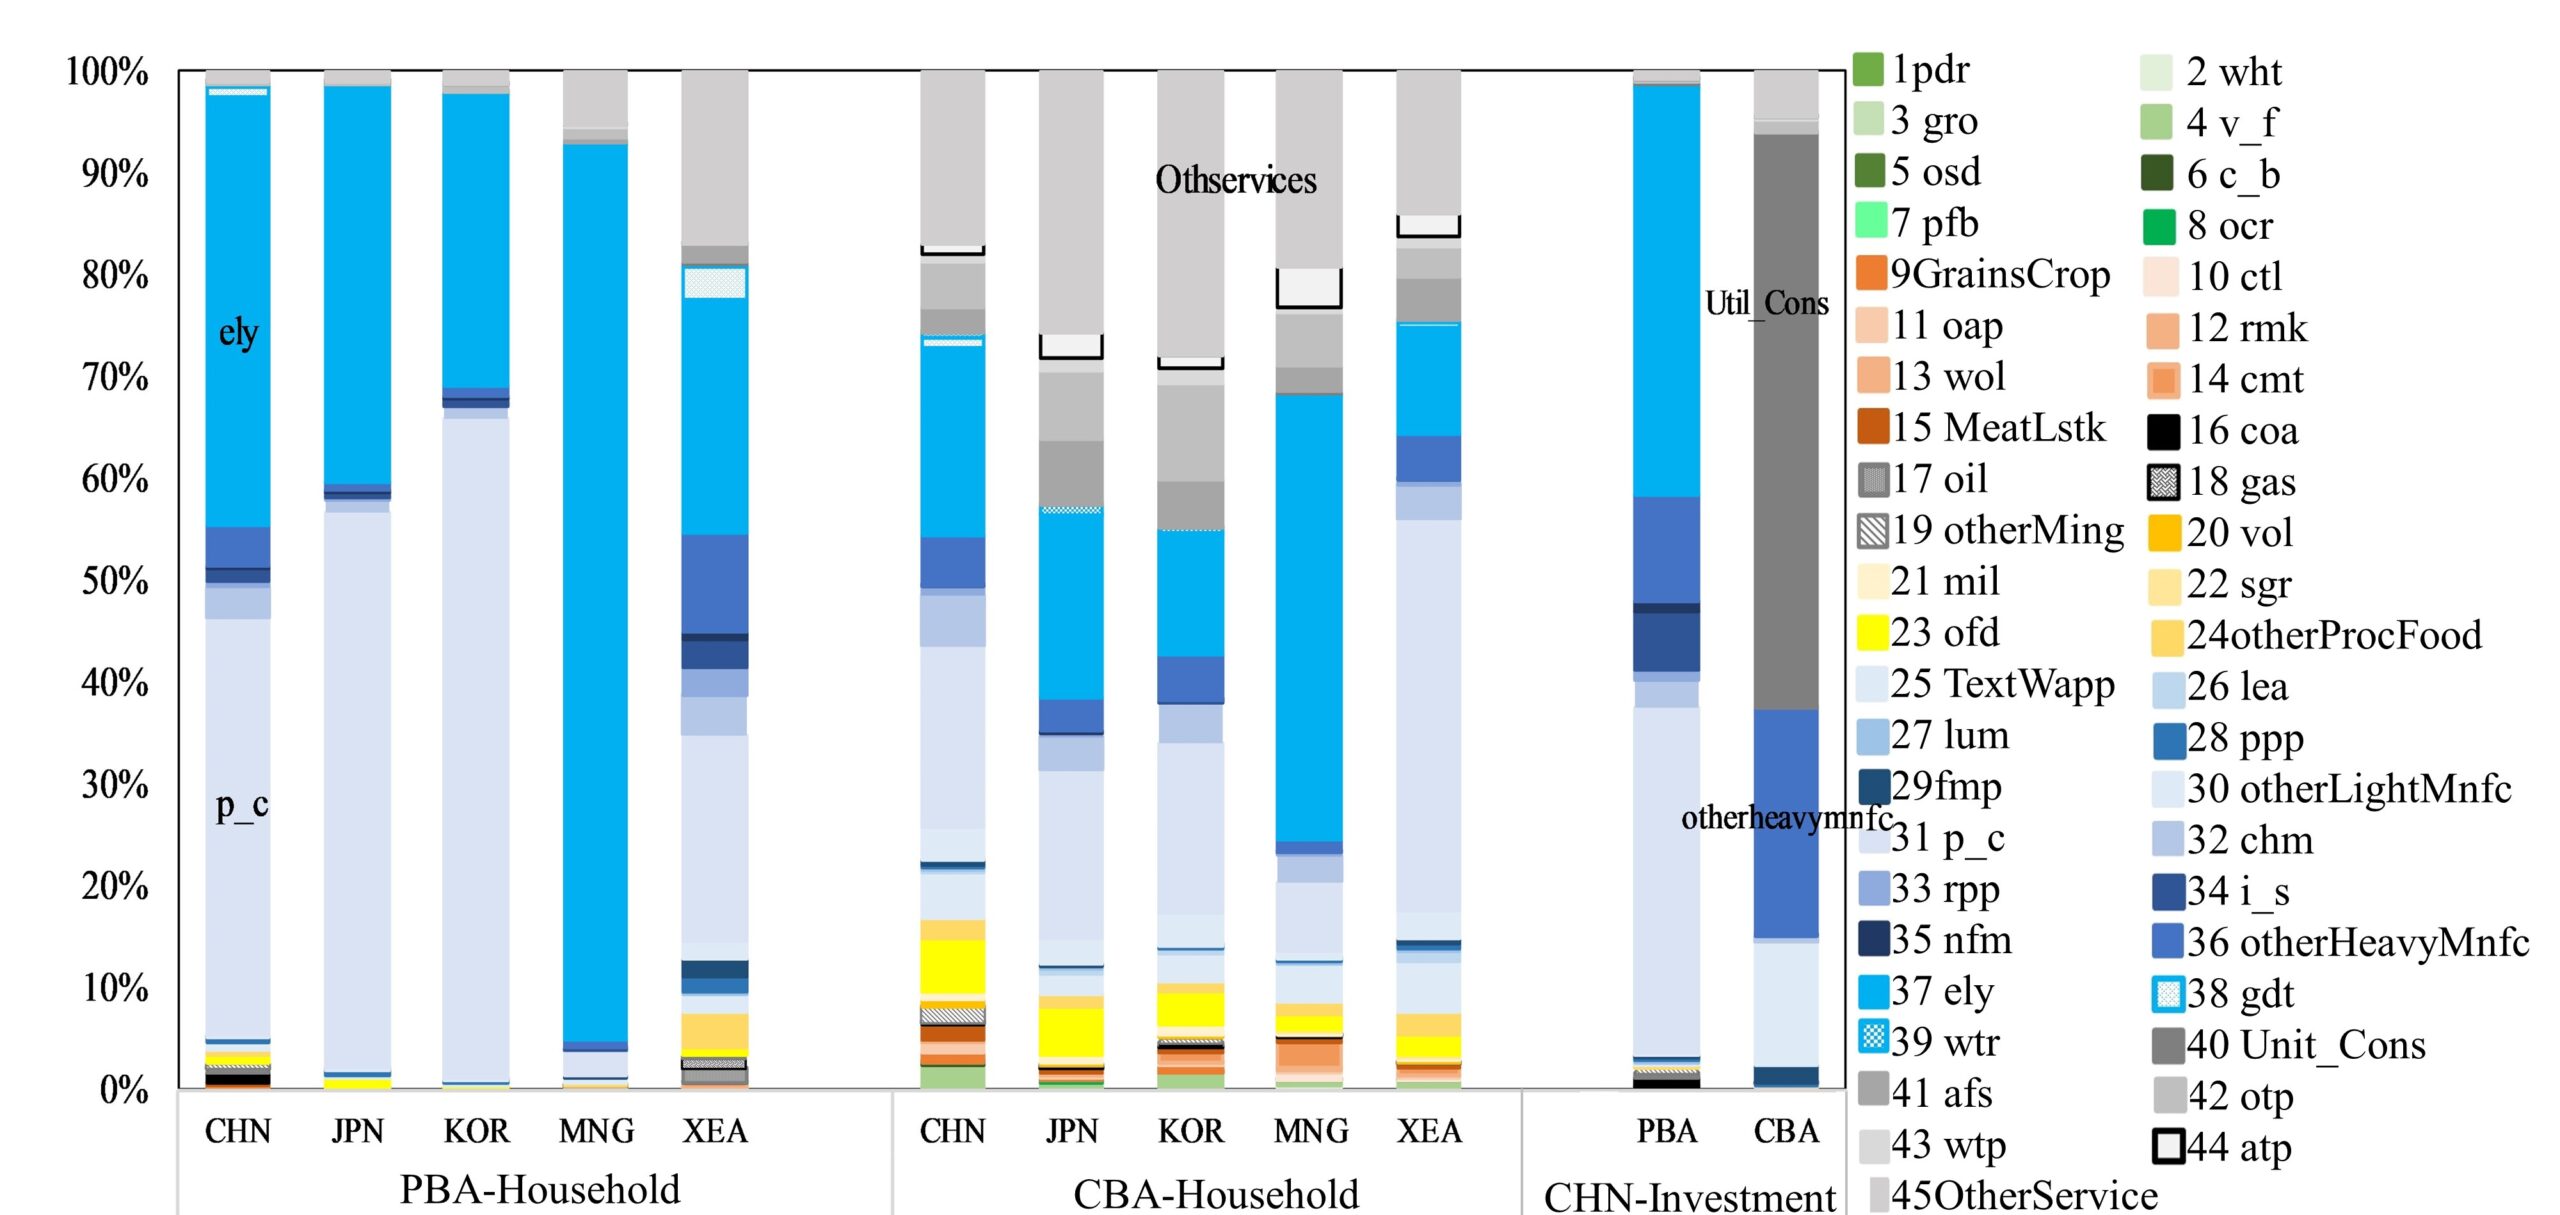
Since embodied energy use driven by investment consumption in China is another important energy use component, it was further analyzed. The results show that the findings of the PBA and CBA embodied energy use driven by household consumption in China are similar to those of other East Asian countries, with the electricity sector and the petroleum and coal products sector accounting for 83% of the total in the PBA perspective, and the services sectors accounting for 26 % in the CBA perspective. An analysis of investment consumption shows that the electricity sector and the petroleum and coal products sector are the main end-use sectors in the PBA perspective, with a combined share of 74% of the total. However, in the CBA perspective, the construction sector and heavy manufacturing sector are the main energy-use sectors, with a share of 56% and 23%, respectively, indicating that these sectors not only attract a large amount of fixed capital inflows but also drive a large amount of energy use.
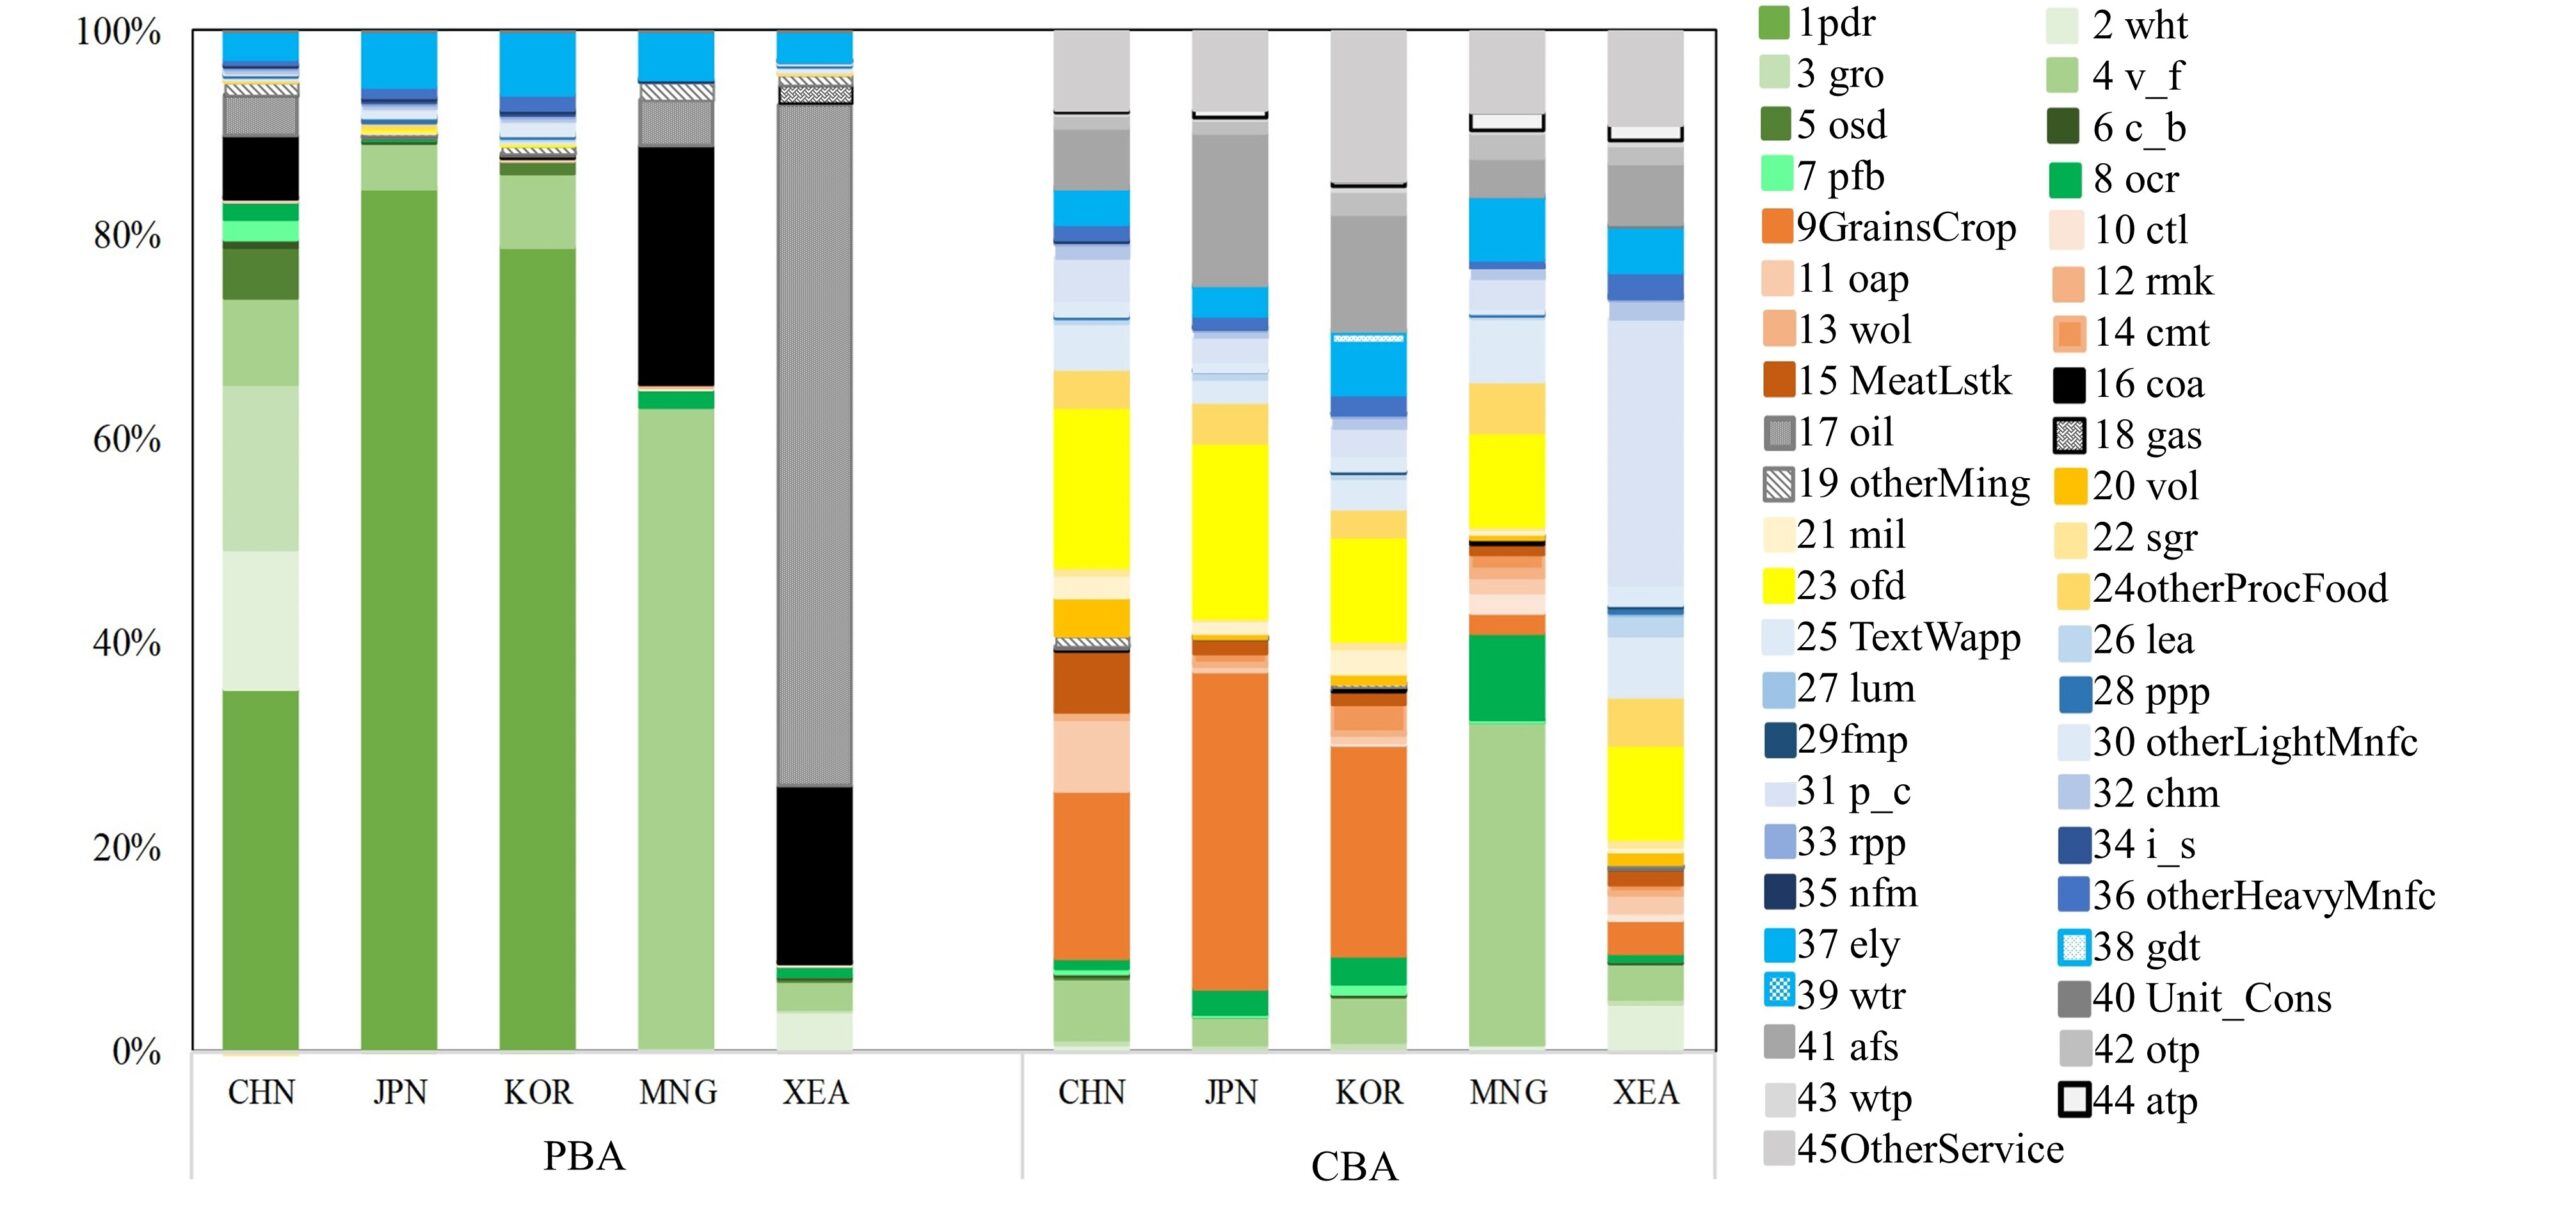
Figure 4 illustrates the sectoral structure of embodied water use driven by household consumption in East Asian countries. The agriculture and processed foods sectors are the most important water-use sectors on the production and consumption side. The sectoral distribution of embodied water use in East Asia from the CBA perspective shows diversity and complexity compared to those from the PBA perspective. On the production side, the agricultural sectors, especially the paddy rice sector, are the key water-use sector in the major East Asian countries, except for the rest of East Asia, which is associated with high irrigation water demand for cultivation. For example, the agricultural sector embodied water accounts for 89.4% of Japan’s total water. In comparison, the paddy rice sector alone accounts for 84.1% of the total water footprint. The share of agricultural sectors’ water use in South Korea and China is 89% and 83%, respectively, with the paddy rice sector embodied water accounting for 78% and 35% of the total, respectively. Mongolia’s share of embodied water in agriculture sectors is 65%, and unlike the other countries, the vegetable, fruit and nut sector accounts for the largest share of embodied water at 63%. Moreover, there is significant heterogeneity in the sectoral distribution of embodied water use between the consumption and production sides. Specifically, processed foods, industry, and services sectors are key water-use sectors in most countries. The share of embodied water in processed food sectors is over 40% in China, Japan, and South Korea, and the proportion of the processed foods sectors’ embodied water accounts for nearly 60% of the total in China and Japan. The processed rice sector in the processed foods sector is also the main contributor to the total amount of embodied water, accounting for 31% and 21% of total embodied water in Japan and South Korea. The share of embodied water in the industry sectors and service sectors ranges from 10% to 20% in China, Japan and South Korea. Related to its dietary preferences, the sectoral structure of Mongolia’s embodied water differs significantly from that of China, Japan, and South Korea, mainly in its higher water use of primary agricultural products on the consumption side.
4. Conclusion
Based on the constructed 2014 Environmentally Expanded Global Multi-Regional Input-Output Table, we quantitatively assessed and analyzed the heterogeneity of energy consumption and water withdrawals driven by different categories of end-use in the major countries of the East Asian region, with the following main findings:
East Asia is one of the major regions of embodied energy use in the world, with the total embodied energy of production and consumption side of China, Japan, and South Korea accounting for 33% of the total (99.50% and 99.25% of the total energy use in East Asia respectively). China has the largest energy use on the production and consumption side, which is related to its large population. China and South Korea are net exporters of embodied energy; Japan, Mongolia, and the rest of East Asia are net importers. Moreover, imports and exports are the main sources for embodied energy use in the rest of East Asia except China. In contrast, China’s energy use embodied in the trade accounts for a relatively low proportion of the total on the consumption side (13%) and production side (26%). Except for China, where the share of embodied energy driven by household and investment consumption is large, household consumption is the most important final demand for embodied energy in other East Asian countries. The industry sectors are the main household consumption of energy in East Asian countries, dominated by the electricity sector and petroleum and coal products sector, with Mongolia accounting for 88% of its energy use in the electricity sector alone. The proportion of embodied energy use in the service sectors on the consumption side increases, but the industry sectors are still the main sectors causing energy use on the consumption side in all countries. In addition, from the perspective of energy use driven by investment consumption in China, the electricity sector and petroleum and coal products sector require a large amount of energy input on the production side, while the construction sector and other heavy manufacturing pull in a large amount downstream energy use.
Water use in East Asia is still dominated by China, Japan, and South Korea, with the total production and consumption side water consumption of these three countries reaching 98.6% and 99.5% of the total in East Asia, respectively. China is the leading consumer of water in East Asia, with a total of 53 and 59 billion cubic meters of water used on the production and the consumption side, respectively. China, Japan, South Korea, and Mongolia are all net importers of embodied water. Except for China and the rest of East Asia, imports and exports are the main reason for embodied water use on the consumption and production side in all other countries. China’s imports and exports are only 26% and 17% of the consumption and production side, respectively, indicating that China uses more water in its domestic production and consumption processes than other East Asian regions. Household consumption is still the most important final use for embodied water in all countries. The agricultural sectors are the dominant sectors of embodied water use by residents in this region. The paddy rice sector is the sector that uses the most water in China, Japan, and South Korea due to irrigation needs. On the consumption side, the main sectors of water use by residents in the region are more complex than the production side, with the processed foods sector being the main sector of water use in China, Japan and South Korea. Embodied water use is significantly higher in the industry and service sectors than in the production side. On the other hand, Mongolia consumes the largest amount of embodied water for primary agricultural products (41%), followed by processed foods sectors, industry sectors and services sectors.
Based on the above findings, the following policy insights have been gained. Firstly, household consumption has become an important part of end-use consumption within East Asian countries. Sustainable consumption contributes to the achievement of several national-level Sustainable Development Goals (SDGs) (SDG 6 Clean water and sanitation, SDG 7 Ensure access to affordable, reliable, sustainable and modern energy for all, SDG 12 Responsible consumption and production, SDG 14 Life below water). However, as technology accelerates and incomes increase, people are more inclined to buy energy-intensive products (Tian, Wu, Geng, Bleischwitz, & Chen, 2017) and product waste, especially food products, is high (Vanham, Bouraoui, Leip, Grizzetti, & Bidoglio, 2015), which leads to an increased energy and water footprint. Therefore, there is a need to promote sustainable consumption in the East Asian region by raising public awareness of energy and water conservation through the use of various means of advocacy such as advertising in the media, publishing environmental pamphlets, and holding lectures on environmental topics. Secondly, sustainable resource management is essential for the development of the East Asian region. To begin with, there is a need to establish a dynamically updated international resource database at the sectoral level, distinguishing national use from international use, to monitor resource use embedded in domestic consumption and trade. Next, as East Asia’s key energy and water consuming sectors are similar, technical cooperation and technology sharing can be enhanced to jointly promote sustainable development goals. Thirdly, economic instruments such as resource use taxes can be used to improve resource use efficiency, reduce resource use in net importing countries such as Japan and South Korea, and assist in technology development and environmental management in net exporting countries (e.g. China’s energy use).
Acknowledgement
This work was supported by the Asia-Pacific Network for Global Change Research (grant number CBA2018-02MY-Fan, https://doi.org/10.30852/p.4600), and the NSFC Projects of International Cooperation and Exchanges (grant number 52061125101).