
Comparing effects of untreated and treated wastewater on riverine greenhouse gas emissions
Keywords
Biodegradation · CO2 · Dissolved organic carbon · Wastewater
Highlights
- Untreated sewage greatly contributes to riverine DOM biodegradation and CO2 emission
- Labile DOM in sewage enhances DOM biodegradation and CO2 emission in downstream rivers
- Untreated sewage has stronger effects on downstream C dynamics than treated wastewater
1. Introduction
The input of organic matter (OM) from land to water leads most rivers in the world to be supersaturated with dissolved greenhouse gases (GHGs) (Ward et al., 2017). Recent global syntheses have emphasized the role of inland waters as major sources of CO2, CH4, and N2O to the atmosphere (Bastviken, Tranvik, Downing, Crill, & Enrich-Prast, 2011; Raymond et al., 2013). Climate change and increasing anthropogenic activities have been suggested as key factors affecting riverine biogeochemistry (Evans, Monteith, & Cooper, 2005; Regnier et al., 2013). Urban rivers have been identified as hotspots for riverine GHG emissions, where increased loads of nutrients and OM can enhance riverine metabolic processes such as aerobic and anaerobic biodegradation, nitrification, and denitrification (Yoon, Jin, Begum, Kang, & Park, 2017; Jin et al., 2018). Recent studies have reported that concentrations of dissolved organic carbon (DOC) and dissolved nutrients increase substantially downstream of large metropolitan cities with treated and untreated wastewater discharged to the river (Sickman, Zanoli, & Mann, 2007; Hosen, McDonough, Febria, & Palmer, 2014). Enhanced bioavailability of nutrients and labile OM derived from wastewater, especially after mixing with the mainstem river, has been associated with increased emissions of GHGs from downstream rivers (Begum et al., 2019).
According to the IPCC report (2007), waste and wastewater account for 2.8% of the total GHG emissions to the atmosphere. Anthropogenic GHG emissions have increased during the last couple of decades with increasing urbanization and industrialization in many parts of Asia. Organic pollution has been rising across Asia resulting in various environmental problems in polluted river reaches, such as eutrophication and hypoxia (Wang et al., 2017; Park et al., 2018). Advanced wastewater treatments used in developed countries can efficiently remove biodegradable OM and inorganic nutrients, resulting in low levels of water pollution in downstream rivers, as observed in the Han River, Korea (Ministry of Environment, 2019). In developing countries, however, untreated wastewater from domestic and industrial sources is directly discharged to downstream rivers resulting in high levels of OM and nutrients in river reaches downstream of large metropolitan areas (Misra, 2010; Bhatt, McDowell, Gardner, & Hartmann, 2014). For example, the Yamuna River traversing the Delhi metropolitan area was declared “dead” with dissolved oxygen level close to zero even in the monsoon season (Misra, 2010). Although it has recently been reported that organic pollution in urbanized rivers receiving treated wastewater effluents can create conditions for high emission rates of dissolved CO2 and other GHGs (Alshboul, Encinas-Fernandez, Hofmann, & Lorke, 2016; Yoon et al., 2017), the influence of untreated sewage on riverine metabolic processes has rarely been compared with the influence of treated wastewater. Given the high lability of DOM contained in urban sewage (Guo et al., 2014), the mixing of sewage-derived DOM might greatly enhance the biodegradation of riverine DOM, altering rates of GHG emissions. Therefore, the objective of this study was (1) to compare the characteristics of DOM and CO2 from a treated wastewater effluent from Korea with untreated wastewater from a sewage drain in Phnom Penh, Cambodia; and (2) to investigate how the mixing of wastewater with river water affects the rates of DOM biodegradation and CO2 emission.
2. Methodology
2.1 Sampling and incubation
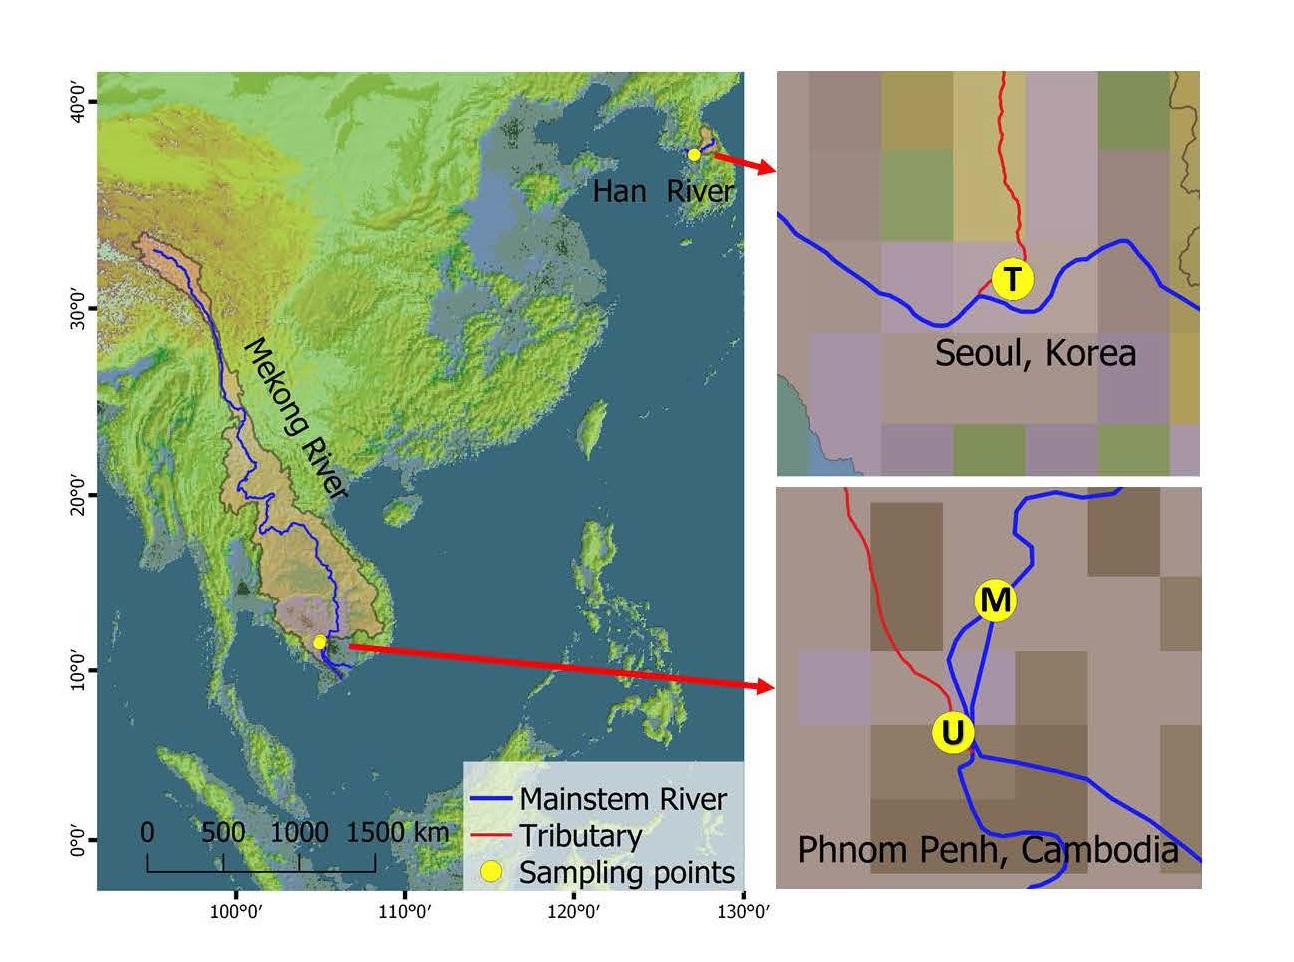
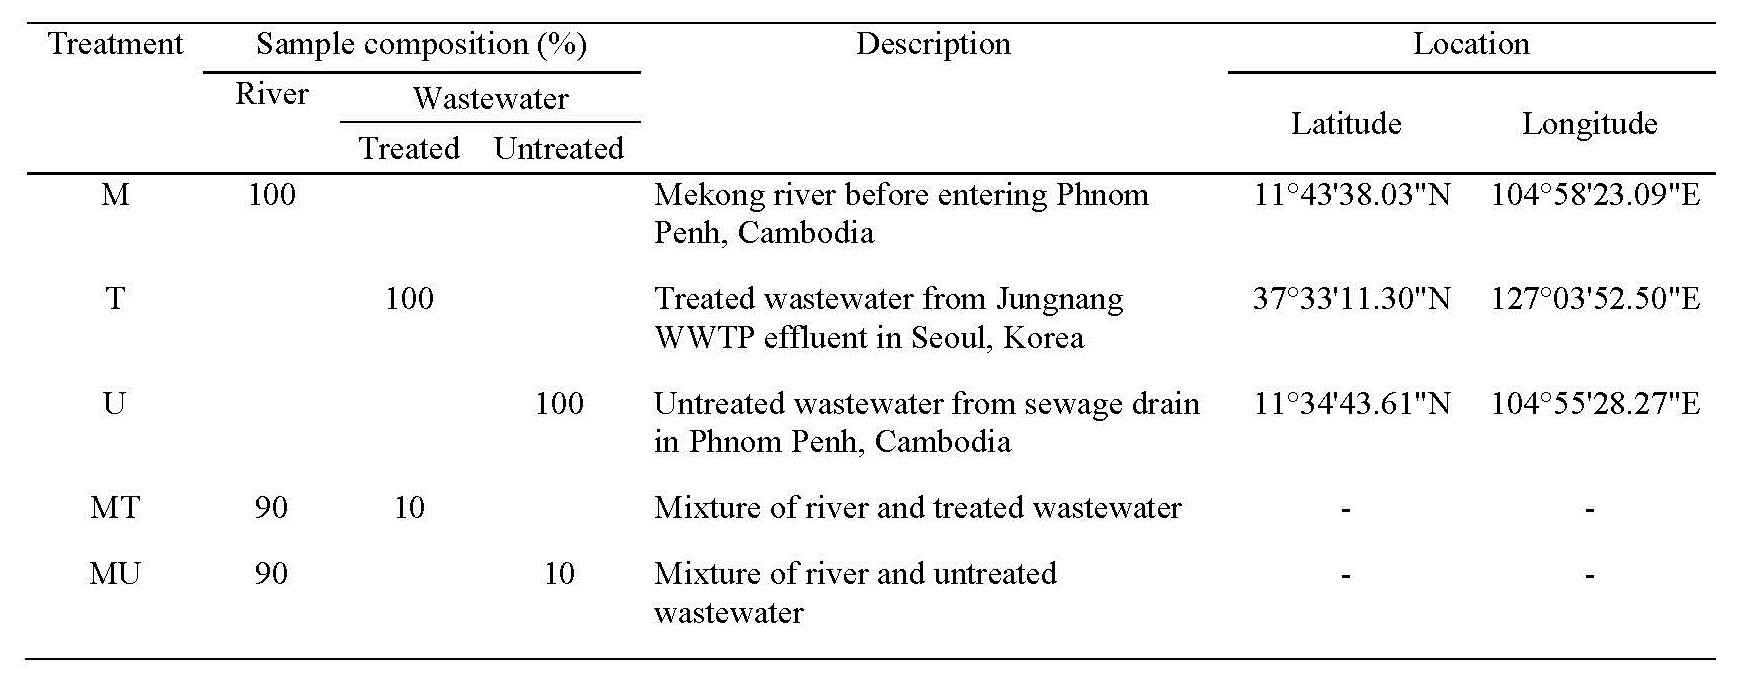
In order to compare the effect of treated and untreated wastewater on riverine GHGs, samples were collected from a treated wastewater (termed as “T”) discharge from a wastewater treatment plant (WWTP) in Seoul, Republic of Korea, and untreated wastewater (termed as “U”) from a sewage drain in Phnom Penh, Cambodia in September 2016 and January 2017, respectively (Figure 1). An additional sample was collected from a mainstem location of the Mekong River, upstream of Phnom Penh city (termed as “M”) as the control sample. Samples were transported on ice to the laboratory and frozen overnight until the incubation experiment. River water (M sample) and wastewater (T and U samples) were mixed at a ratio of 9:1 (v/v) to produce two mixture samples termed “MT” and “MU”, respectively, before conducting the incubation experiment.
Samples were filtered through a 0.2 µm polycarbonate filter (Whatman, USA) and a three-day incubation was conducted in the laboratory, following the methods modified from Servais, Billen, and Hascoët (1987) and Begum et al. (2019). Three replicates of filtered samples (60 mL) were incubated in 120 mL glass bottles, sealed with butyl septa and aluminium crimps to measure the change in dissolved CO2 in addition to measuring biodegradable dissolved organic carbon (BDOC). A small volume (1% v/v) of the unfiltered raw M sample was added to each treatment as inoculum to provide the filtered water samples with a common microbial community for biodegradation. The incubation temperature was set to 29 °C to simulate the usual field condition of the Mekong River during sample collection. The concentration of BDOC was calculated as the net change in DOC concentration over the three-day incubation, and %BDOC was calculated as relative proportion in the initial DOC concentration. Dissolved gas samples were collected from each bottle at the beginning and end of the incubation, using manual headspace equilibration method (Begum et al., 2019). CO2 production from biodegradation was calculated as the net change in dissolved CO2 during the incubation.
2.2 Sample analysis
In situ measurement of hydroclimatic parameters such as water temperature, barometric pressure, and ambient temperature was recorded during sample collection. Filtered water samples were analyzed for DOC concentration, fluorescence excitation-emission matrices (EEMs), and UV absorbance. As part of quality control of all the analyses, standards with known concentrations and ultrapure water were analyzed for every batch of ten samples. DOC concentration was measured by a total organic carbon analyzer based on high-temperature combustion of OM followed by thermal detection of CO2 (TOC-VCPH, Shimadzu, Japan). UV absorbance was measured across a wavelength range from 200 to 1100 nm using a UV-Vis spectrophotometer (8453, Agilent, USA). Fluorescence EEMs were collected on a fluorescence spectrophotometer (F7000, Hitachi, Japan) by simultaneous scanning over excitation wavelengths from 200 to 400 nm at 5 nm interval and emission wavelengths from 290 to 540 nm at 1 nm interval. Scan speed was 2400 nm min–1, and the bandwidth was set to 5 nm for both excitation and emission. Corrected fluorescence data were used to calculate humification index (HIX) (Zsolnay, Baigar, Jimenez, Steinweg, & Saccomandi, 1999), fluorescence index (FI) (McKnight et al., 2001) and biological index (BIX) (Huguet et al., 2009).
The equilibrated headspace air sample, as well as a sample from the ambient air used for equilibration, was injected into a gas chromatograph (GC) (7890A, Agilent, USA) equipped with a flame ionization detector (FID) for analysis of CO2. Details of methods of GC analysis are described in our previous publication (Jin et al., 2018). In brief, high-purity N2 gas (99.999%) was used as carrier gas at a constant flow rate of 25 mL min–1. The flow rate of the reference gas (N2) was 5 mL min–1, and temperature settings include the inlet at 250, the oven at 60, the valve box at 100, and FID at 250 °C. The volume of the sample loop was 1 mL. Standard reference gases with various concentration of CO2 in N2 balance (RIGAS Corporation, Korea) were used to calibrate the GC signals.
2.3 Statistical analysis
Significant differences in measurements among the treatments were compared by one-way analysis of variance (one-way ANOVA) for data exhibiting normal distribution or non-parametric Kruskal-Wallis one-way analysis of variance on ranks (one-way ANOVA on ranks) in the case of non-normal distribution. ANOVA tests were followed by Student-Newman-Keuls test to identify treatment means that are significantly different from each other. Significant differences between the initial and final measurements were examined by Student’s t-test with datasets that exhibited normal distribution. All the statistical analyses were conducted using SigmaPlot (version 12.5, Systat Software, USA) with a significance level at P < 0.05.
3. Results and discussion
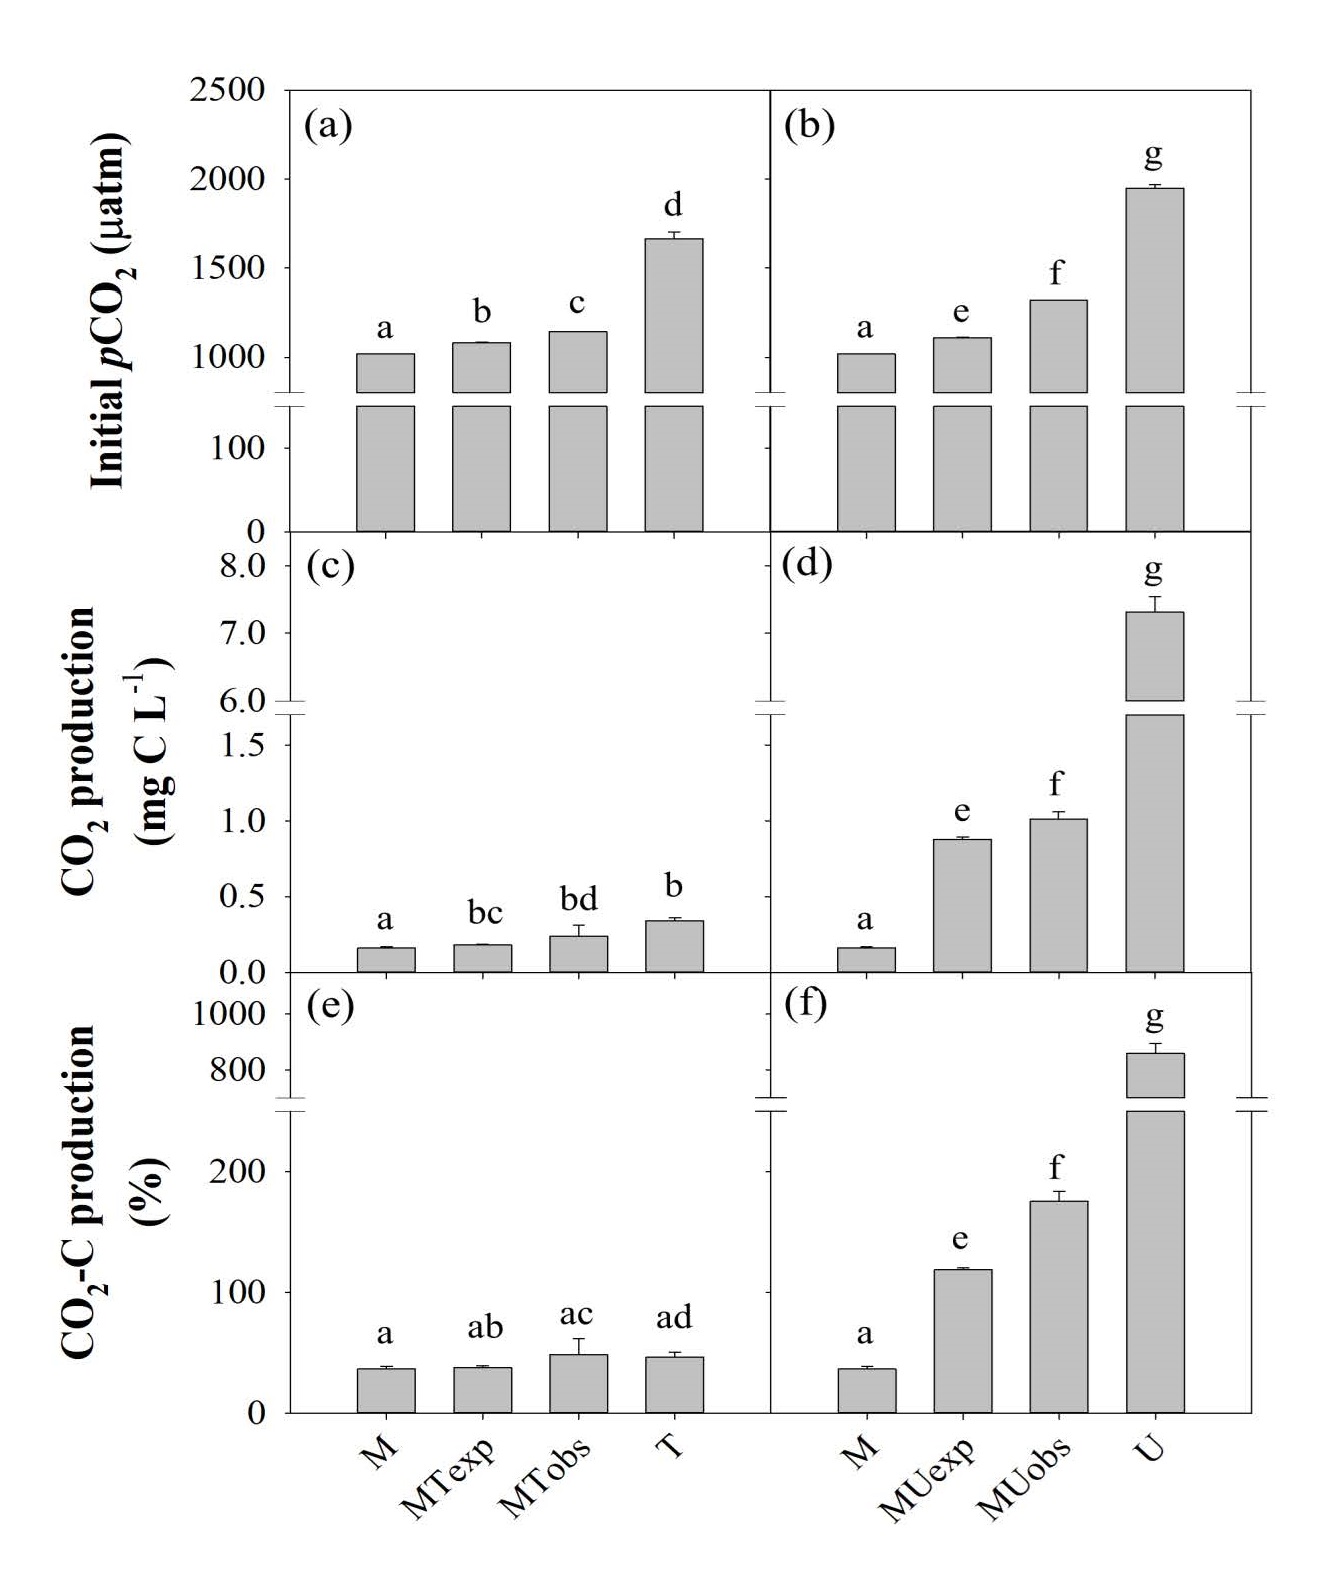
The average DOC concentrations of the T (4.74 mg L-1) and U (40.44 mg L-1) samples were 4 and 35 times higher than the M (1.16 mg L-1) sample, respectively, and the differences were significant (ANOVA on ranks, P < 0.05) (Figure 2a,b; Table 2). All three samples were supersaturated with dissolved CO2 when measured in situ, with highest values found at U site (18131 µatm). These differences in DOC and dissolved CO2 suggest a large difference in the composition and lability of OM in treated and untreated wastewater. BDOC measured during the three-day incubation was slightly higher in the T samples (on average 0.11 mg L-1; 2.2%) compared to the M samples (0.01 mg L-1; 1.3%); however, BDOC in the U samples was very high in absolute concentration (27.85 mg L-1) and its relative proportion in the initial DOC concentration (68.9%), 31 times higher than the T sample (ANOVA on ranks, P < 0.05) (Figure 2c-f; Table 2). This large amount of labile DOM contained in the untreated wastewater discharged from the city centre of Phnom Penh might be partially responsible for large GHG evasion from the downstream Mekong River. The magnitude of BDOC and CO2 concentrations measured for the untreated wastewater from Phnom Penh has rarely been observed in river systems receiving treated wastewater such as the Han River, Korea (Yoon et al, 2017; Begum et al., 2019) and rivers in North America (Sickman et al., 2007; Hosen et al., 2014).
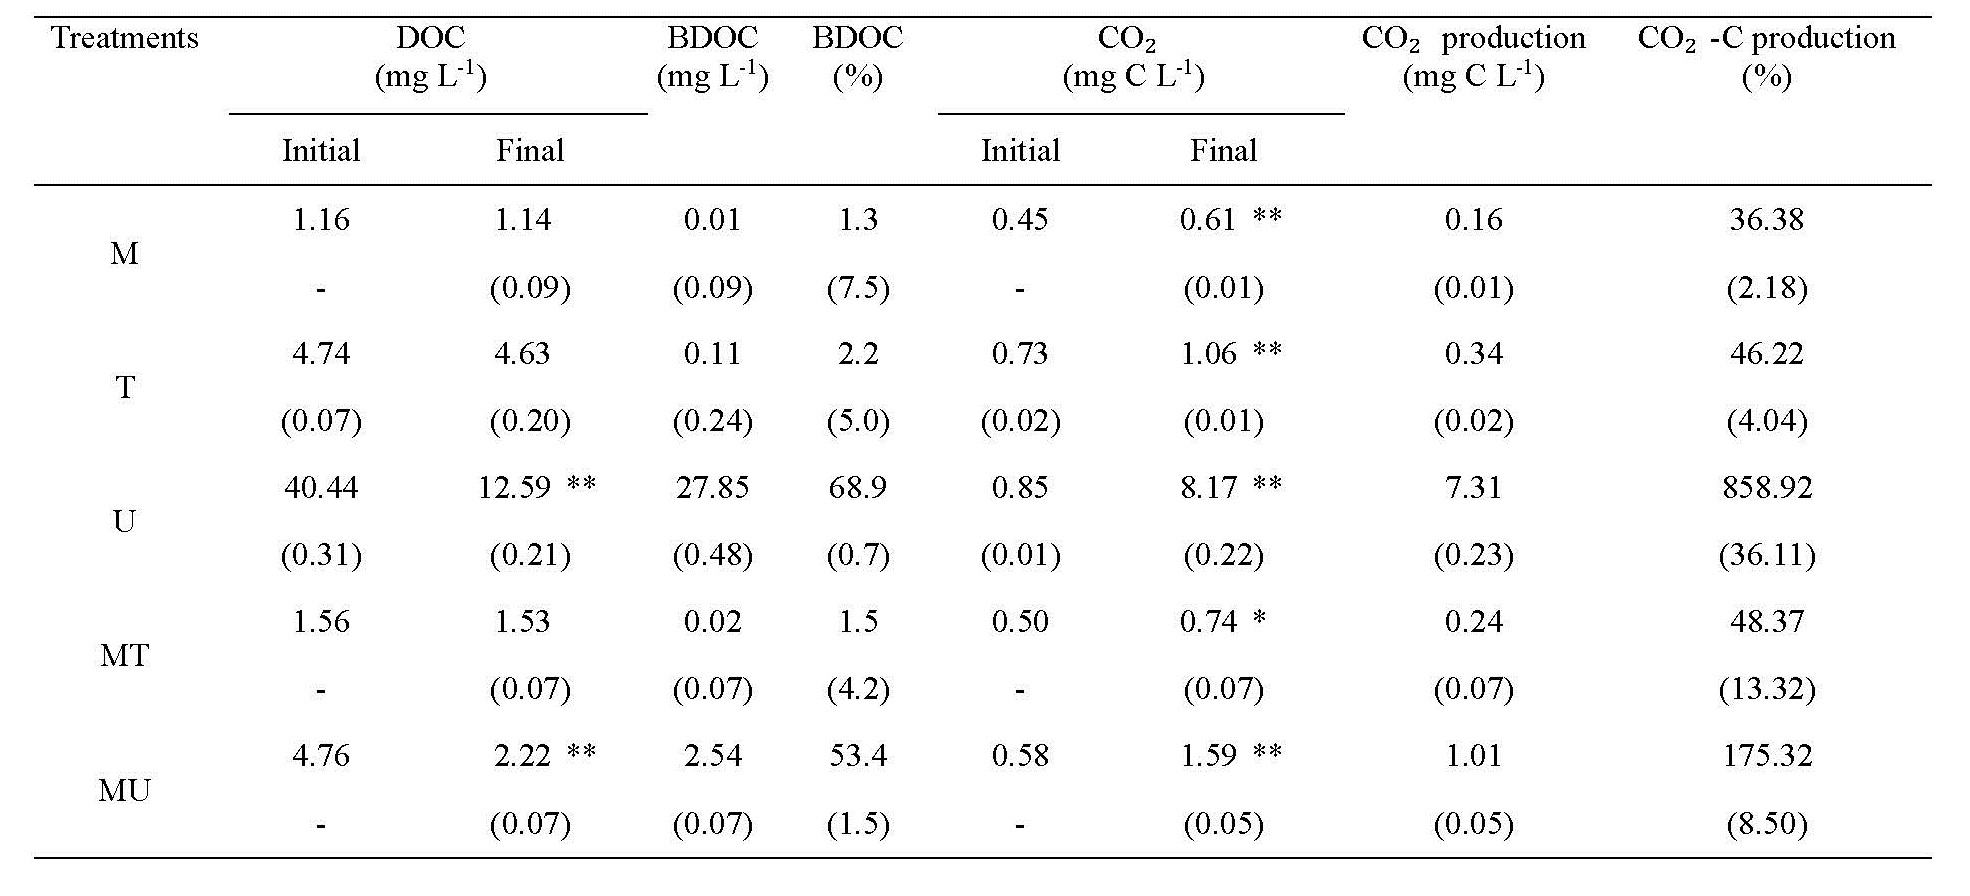
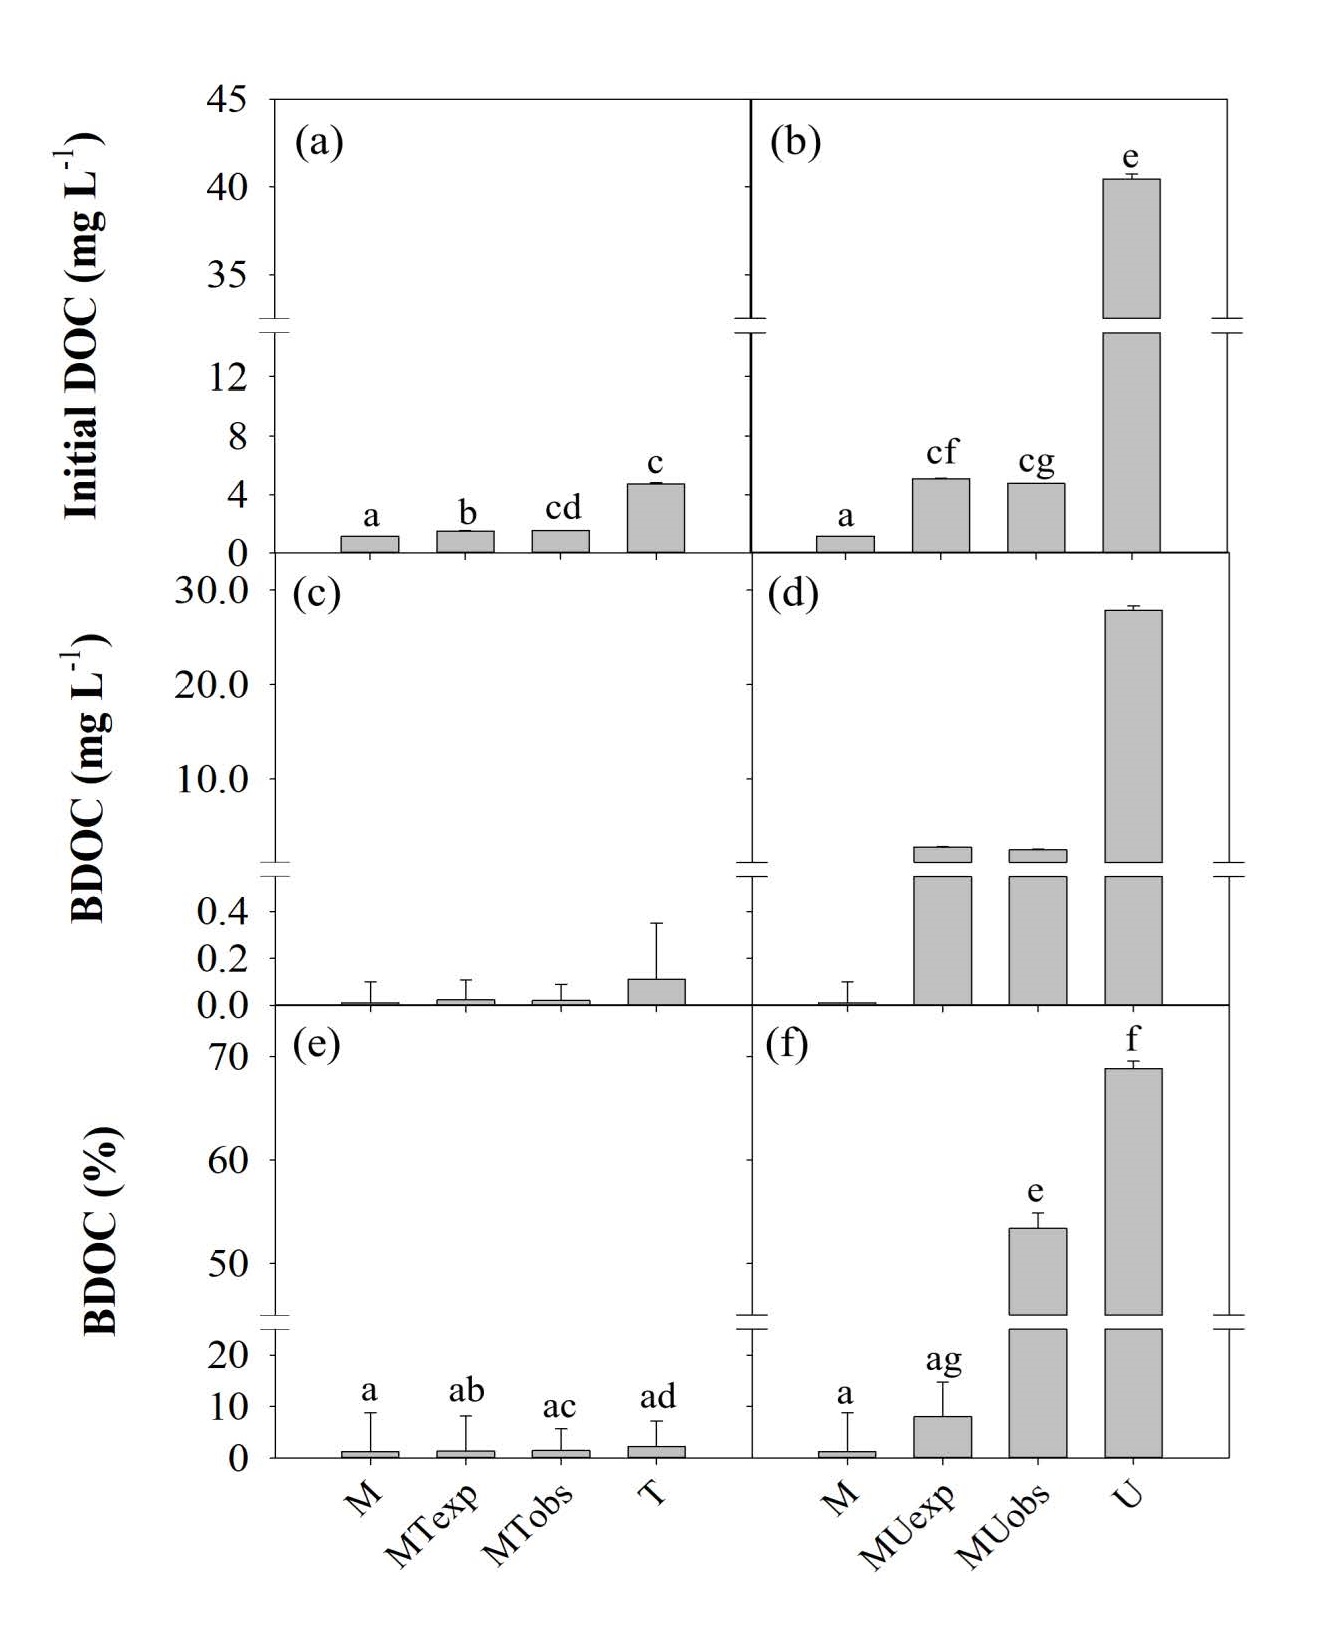
To reflect a small portion accounted for wastewater in the total discharge of the riverine OM, the mixture treatments involving 10% wastewater (i.e., MT and MU) were compared with the original samples of river water and wastewater. The MT samples had similar or slightly higher BDOC concentration (0.02 mg L-1) and %BDOC (1.5%) than the expected mixing average of M and T (0.02 mg L-1 and 1.39%; Figure 2c,e; Table 2). However, %BDOC in MU (53.4%) sample was significantly higher than their expected mixing average (8.1%), suggesting a mixing-induced enhancement in biodegradation (one-way ANOVA, P < 0.05) (Figure 2d,f; Table 2). High biodegradability of the U and T samples was also reflected in the high rates of CO2 production measured during the three-day incubation. The mean rate of CO2 production was highest in the U samples (7.31 mg L-1), consistent with the highest BDOC values (Figure 3d; Table 2). Mixing-enhanced biodegradation was also evident in the high rates of CO2 production in both MT (0.24 mg L-1) and MU samples (1.01 mg L-1); however, the production rate was significantly higher in the MU samples (ANOVA on ranks, P < 0.05) (Figure 3c,d; Table 2). These unexpectedly higher values of BDOC and CO2 suggest that wastewater with labile DOM can play an important role in increasing riverine GHG emissions (Guo et al., 2014).
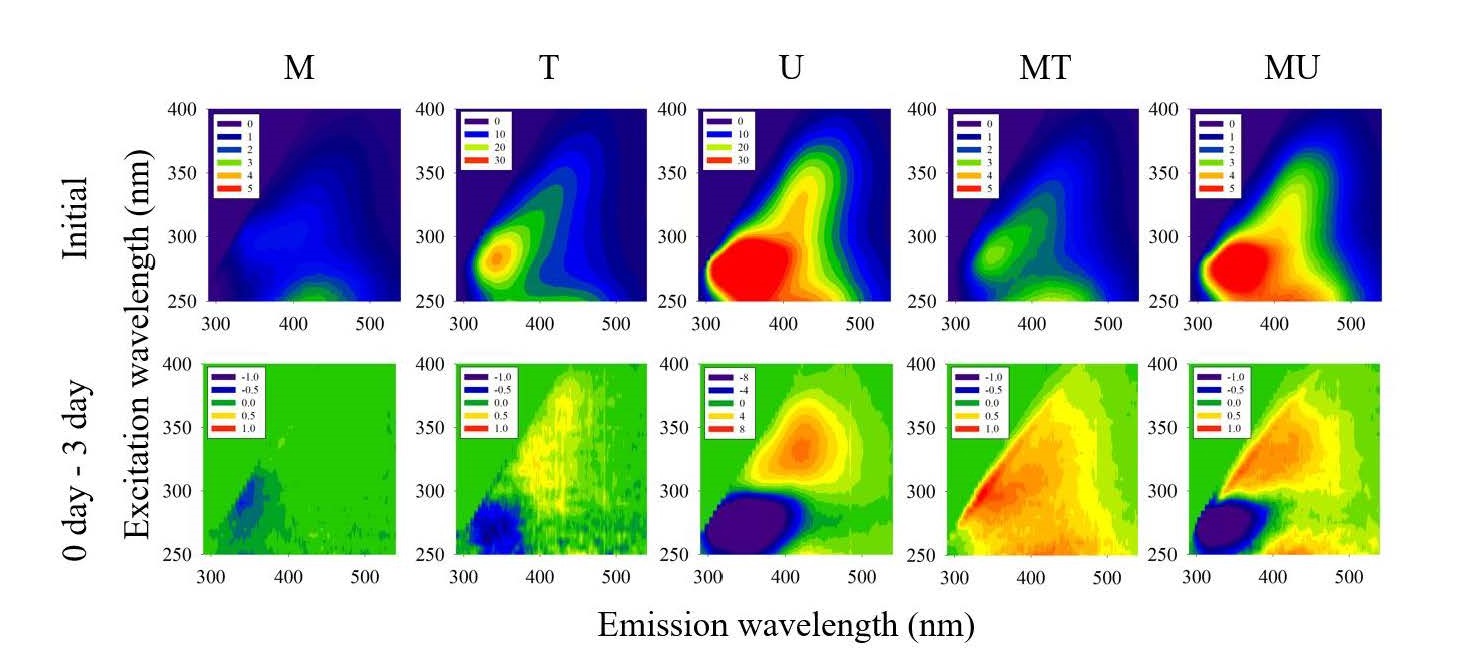
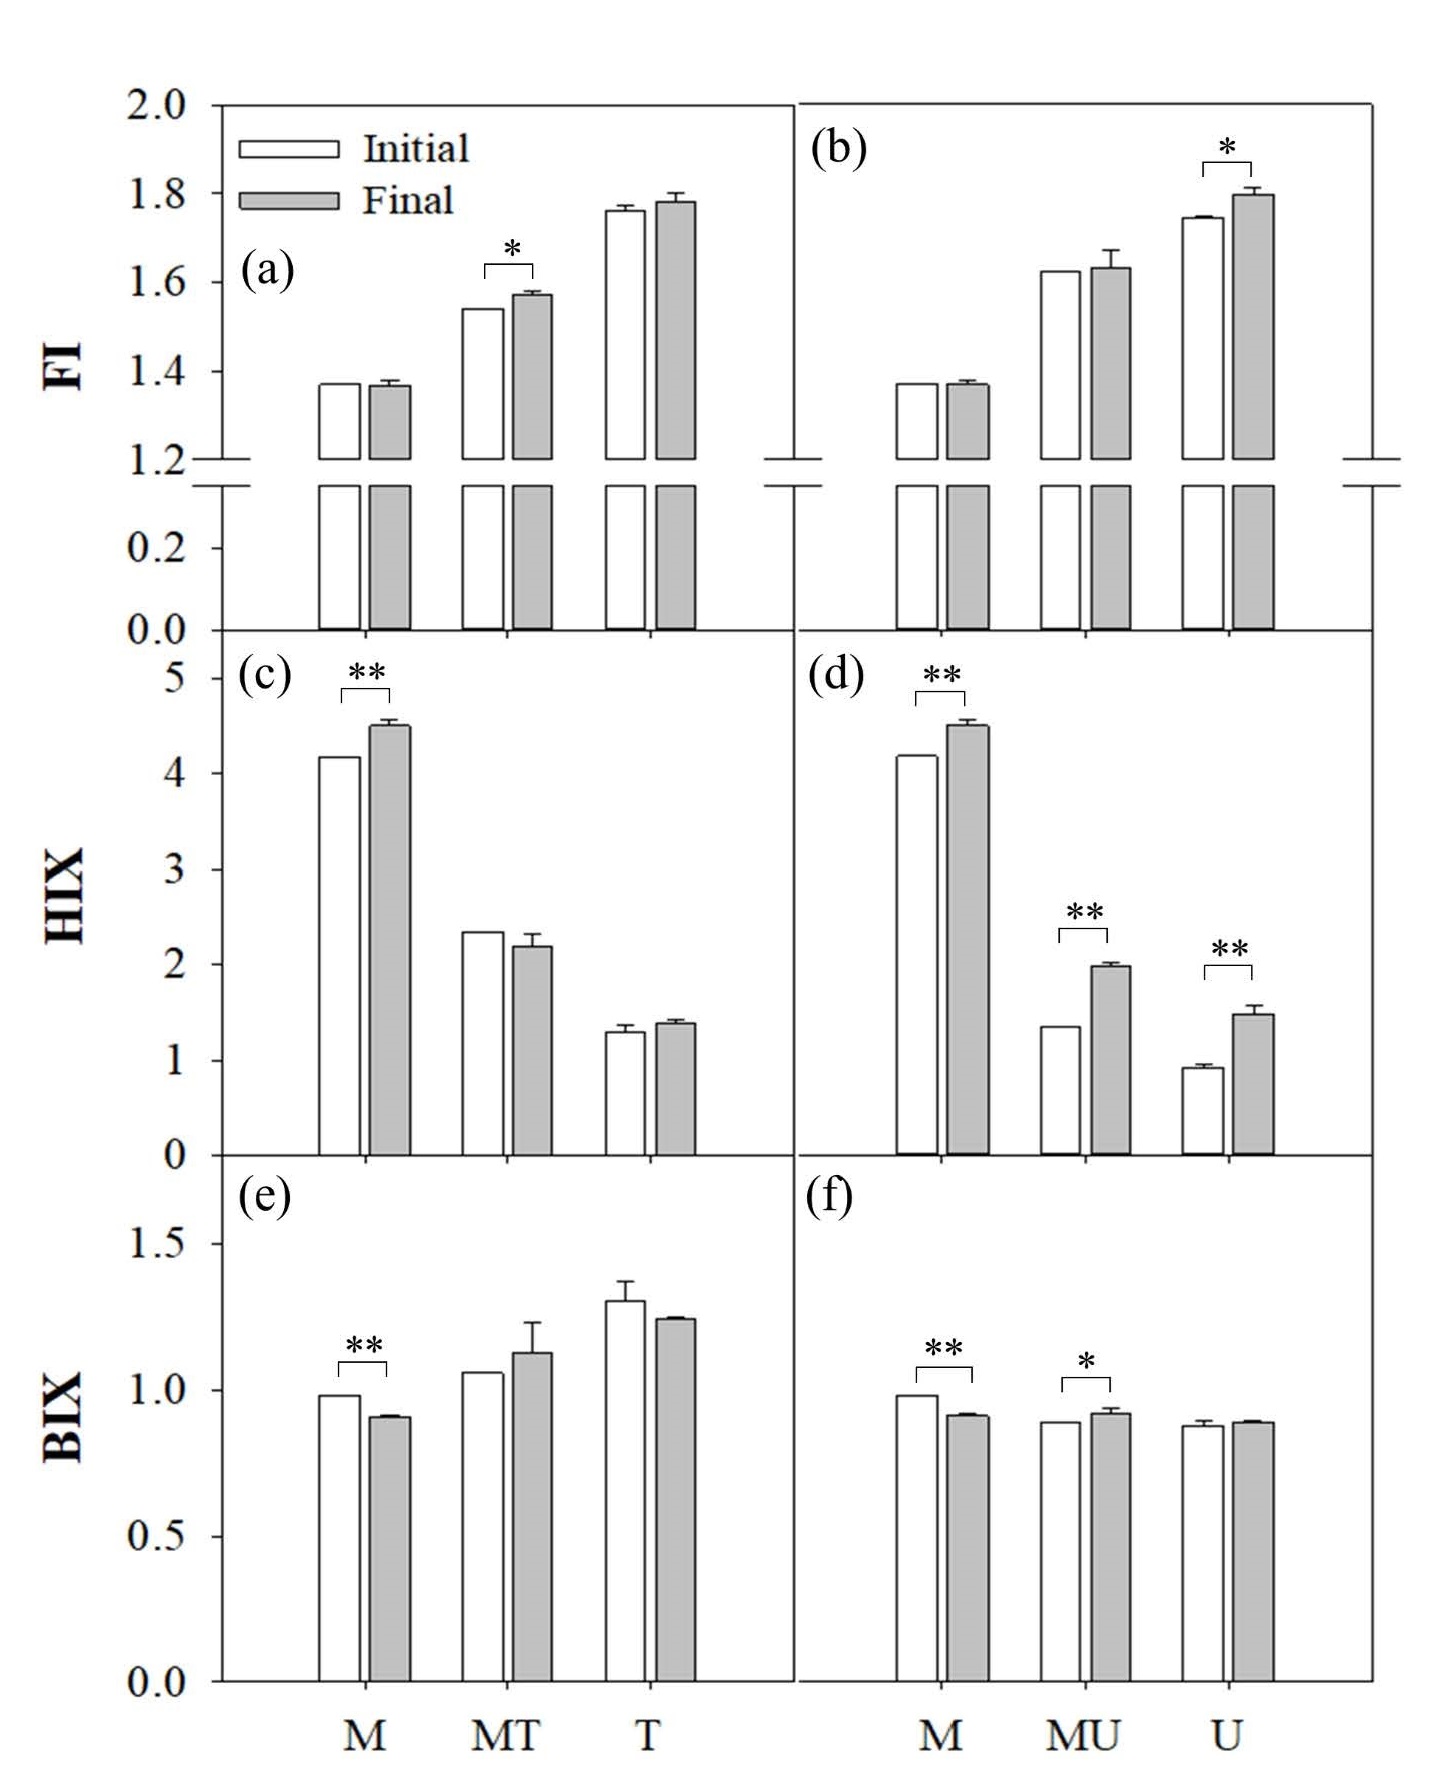
Labile fractions of DOM that can enhance riverine CO2 emission were examined by comparing differential EEMs measured for different treatments (Figure 4). Biodegradation of DOM components, particularly in the protein-like region, was pronounced in U samples, consistent with high values of FI and low values of HIX (Figures 4, 5). Even though production of new DOM moieties was also observed in the wastewater samples, the production rate was much higher in the U samples. The significant differences in degradation and production of fluorescent DOM components between the T and U samples (Figure 5) suggest the importance of WWTPs in the metropolitan cities discharging a large amount of labile DOM to the rivers. Wastewater can emit large amounts of GHGs directly from the source to downstream rivers (Alshboul et al., 2016) or indirectly via degradation of labile DOM contained in the discharged wastewater (Yoon et al., 2017; Jin et al., 2018). Furthermore, the discharged wastewater can also exert a synergistic effect on OM processing when it is mixed with the downstream river water (Begum et al., 2019). As shown in Figure 4, the treated wastewater predominantly produces new OM upon mixing with the river water, which lacks in nutrients and other resources for immediate microbial degradation. Instead, humic-like and protein-like DOM components are produced from dead cells and microbial exudates (Huguet et al., 2009; Guo et al., 2014). On the other hand, the labile fraction of protein-like DOM in untreated wastewater can rapidly degrade and produce humic-like DOM from microbial activities upon mixing with the river water, which is also consistent with significant increases in the HIX values, particularly in U and MU samples during the three-day incubation (Figures 4, 5). The EEMs of the MT and MU treatments exhibited merely the net change in DOM components during the three-day incubation; however, differential EEMs with shorter intervals would show the complex patterns of production and degradation of DOM in mixed samples as reported by a previous study (Begum et al., 2019). Considering that organic matter export and GHG emissions from rapidly urbanizing river basins around the world represent one of the major uncertainties in our understanding of global riverine C budgets (Regnier et al., 2013; Park et al., 2018), synergistic effects of wastewater mixing (Figures 2, 3) and ensuing subtle chemical changes in different DOM fractions warrant further tests across a wide range of organic pollution and river size. In particular, more attention needs to be paid to widely varying characteristics of wastewater discharged from domestic and industrials sources.
4. Conclusion
The three-day incubation experiment provided empirical evidence of both treated wastewater and untreated sewage contributing labile DOM and GHGs to downstream reaches in urbanized river systems. Mixing of untreated sewage and river water induced a much higher enhancement of the biodegradation of riverine OM and CO2 emission, as compared with the moderate effect of treated wastewater. Major findings of this study suggest that the untreated wastewater that is directly discharged into large rivers in many developing countries can drastically increase the rate of GHG emissions from downstream rivers. The negative effect of untreated sewage on DOM biodegradation and GHG emission could be reduced substantially by constructing WWTPs, as demonstrated by the rather moderate effect of treated wastewater on BDOC and CO2 production. Although this experiment focused on CO2 only, other GHGs can also be minimized by implementing wastewater treatment facilities. The findings of this case study need to be interpreted with caution, because the response of smaller, more polluted rivers to wastewater addition might be quite different from the observed effects of wastewater addition to the moderately polluted water of the large Mekong River. Another uncertainty is how wastewater mixing would induce some combined effects of other water quality components, such as pH, DO, and nutrients, adding to the singular effect of DOC as explored in this study. Future studies, including other factors such as primary production, necessary nutrients for biodegradation, incubation under light-dark cycles, incubation for a longer period, and incubation with various types of wastewater, can provide more detailed information that is required to mitigate the impact of wastewater on GHG emissions from increasingly urbanizing river systems worldwide.
Acknowledgement
This research was supported by the Asia-Pacific Network for Global Change Research (APN; CRRP2016-01MY-Park). We would like to thank the students of Eliyan Chea for their help with sampling in Phnom Penh.
References
- Alshboul, Z., Encinas-Fernandez, J., Hofmann, H., & Lorke, A. (2016): Export of dissolved methane and carbon dioxide with effluents from municipal wastewater treatment plants, Environmental Science & Technology, 50(11), 5555–5563. doi:10.1021/acs.est.5b04923
- Bastviken, D., Tranvik, L. J., Downing, J. A., Crill, P. M., & Enrich-Prast, A. (2011). Freshwater methane emissions offset the continental carbon sink. Science, 331(6013), 50-50. doi:10.1126/science.1196808
- Bhatt, M. P., McDowell, W. H., Gardner, K. H., & Hartmann, J. (2014). Chemistry of the heavily urbanized Bagmati River system in Kathmandu Valley, Nepal: export of organic matter, nutrients, major ions, silica, and metals. Environmental Earth Sciences, 71(2), 911–922. doi:10.1007/s12665-013-2494-9
- Begum, M. S., Jang, I., Lee, J.-M., Oh, H. B., Jin, H., & Park, J.-H. (2019). Synergistic effects of urban tributary mixing on dissolved organic matter biodegradation in an impounded river system. Science of the Total Environment, 676, 105–119. doi:10.1016/j.scitotenv.2019.04.123
- Evans, C., Monteith, D., & Cooper, D. (2005). Long-term increases in surface water dissolved organic carbon: Observations, possible causes and environmental impacts. Environmental Pollution, 137(1), 55–71. doi:10.1016/j.envpol.2004.12.031
- Guo, W., Yang, L., Zhai, W., Chen, W., Osburn, C. L., Huang, X., & Li, Y. (2014). Runoff‐mediated seasonal oscillation in the dynamics of dissolved organic matter in different branches of a large bifurcated estuary—The Changjiang Estuary. Journal of Geophysical Research: Biogeosciences, 119(5), 776-793. doi:10.1002/2013jg002540
- Hosen, J. D., McDonough, O. T., Febria, C. M., & Palmer, M. A. (2014). Dissolved organic matter quality and bioavailability changes across an urbanization gradient in headwater streams. Environmental Science & Technology, 48(14), 7817–7824. doi:10.1021/es501422z
- Huguet, A., Vacher, L., Relexans, S., Saubusse, S., Froidefond, J., & Parlanti, E. (2009). Properties of fluorescent dissolved organic matter in the Gironde Estuary. Organic Geochemistry, 40(6), 706-719. doi:10.1016/j.orggeochem.2009.03.002
- IPCC (2007). Climate Change 2007: Mitigation. Contribution of Working Group III to the Fourth Assessment Report of the Intergovernmental Panel on Climate Change. B. Metz, O. R. Davidson, P. R. Bosch, R. Dave, & L.A. Meyer (Eds.), Cambridge University Press, Cambridge, UK and New York, USA.
- Jin, H., Yoon, T. K., Begum, M. S., Lee, E.-J., Oh, N.-H., Kang, N., & Park, J.-H. (2018). Longitudinal discontinuities in riverine greenhouse gas dynamics generated by dams and urban wastewater. Biogeosciences, 15(20), 6349–6369. doi:10.5194/ bg-15-6349-2018
- McKnight, D. M., Boyer, E. W., Westerhoff, P. K., Doran, P. T., Kulbe, T., & Andersen, D. T. (2001). Spectrofluorometric characterization of dissolved organic matter for indication of precursor organic material and aromaticity. Limnology and Oceanography, 46(1), 38–48. doi:10.4319/lo.2001.46.1.0038
- Ministry of Environment (ME) (2019). Water Environment Information System. Retrieved from http://water.nier.go.kr/
waterData/generalSearch - Misra, A. K. (2010). A River about to Die: Yamuna. Journal of Water Resource and Protection, 2(05), 489–500. doi:10.4236/jwarp.2010.25056
- Park, J. H., Nayna, O. K., Begum, M. S., Chea, E., Hartmann, J., Keil, R. G., … & Sarma, V. V. (2018). Reviews and syntheses: Anthropogenic perturbations to carbon fluxes in Asian river systems-concepts, emerging trends, and research challenges. Biogeosciences, 15(9), 3049.
- Raymond, P. A., Hartmann, J., Lauerwald, R., Sobek, S., McDonald, C., Hoover, M., … & Kortelainen, P. (2013). Global carbon dioxide emissions from inland waters. Nature, 503(7476), 355.
- Regnier, P., Friedlingstein, P., Ciais, P., Mackenzie, F. T., Gruber, N., Janssens, I. A., … & Arndt, S. (2013). Anthropogenic perturbation of the carbon fluxes from land to ocean. Nature Geoscience, 6(8), 597-607.
- Servais, P., Billen, G., & Hascoët, M. –C. (1987). Determination of the biodegradable fraction of dissolved organic matter in waters. Water Research, 21(4), 445–450. doi:10.1016/0043-1354(87)90192-8
- Sickman, J. O., Zanoli, M. J., & Mann, H. L. (2007). Effects of urbanization on organic carbon loads in the Sacramento River, California. Water Resources Research, 43(11). doi:10.1029/2007wr005954
- Wang, X., He, Y., Yuan, X., Chen, H., Peng, C., Zhu, Q., … & Liu, H. (2017). pCO2 and CO2 fluxes of the metropolitan river network in relation to the urbanization of Chongqing, China. Journal of Geophysical Research: Biogeosciences, 122(3), 470-486.
- Ward, N. D., Bianchi, T. S., Medeiros, P. M., Seidel, M., Richey, J. E., Keil, R. G., & Sawakuchi, H. O. (2017). Where carbon goes when water flows: Carbon cycling across the aquatic continuum. Frontiers in Marine Science, 4, 7. doi:10.3389/fmars.2017.00007
- Yoon, T. K., Jin, H., Begum, M. S., Kang, N., & Park, J.-H. (2017). CO2 outgassing from an urbanized river system fueled by wastewater treatment plant Effluents. Environmental Science & Technology, 51(18), 10459–10467. doi:10.1021/acs.est.7b02344
- Zsolnay, A., Baigar, E., Jimenez, M., Steinweg, B., & Saccomandi, F. (1999). Differentiating with fluorescence spectroscopy the sources of dissolved organic matter in soils subjected to drying. Chemosphere, 38(1), 45–50. doi:10.1016/s0045-6535(98)00166-0