Climate smart actions “Saung Iklim” for smallholder farmers in Subang district, West Java, Indonesia
Keywords
Adaptation · Climate · Climate smart action · Indonesia · Rice · Risk
Highlights
- Institutionalization of stakeholders’ engagement as the Regent of Subang District signed the formation of Tim Iklim to focus on climate action.
- Practical modules are available and easily accessed via the Tim Iklim website, https://pi-dev.co.id/timiklim/.
- The website stores all project outputs, i.e., crop simulation model outputs, modules, online surveys, and forums.
1. Introduction
Global climate change has been highlighted worldwide and has a significant effect on crop production (Hatfield et al., 2011; Lobell, Schlenker, & Costa-Roberts, 2011). Several studies in Indonesia reported that climate variability and extremes shifts, indicated by rainfall changes as well as rising temperature, would change rice production (Manzanilla et al., 2011; Hosang, Tatuh, & Rogi, 2012; Syaukat, 2011; Sumaryanto, 2012). In order to reduce the effects of climate change extremes, Climate Smart Agriculture (CSA) has been proved to be one of the major approaches for climate adaptation and mitigation measure. CSA is a regional framework initiated by the Food and Agriculture Organization (FAO) to apply farming technologies and practices to facilitate crop growth and production as well as development in the agro-ecosystem specific area. Observed actions improve yield or income, reduce emissions, enhance the efficiency of production inputs, and achieve resilience (Rioux et al., 2016).
However, CSA technology has challenges for implementation at the farm level in Indonesia. Shirsath, Aggarwal, Thornton, and Dunnett (2017) suggested that the promotion of CSA requires an understanding of sustainability, both the costs and benefits, and the environmental impacts of various technological interventions in the local context on current and future climatic conditions. Perdinan, Dewi, and Dharma (2018), used a rice commodity as an example to evaluate Smart Rice Actions in Indonesia, and suggested that the CSA implementation requires the capacity of farmers to properly utilize climate data and information for farming management and practices. However, farmers are facing difficulty in adopting the CSA due to limitations in knowledge and capacity, and availability of guidelines and tools (Perdinan et al., 2018; Anggarendra, Guritno, & Singh, 2016). Fortunately, the GoI strongly supports any action targeted to address the climate impacts on crop production that can hamper the self-sufficiency target. For example, the GoI issued a web-based tool with a cropping calendar named Kalender Tanaman (KATAM), http://katam.litbang.pertanian.go.id/main.aspx. This tool provides information on crop sowing dates for administrative boundaries in Indonesia (i.e., provincial to sub-district).
The KATAM tool also provides advisories for areas prone to flood and drought via maps at the administrative level, although limited to use of KATAM for farmers at a specific location. As of now, KATAM does not provide information on the potential impacts of climate variability and projected climate change on crop production. However, farmers are often unaware of KATAM raising a challenge associated with communication media and limited knowledge on utilizing climate information (Anggarendra et al., 2016). Additional initiatives are needed to equip farmers with tools and guidance to manage climate risks on farming activities. Collaborative work with local actors such as local government, university, and farmers’ organizations are essential to embrace the local context so that the initiatives are understood and can be adopted locally. This type of proposed initiative complies with the commitment of the GoI that lately is articulated in the National Determined Contribution (NDC) submitted to the United Nations Framework Convention on Climate Change (UNFCCC) in 2016. The NDC endorsed the need to reduce climate change risks on food through local capacity building and the application of adaptive technology (GoI, 2016).
This project strived to directly enhance the capacity of Tim Iklim (composing of local government, extension workers, farmers’ groups and universities) and the rice farmers of Subang district. Tim Iklim is a formal team established by the Regent Decree of Subang No.600/Kep.251-BP4D/2017 at the forefront to enhance farmers’ capacity in managing climate risks on crop production. The establishment of Tim Iklim is in line with Indonesia’s NDC goal, where agriculture is prioritized as a key development sector. This is also consistent with the goals of Asia-Pacific Network for Global Change Research (APN) in its research, capacity development, and science-policy agendas. With reference to the NDC request, it is necessary to formulate capacity building programmes that ensure the transfer of knowledge to the targeted recipients.
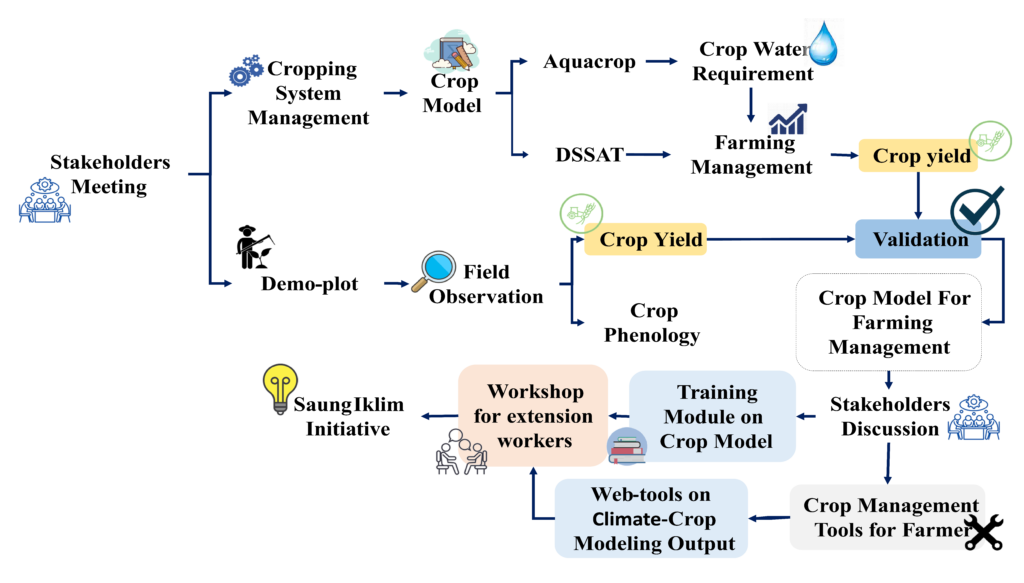
The project strived to improve the capacity of extension workers and farmers on utilizing climate information through the implementation of Climate Smart Action “Saung Iklim” in using the Subang district as a pilot project. Specifically, the project is directed to 1) improve the knowledge and capacity of Tim Iklim in utilizing crop simulation model; 2) provide climatic driven tools to enhance farmers’ capacity; 3) support the established Tim Iklim to apply climate-smart actions; 4) enhance the awareness of farmers and extension workers to collect and document farming issues and strategies through the digital reporting system; 5) recommend lessons learned for future implementation of climate-smart actions. The project team collaborated with Tim Iklim to run the project and produce the deliverables through a series of stakeholders’ engagement via meetings, training, field visits and demonstration plots. The active involvement of Tim Iklim is aimed at sustaining the work to continually improve farmers’ capacity to properly employ climate information.
2. Methodology
The project was mainly directed to enhance the capacity of local stakeholders of Subang district, i.e., Tim Iklim and farmers, in managing climate change risks through a capacity building program. The project team worked together with Tim Iklim to enhance the capacity and skills of the stakeholders in utilizing climate information for cropping system management. Crop models (i.e., Aquacrop (Steduto, Hsiao, Raes, & Fereres, 2009) and DSSAT (Jones et al., 2003) were introduced through training and workshops. Aquacrop, the FAO Crop Model (http://www.fao.org/aquacrop), was employed to train Tim Iklim in understanding crop water requirement, and training on DSSAT (Tsuji & Balas, 1993) was used to learn about crop models and their use for farming management and practices. Experimental fields were created in the form of demonstration plots under the management of Tim Iklim and farmers (i.e., 4 farmers and 8 extension workers). The main essence of the demonstration plots was to engage with farmers in observing crop phenology to advocate the benefits of having crop phenology records to understand crop responses to different climatic environments, i.e., high elevation (sub-district of Cijambe), middle elevation (sub-district of Pagaden, Purwodadi) and low elevation (sub-district Binong, Pamanukan). The five sub-districts are part of the rice production centres in Subang district.
The project team designed a web-based tool with a graphical user interface to ease the use of crop modelling outputs, completed with the user modules. This approach was chosen understanding Tim Iklim works together with the agricultural development office are appointed by the Regent decree to enhance the service in utilizing climate data and information to support farming practices in the major rice-grown areas that include sub-districts of Binong; Blanakan; Ciasem; Compreng; Legonkulon; Pabuaran; Pamanukan; Patok Beusi; Pusakanagara; Pusakajaya; and Tambakdahan. The climatic driven tools were then employed for workshops and training sessions to enhance the capacity of Tim Iklim and local stakeholders comprising government officers, stakeholders, students from Subang University, team experts and assistants. All activities were stored on a dedicated website of Tim Iklim https://pi-dev.co.id/timiklim/) to initiate “Saung Iklim” as a platform to learn how to use climate information for farming management and practices on rice production as illustrated in Figure 1. Further explanation of the steps of the project implementation is provided in the sub-sections below.
2.1 Utilization of crop simulation model
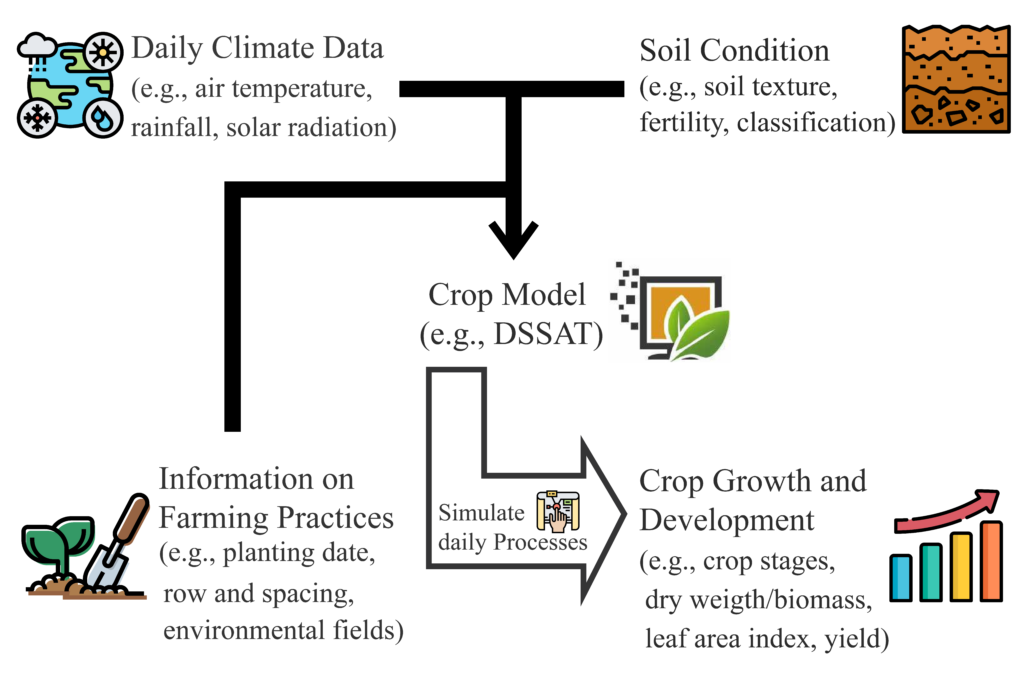
Well-known crop simulation models, the FAO – AquaCrop (http://www.fao.org/aquacrop) and DSSAT (Tsuji & Balas, 1993; Tsuji, Hoogenboom, & Thornton, 1998) were employed to simulate the potential impacts of climate variability and change in different climate types of the Subang district. The simulation model provides information on the effects of climate fluctuations on planting time and productivity. As a case study, a rice crop was selected for the model simulation. This selection was made considering rice is the major crop in Subang district, acknowledged as the third main rice producers in Indonesia. Crop model simulation, i.e., DSSAT or AquaCrop, requires information on daily climate data, soil, and farming management as model inputs (Hoogenboom et al. 2010; Hoogenboom et al., 2019; Jones et al., 2003), assuming pest and diseases infestations are not included so resulted in attainable yield. Daily climate data for each climate type within the Subang district were prepared based on observations whenever available. When a series of climate data are not available, available gridded climate data were employed. Soil and farming management were prepared with regards to the condition of demonstration plots. The rice cultivars used in this simulation were IR42 (for lowlands) and IR64 (for uplands), of which genetic coefficients are already available in the CERES-rice model (Singh & Ritchie, 1993) included in DSSAT.
2.2 Computer-assisted climate-driven tools
The results from the crop simulation model should be translated to a language or activity that can be understood and employed by farmers. The toolkits and/or instruments were deployed as a learning media to evaluate the effects of climate variability and change to rice productivity. The learning media was developed using a computerized web-based system to ease users so that they do not need to deal with the complexity of crop model simulation and analysis. Modules for the use of the climate-driven tools were included in the learning platform. The modules were designed to explain, step-by-step, the utilization of the climatic-driven tools. The modules were written by considering inputs from Tim Iklim and the stakeholders. The Focus Group Discussions (FGDs), workshops, and/or consultation meetings were conducted to gather input for writing the learning materials.
2.3 The field experimental showcase (demonstration plot)
The project team together with Tim Iklim and the farmers’ group selected farm fields owned and cultivated by farmers to observe crop phenology in five locations for the demonstration plot. The locations were the sub-districts of Binong, Purwadadi, Pamanukan, Pagaden and Cijambe. The demonstration plots were also introduced to the students at the Department of Geophysics and Meteorology as part of the fieldwork program installed by the Institut Pertanian Bogor (IPB University) to send students to do field practice named Kuliah Kerja Nyata (KKN) – Community Service Program.
2.4 Stakeholders engagement
The engagement was designed through a systematic approach on communication sharing mechanism named “Saung Iklim”. Tim Iklim coordinated the engagements through a series of FGDs, workshops, meetings, and field visits that involved government officers, extension workers, farmers’ groups and local scientists. This engagement mechanism was preferred as one-shot workshop or training, hence, may not provide significant impact on the targeted beneficiaries. Tim Iklim as mandated by the Regent decree is the taskforce that is assigned to address climate change issues in the district. Tim Iklim managed “Saung Iklim” as a sharing media to learn the use of climate data and information for managing climate risks.
3. Results and discussion
3.1 Training on climate risk management
Climate Smart Action formulated into “Saung Iklim” is mainly designed to equip stakeholders (i.e., local government, extension officers, and farmers) to manage climate risks affecting on-farm production. One of the potential approaches to understanding the impacts of climate fluctuation on crop growth and development is by using crop models. The models simulate the interaction of the atmosphere, crop growth and development, soil condition and agronomic practices (Hoogenboom et al., 2010; Hoogenboom et al., 2019; Jones et al., 2003) as illustrated in Figure 2. Three training sessions on how to use crop simulation models, i.e., Aqua Crop and DSSAT, were conducted to enhance local stakeholders’ understanding of the potential impacts of climate fluctuation on rice productivity. The training and workshops were targeted to about 25-30 participants (i.e., the Tim Iklim members and farmers’ leaders). Modules on how to run the crop models were developed for the training, which detailed the step-by-step procedure on how to simulate rice production.
Considering the complexity of managing climate risks, the other modules were also developed and used for the six training sessions targeted to Tim Iklim, extension workers, and farmer representatives. The modules were designed together with the local government of Subang (Agriculture Division), extension workers, and leaders of farmer groups to gather their inputs via FGDs and stakeholder consultations. The developed modules written in Bahasa Indonesia are summarized below.
- Module on Interpreting Climate Risk Maps. This module is designed for agricultural extension workers to guide them in reading climate risk maps of the Subang district that are grouped into seven different climatic zones and the impacts of varying rainfall to rice yields.
- Module of Tim Iklim for Farmers Association. This module was developed by the Agriculture Division of Subang district, which articulated the languages of Module 1 to be easily understood by the members of farmers groups or associations.
- Module on the Use of Aqua Crop Model to Simulate Rice Productivity. This module contained a step-by-step procedure to use the Aqua Crop model for simulating rice productivity. The targeted users (i.e., Tim Iklim, extension workers, and farmer leaders) were taught how climate fluctuations can affect crop productivity.
- Module on the Use of DSSAT Model. This module explained the basic requirements to simulate crop growth and development using the DSSAT Model to the training participants.
- Module on Field Observations. This module was intended for the demonstration plot and targeted to users who helped in observing crop phenology. This module guided observers to record phenology stages of rice starting from sowing to harvesting as well as how pest and diseases infected rice during the observation period.
- Module on Utilization of Website of Tim Iklim. This module was designed for the targeted users (e.g., Tim Iklim, extension workers, and farmers association) and a wider audience to obtain information about the project. The website contains a tool that stores simulations of rice productivity using Aqua Crop and DSSAT models under different climate conditions for the Subang district. Project reports that explain all activities and recommendations for managing climate risks to farming activities in Subang district are also available.
3.2 Dissemination media of Tim Iklim activities
Climate information was not the main reference for agricultural activities in Subang district. However, the local stakeholders realized that climate fluctuations contributed to the failure of crop production in the district. This situation urges the need to record lessons learned from the project and disseminate the project outputs to a wider audience. The project team, together with the local government in Subang district, represented by BP4D Subang District Economic Section and Subang District Agriculture Office as well as agricultural extension workers, agreed to develop an online media as a dissemination tool. A website (https://pi-dev.co.id/timiklim/), stored information about the project activities, including photos, and published papers written by the project team members. The main page is shown in Figure 3.
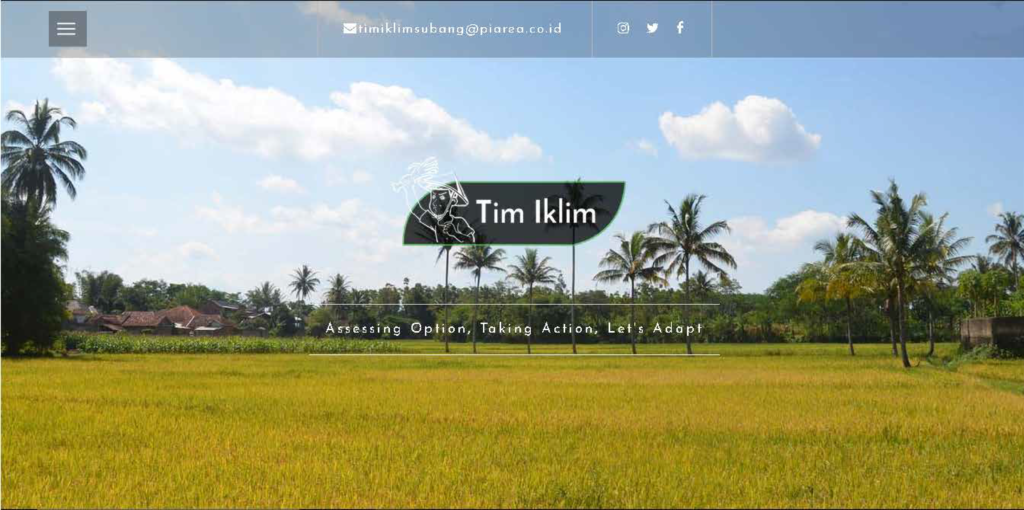
The website contains several menus focused on managing reports, training modules, a database of crop model simulations, and agricultural impact surveys. The gallery section contains photos of Tim Iklim’s activities while carrying out activities in Subang. All modules explained in Section 3.1 are stored on the website. The modules were converted into a digital format so that they can be easily accessed and downloaded by Tim Iklim and other users.
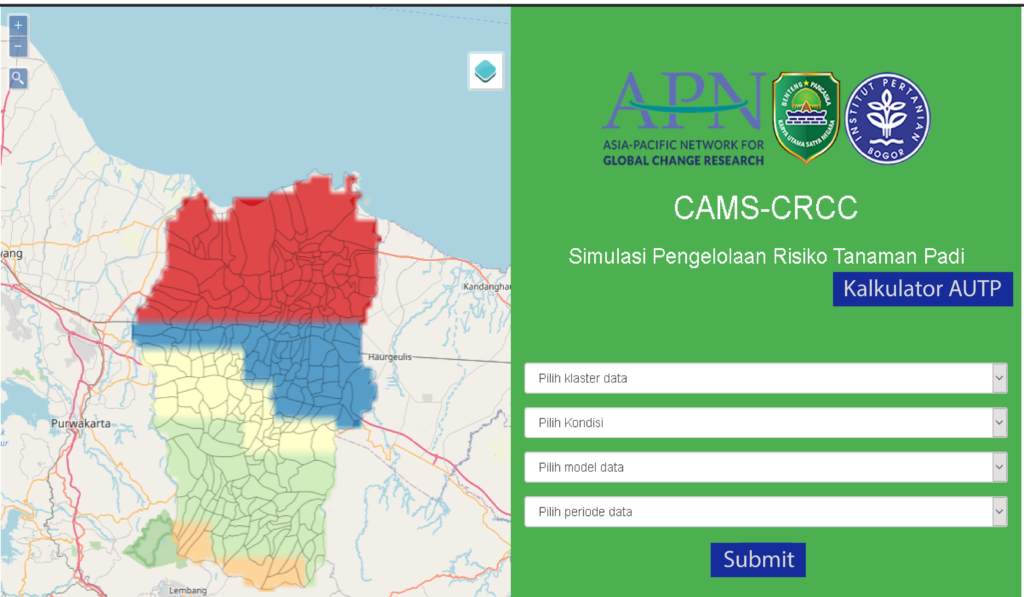
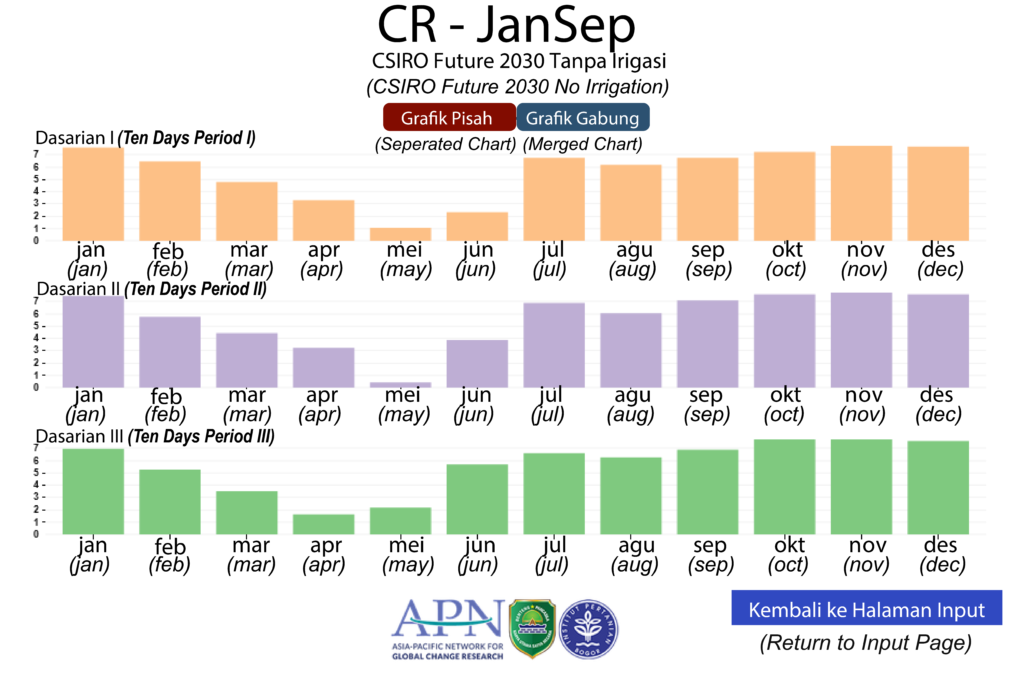
A database of simulated Aquacrop and DSSAT models was established on the website to allow users who are not familiar with crop simulation models to learn about the impacts of climate variation on rice productivity. The database stored information of simulated rice productivity under different climate scenarios grown in different climate types of Subang district, which are grouped into five (5) climate clusters. The clusters were divided based on the highest and lowest rainfall values in the past 30 years. Climate scenarios were the simulation options with reference to the potential impacts of climate phenomena, i.e., climate change (projected future climate based on CSIRO and MIROC climate models) and climate variability (El Niño, La Niña, and Normal), on rice productivity. The interface of the database is shown in Figure 4 and the example of the simulation is in Figure 5. Please refer to the website for full information. In summary, the online interface (Figure 4) allows users to learn about fluctuations of crop productivity based on a set of inputs required for the system: 1) Regional climate cluster information; 2) Climatic conditions: climate change and climate variability; 3) Climate change scenarios based on climate model outputs of CSIRO and MIROC; 4) Data period and year; and 5) Rice field condition (rain-fed or irrigated). Two training sessions (on July 12, 2019, and August 15, 2019) were also conducted to ensure the website system could be used by users. The trainees were agricultural extension workers, the Subang District Agriculture Service, a joint farmer group, Subang University and the Subang Regency BP4D.
3.3 The demonstration plot
The field experimental showcase (demonstration plot) was purposed to observe plant phenology during the crop growth cycle. With the assistance of the local government and farmer leaders, the demonstration plots were chosen considering the geographical characteristics (lowland and plateau), climate conditions and characteristics of rice plants. The locations were rice fields in the sub-districts of Binong (0.35 ha), Pagaden (0.13 ha), Pamanukan (0.20 ha), Purwadadi (0.12 ha) (lowlands), and Cijambe (0.30 ha) (highlands). Climate parameters such as daily rainfall, air temperature, air humidity, evapotranspiration and crop phenology were observed using the methods listed in Table 1.
| Data | Parameter | Observation Methods | Tools |
| Climate | 1. Rainfall 2. Air Temperature 3. Air humidity 4. Evapotranspiration |
1. Measured with a rain gauge every 24 hours 2. Measured using a thermometer every day 3. Measured with wet ball and dry ball thermometer from which calculations were made 4. Plant samples were taken on paint cans and weighed every 2 days |
1. Simple rain gauge 2. Wet and dry bulb thermometer 3. Digital scales 4. Paint cans and plastic bottles |
| Phenology | Plant height and tillers | Measured with tape and calculator once a week in the vegetative phase and 4 days in the generative phase | 1. Tape measurements 2. Calculator |
| Irrigation | Soil water level | Measured by tape following phenology observations | 1. Tape measurement |
Table 1. Observation methods used for field observations.
Observed climate data and soil parameters obtained from the field observations were employed to run the rice model in DSSAT. This software has been widely used around the world to explore the consequences of environmental changes and different farming practices on crop growth and development (O’Neal, Nearing, Vining, Southworth, & Pfeifer, 2005; Dias, Navaratne, Weerasinghe, & Hettiarachchi, 2016). One of the variations in farming practices is the use of different crop varieties. Except for Cijambe that was simulated using IR64, the rest of the demonstration plots ran using rice varieties of IR 42 (Table 2).
| Coefficient | Unit | Definition | IR42 | IR64 |
| P1 | °C day | Thermal unit for vegetative base phase | 651 | 500 |
| P2R | °C day | Day length sensitivity coefficient | 120 | 160 |
| P5 | °C day | Thermal units are needed from the initial filling of grains (3-4 days)after initial flowering) rice to physiological maturity | 580 | 450 |
| P2O | Hour | The length of the critical day when developments are at their maximum rate | 10.5 | 12 |
| G1 | (/gram) | Potential grain coefficient as an estimate of the number of grains per gram at flowering | 65 | 60 |
| G2 | Gram | Unit grain weight under ideal development conditions (light, water, and nutrients are met, while pests and diseases are absent) | 0.028 | 0.025 |
| G3 | Tillering coefficient | 1 | 1 | |
| G4 | Temperature coefficient of tolerance (usually a value of 1 for varieties that grow in a normal environment) | 1 | 1 |
Table 2. Information on genetic coefficients for rice varieties used for DSSAT simulation in the study area.
The use of varying rice varieties (IR42 and IR64) requested that users supply information on crop coefficients to distinguish the two rice varieties. Fortunately, the DSSAT model has a tool to generate genetic coefficients for different crops, and the coefficients for the two rice varieties were included in the genetic file of the DSSAT system as presented in Table 2. This requirement indicates that field experiments, particularly on testing the potential yields of different rice variety such as those frequently conducted by the Indonesian Centre for Rice Research named in Bahasa Balai Besar Penelitian Tanaman Padi (BBPadi) at http://bbpadi.litbang.pertanian.go.id/ should record the crop coefficients. The record can help minimize the costs for exploring potential areas for growing a specific rice variety as the crop coefficients can be supplied to crop model simulations such as DSSAT. Then, the crop model can be simulated using different climate data and soil conditions to examine potential areas to grow the rice variety across the country.
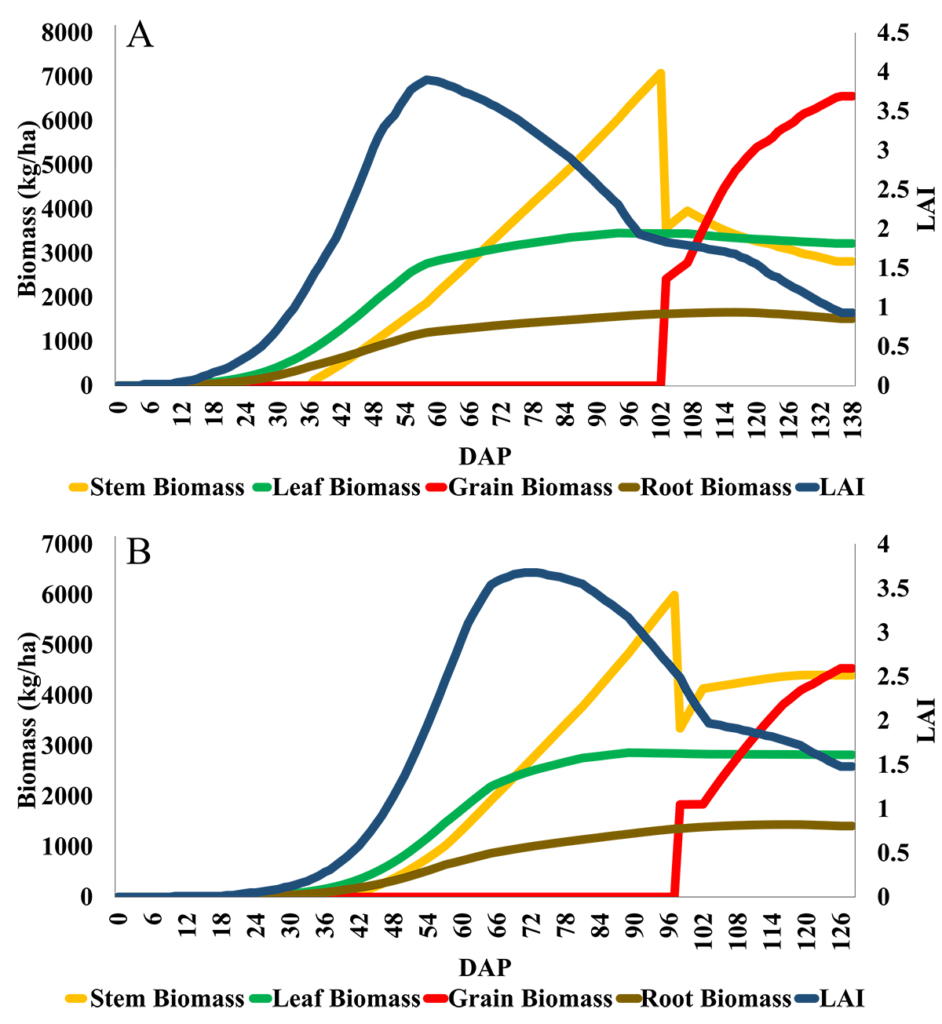
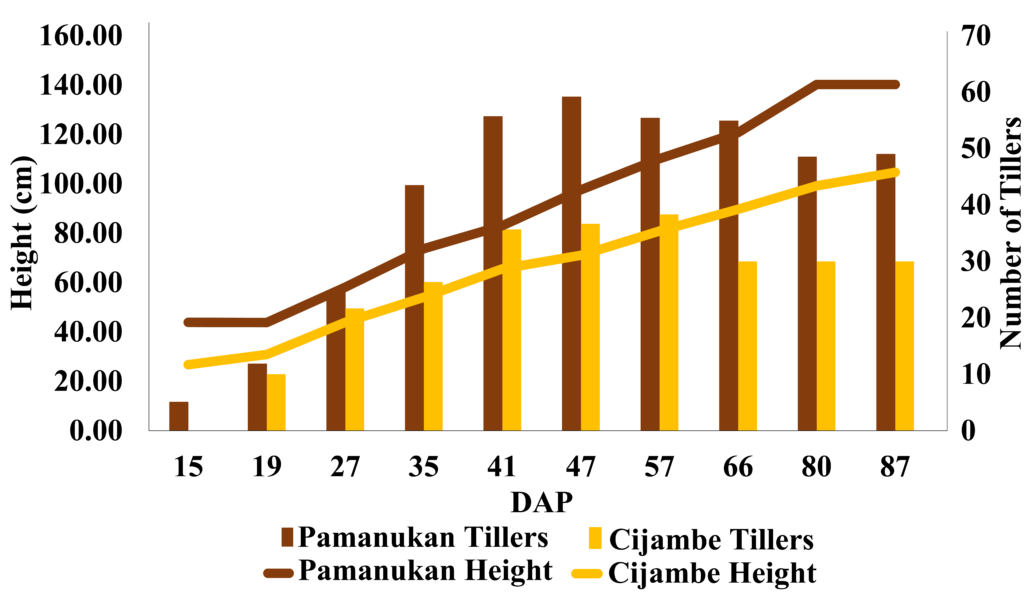
Furthermore, the crop simulation model allows users to learn about crop growth and development. As an illustration, simulated daily biomass was plotted throughout the crop cycle. The plots are shown for the growth of stems, leaf biomass, grains, roots, and leaf area index (LAI. The biomass of stems, leaves, grains and roots of rice increase and reach a maximum point at about 100 days after planting as illustrated in the case studies of Pamanukan and Cijambe (Figure 6). The pattern of height and number of observed tillers (Figure 7) positively related to the growth of crop biomass as displayed in Figure 6. The development of crop biomass also relates to crop productivity.
Simulated rice productivity for the five demonstration plots was then compared with the rice yields harvested by the farmers. The demonstration plots were cultivated by the farmers who were grown rice and allowed the Tim Iklim accompanied by the extension workers of the Agricultural Office of the Subang district to observe rice growth and development throughout the crop cycle. The harvested rice yields per hectare of each demonstration plot were estimated based on a sample plot. The sample plot called Ngubin in Subang was about 1000 m2. The rice productivity in the sample plot was estimated based on the numbers of grains multiplied by the grain weight. The numbers of grains were calculated based on the numbers of rice clumps, the numbers of tillers for each clump, and the numbers of grains for each tiller. The extension workers and the farmers assisted the estimation (i.e., crop cutting in the sample plot) as the procedure was commonly applied in the district. The harvested yields per hectare were then compared with crop yields simulated using the DSSAT model (Table 3).
| Demonstration plots | Field Estimation (tonnes/ha) | DSSAT Simulation (tonnes/ha) |
| Binong (IR 42) | 9 | 8.5 |
| Purwadadi (IR 42) | 7 | 6.2 |
| Pamanukan (IR 42) | 6 | 6.6 |
| Pagaden (IR 42) | 7 | 5.4 |
| Cijambe (IR 64) | 4 | 4.5 |
Table 3. Comparison of rice productivity obtained from field estimation and DSSAT simulation.
It can be seen from Table 3 that the simulated yields closely mimic the harvested yields as the crop model parameters required to run DSSAT had been suited well with field conditions. This result encourages Tim Iklim to understand the potential use of the crop models for farming management. It should be noted that the main purpose of this project was to showcase the use of crop models for managing climate risk to Tim Iklim, extension workers and farmers. Therefore, the lessons learned from the field showcase, crop models, and the crop simulation database (Figure 4) offered an alternative to Tim Iklim to consider crop interactions with different climate and environmental conditions for designing proper climate adaptation strategies at the farm level.
3.4 Lessons learnt through stakeholders engagement
The Focus Group Discussion (FGDs) and workshops were conducted to gather inputs from local stakeholders. The participants were officers of the Agricultural Division, academia, Gapoktan (Association of Farmers), extension workers and sub-district officers. The FGD was held from 15-16 August 2019, and discussed the modules and the Tim Iklim website. The participants explained that the developed modules were very helpful in planning management, monitoring and evaluation of farming practices. The participants justified that agricultural production inputs and facilities in the demonstration plot areas were available and accessible. There were no difficulties in the supply of production inputs.
The participants increasingly realized the need for using climate information for farming practices. This recognition is essential to encourage farmers to adopt or consider the use of climate information for farming management and practices. As of now, the Meteorological, Climatological and Geophysical Agency of Indonesia named in Bahasa Badan Meteorologi, Klimatologi dan Geofisika (BMKG), disseminate climate information and the Ministry of Agriculture utilizes climate information to suggest planting dates at the sub-district level via the KATAM application available at http://katam.litbang.pertanian.go.id/main.aspx. Thus, the results of this project can be seen as a continuation of utilizing KATAM at the farm fields using crop simulation models to predict potential yields under different climate scenarios. The crop simulation database for rice yields (Figure 4) was deployed to ease Tim Iklim as the end users in alleviating the complex procedures of running crop simulation models. The crop simulation database is integrated into the Tim Iklim website.
The Tim Iklim website was also considered useful for media sharing and learning. The modules on crop models (i.e., Aqua Crop and DSSAT) and the inclusion of the crop simulation outputs into the database integrated into the website were relatively easy to use. The participants also suggested to add more photos and illustrations following the step-by-step procedures explained in the modules. The user inputs and feedback were accommodated for finalizing the modules and the website of Tim Iklim.
4. Conclusion
The project activities were generally intended to equip the established Tim Iklim with proper tools and to enhance the capacity of farmers to utilize climate information for managing farm activities. Tim Iklim was established and mandated to provide climate-driven agricultural management strategies to raise awareness of the local government and farmers on the importance of utilizing climate information. The APN CAPaBLE project worked together with Tim Iklim to provide capacity building materials to help them undertake the mandate.
The implementation of Climate Smart Action “Saung Iklim” using climatic driven tools is essential to enhance the capacity of Tim Iklim and the other stakeholders (i.e., extension workers, local academia and farmers) in the Subang district. The targeted stakeholders were trained to use crop simulation models (i.e., Aqua Crop and DSSAT) and discuss the potential use of the tools to manage climate risks. Five demonstration plots were chosen to showcase the capability of simulation models and the importance of observing crop phenology for farming management. The Tim Iklim along with the local farmers learned that the climate characteristics (e.g., temperature, altitude, soil water) compounding with farming management (e.g., fertilizer application, cultivars, and planting dates) dictate rice productivity at the five demonstration plots, i.e., Binong, Purwadadi, Pamanukan, Pagaden and Cijambe.
The demonstration plots have displayed to the Tim Iklim and other stakeholders of Subang district the potential use of the two crop models for farming management. The project encourages the importance of recording crop coefficients and farming practices, which are required to run crop models. The models can mimic well daily crop growth and development only if the crop model parameters are well-suited to the field conditions. The digital media, crop simulation database and learning modules were developed as an approach to fully capitalize the new insight and knowledge from the CAPaBLE project conducted in the Subang district.
The GoI has actively encouraged the need to address climate change impacts on crop production concerning the adverse impacts of climate change (GoI, 2016). This APN CAPaBLE project has contributed to enhance the capacity of targeted local stakeholders on using climate information for farming practices. This capacity is essential to help farmers in understanding the climate-based planting tool that recommends planting dates at the sub-district level known as the KATAM application, which is available at http://katam.litbang.pertanian.go.id/main.aspx and managed by the Ministry of Agriculture. The lessons learned from the project are also expected to provide alternative tools for designing proper climate adaptation strategies at the farm level that consider interaction of crops, climate, and the environment that will dictate potential harvested yields.
Acknowledgement
This manuscript is based on work supported by the APN grant CBA2018-09SY-Perdinan. We thank all those who helped in the Climate Smart Action “Saung Iklim” for Small Holder’ Farmers in the Subang District, Regional Research and Development Planning Agency-BP4D Subang Regency, Agriculture Office of Subang Regency, IPB University, and the Landowners of the demonstration plots. The authors also appreciate GIZ support (#81263051) for providing technical assistance in revising the manuscript and the reviewers for their valuable input and queries to finalize the manuscript.
References
- Anggarendra, R., Guritno, C. S., & Singh, M. (2016). Use of climate information for rice farming in Indonesia. In S. Kaneko, & M. Kawanishi (Eds.), Climate Change Policies and Challenges in Indonesia, 295–304. doi:10.1007/978-4-431-55994-8_13
- Dias, M. P. N. M., Navaratne, C. M., Weerasinghe, K. D. N., & Hettiarachchi, R. H. A. N. (2016). Application of DSSAT crop simulation model to identify the changes of rice growth and yield in Nilwala River Basin for mid-centuries under changing climatic conditions. Procedia Food Science, 6, 159–163. doi:10.1016/j.profoo.2016.02.039
- Government of Indonesia (2016). First Nationally Determined Contribution Republic of Indonesia. A document submitted to United Nations Frameworks Convention on Climate Change (UNFCCC). Retrieved from https://www4.unfccc.int/sites/ndcstaging/PublishedDocuments/Indonesia%20First/First%20NDC%20Indonesia_submitted%20to%20UNFCCC%20Set_November%20%202016.pdf
- Hatfield, J. L., Boote, K. J., Kimball, B. A., Ziska, L. H., Izaurralde, R. C., Ort, D., … Wolfe, D. (2011). Climate impacts on agriculture: Implications for crop production. Agronomy Journal, 103(2), 351–370. doi:10.2134/agronj2010.0303
- Hoogenboom G, Jones, J.W., Wilkens, P.W., Porter, C.H., Boote, K.J., Hunt, L.A., … Tsuji, G.Y. (2010). Decision support system for agrotechnology transfer (DSSAT) version 4.5. [CD-ROM]. University of Hawaii, Honolulu, Hawaii.
- Hoogenboom, G., Porter, C.H., Shelia, V., Boote, K.J., Singh, U., White, J.W., … Jones, J.W. (2019). Decision support system for agrotechnology transfer (DSSAT) version 4.7.5 (https://DSSAT.net). DSSAT Foundation, Gainesville, Florida, USA
- Hosang, P. R., Tatuh, J., & Rogi, J.E.X. (2012). Analisis dampak perubahan iklim terhadap produksi berasprovinsi sulawesi utaratahun 2013–2030 [Analysis of the climate change impact on rice production of the province of North Sulawesi in 2013-2030]. Jurnal Eugenia, Volume 18(3), 249–256.
- Jones, J. W., Hoogenboom, G., Porter, C. H., Boote, K. J., Batchelor, W. D., Hunt, L. A., … & Ritchie, J. T. (2003). The DSSAT cropping system model. European Journal of Agronomy, 18(3-4), 235-265.
- Lobell, D. B., Schlenker, W., & Costa-Roberts, J. (2011). Climate trends and global crop production since 1980. Science, 333(6042), 616–620. doi:10.1126/science.1204531
- Manzanilla, D. O., Paris, T. R., Vergara, G. V., Ismail, A. M., Pandey, S., Labios, R. V., … Mackill, D. J. (2011). Submergence risks and farmers’ preferences: Implications for breeding Sub1 rice in Southeast Asia. Agricultural Systems, 104(4), 335–347. doi:10.1016/j.agsy.2010.12.005
- O’Neal, M. R., Nearing, M. A., Vining, R. C., Southworth, J., & Pfeifer, R. A. (2005). Climate change impacts on soil erosion in Midwest United States with changes in crop management. CATENA, 61(2–3), 165–184. doi:10.1016/j.catena.2005.03.003
- Perdinan, P., Dewi, P. N. W. S., & Dharma, A. W. (2018). Lesson learnt from Smart Rice Actions in Indonesia. Future of Food: Journal on Food, Agriculture and Society, 6(2), 9-20. Retrieved from http://www.thefutureoffoodjournal.com/index.php/FOFJ/article/view/50
- Rioux, J., San Juan, M. G., Neely, C., Seeberg-Elverfeldt, C., Karttunen, K., Rosenstock, T., … & Bernoux, M. (2016). Planning, implementing and evaluating climate-smart agriculture in smallholder farming systems: The experience of the MICCA pilot projects in Kenya and the United Republic of Tanzania (pp. 112). Rome: FAO.
- Shirsath, P. B., Aggarwal, P. K., Thornton, P. K., & Dunnett, A. (2017). Prioritizing climate-smart agricultural land use options at a regional scale. Agricultural Systems, 151, 174–183. doi:10.1016/j.agsy.2016.09.018
- Singh, U., & Ritchie, J. T. (1993). Simulating the impact of climate change on crop growth and nutrient dynamics using the CERES-Rice model. Journal of Agricultural Meteorology, 48(5), 819–822. doi:10.2480/agrmet.48.819
- Sumaryanto, S. (2012). Strategi peningkatan kapasitas adaptasi petani tanaman pangan menghadapi perubahan iklim [Strategy to enhance adaptive capacity of food crop farmers in responding to climate change]. Jurnal Forum Penelitian Agro Ekonomi, 30(2), 73–89.
- Steduto, P., Hsiao, T. C., Raes, D., & Fereres, E. (2009). AquaCrop-The FAO crop model to simulate yield response to water: I. concepts and underlying principles. Agronomy Journal, 101(3), 426–437. doi:10.2134/agronj2008.0139s
- Syaukat, Y. (2011). The impact of climate change on food production and security and its adaptation programs in Indonesia. Journal of ISSAAS, 17(1), 40–51.
- Tsuji, G. Y., & Balas, S. (1993). The IBSNAT decade: Ten years of endeavor at the frontier of science and technology. In G. Y. Tsuji, & S. Balas (Eds.), International Benchmark Sites Network for Agrotechnology Transfer. Department of Agronomy and Soil Science. College of Tropical Agriculture and Human Resources. University of Hawaii, Honolulu, Hawaii.
- Tsuji, G.Y., Hoogenboom, G., & Thornton, P.K. (1998). Understanding options for agricultural production. (SAAD, Vol. 7). Springer Science & Business Media. doi:10.1007/978-94-017-3624-4