Climate resilience of farming systems in steep mountain terrain of selected regions in South Asia
Keywords
Climate resilience · Farming systems · Hilly areas · South Asia · Steep terrain
Highlights
- Adaptation capacity of farming systems mainly determines their climate resilience.
- Climate Resilience Index (CRI) of farming systems varies with geographical origin.
- CRI is an effective tool to decide on a sustain- able solution to combat climate change.
1. Introduction
Changing climate with extreme and unpredictable weather events has significant impacts on regional, national, and local developmental efforts. With added challenges to the developing countries in their development interventions, the impact of climate change goes beyond specific sectors, geographic areas, communities and ecosystems. The agricultural or farming systems are extremely vulnerable to climate change (Pound, Lamboll, Croxton, Gupta, & Bahadur, 2018) as they are sensitive to variations in temperature, precipitation and occurrence of natural events and disasters such as droughts and floods, thus, directly impacting the economy, food security and development. In South Asia, most of the population is predominantly dependent on agriculture as a source of livelihood. Mountain environments in South Asia, especially the steep terrain areas, appear among the most severely affected ecosystems, where any change in temperature and precipitation patterns at all scales would result in serious impacts on such ecosystems (Fort, 2015). Therefore, mountain agriculture is increasingly vulnerable to climate change (FAO, 2019).
Mountains occupy 22% of the world’s surface, and 1/3 of the world’s mountains are found in Asia. With a vast area of the land surface, developing an efficient agriculture or farming system for mountain areas is vital and has become a frequent topic of concern (FAO, 2019). This is especially due to the livelihood of large segments of mountain populations depends heavily on agriculture. However, several constraints, including undulating topography, small fragmented and scattered land holdings with limited use of inputs, high proneness to soil erosion and degradation due to slope, shallow and stony soils subjected to periodic water stress, rainfed agriculture, and natural hazards, make agriculture in steep terrain a challenging task (Fatima & Hussain, 2012). Hence, there is a need for an integrated, multidisciplinary and holistic approach to address those issues to improve the climate resilience, livelihoods of mountain people and to reverse the declining trend of productivity and loss of biodiversity in the traditional mountain ecosystems (Li, Solh, & Siddique, 2019).
Building climate resilience in production systems is required to sustain agricultural productivity (Aryal et al., 2020; Marambe et al., 2015)and to minimize the impacts on existing and future food production systems (Gregory, Ingram, & Brklacich, 2005; Schmidhuber & Tubiello, 2008; Tran, Tran, & Tuan, 2012). Adaptation is recognized as important in reducing vulnerability or increasing resilience to climate change (Engle, Bremond, Malone, & Moss, 2013; Marambe et al., 2018; Mendelsohn, 2008). Decision-makers and development practitioners need to understand the climate vulnerabilities in order to reduce the potential impacts of climate change on the people, sectors, and places that they care about (USAID, 2016). Therefore, there is a growing need for approaches and concepts to assess climate vulnerability, adaptation and resilience and to monitor the progress in achieving resilience at the national, sub-national and regional levels (Welle, Witting, Birkmann, & Brossmann, 2014). Though there are many studies on assessing the agriculture systems for climate resilience (Bizikova, Waldick, & Larkin, 2017; Speranza, 2010; Tui, Descheemaeker, Masikati, Valdivia, & Antle, 2016) only a limited number of studies (Chitale, Gibert, Bhuchar, Capizzi, & Ling, 2017; Fort, 2015; Lama & Devkota, 2009; Tsering, Sharma, Chettri, & Shrestha, 2010) have focused on the hilly areas, especially the steep terrains.
Identification of the best-suited farming practices, which could be recommended for steep terrains in mountain areas of South Asia to minimize resource degradation and to ensure environmental sustainability while enhancing climate resilience, was considered a vital and urgent requirement. With this broader perspective, this study attempted to evaluate existing farming practices in steep terrains in the mountain areas in three countries in South Asia and to use an indicator approach to assess their level of climate resilience. The outcome is expected to support policy formulators, stakeholders, and administrators in identifying suitable agricultural production systems in the already climate-vulnerable steep terrains in the respective countries through appropriate adaptation strategies.
2. Methodology
2.1 Site selection
Study sites were selected in mountain regions in Sri Lanka, Nepal and Bangladesh with a slope of 30% or above, located at a representative elevation range of 300 m to 1,800 m above mean sea level. The site selection was based on the availability of different farming systems such as crop, livestock and fish farming, forest, and availability of historical information on disaster for the past ten years and climate data for the past two decades. The short term data for natural disasters and climate parameters were considered based on the availability and reliability of data across sites and based on expert consultation. Further, easy access to the sites and the willingness of households in the area to support the project activity were also considered based on the initial discussion. Two sites were selected from Sri Lanka; namely, Welimada (06˚56’0” to 06˚57’10” N and 80°51’0” to 80°53’0” E) and Hatton (06˚46’25” to 06˚47’10” N and 80°42’20” to 80°43’45” E), and one site each from Chittagong in Bangladesh (which is now officially known as Chattogram; 22°07’20” to 22°09’30” N and 92°12’40” to 92°13’43” E), and Jhikhu Khola in Nepal (27°35’0” to 27°55’0” N and 85°18’0” to 85°48’0” E). The various farming systems (FS) in the study sites were characterized to support the comparison of data. Each household was considered as a farming system unit (FSU). In order to represent at least 30% of the agrarian population, 96 households from Chittagong, 103 households from Jhikhu Khola, 125 households from Hatton and 100 households from Welimada were selected for the study using random sampling.
2.2 Data collection
A pre-tested questionnaire translated into respective local languages was used to collect primary data, namely, basic information, socioeconomic characteristics, plant and animal inventory in the farming system, water and soil conservation strategies and crop management adopted in the farming system, land-use patterns in the farming system, climate change adaptation strategies in the farming system, food consumption pattern, income and expenditure of the household, market, and enumerator’s observation. A database was constructed based on survey results. Secondary data were collected for the past two decades from relevant local and national administrative services on productivity and soil erosion, soil fertility status, land degradation status, rainfall and temperature, human-health related issues, pest outbreaks in crops, and animal species reared. Data on system changes and the occurrence of natural disasters were collected for the past decade.
2.3 Analytical framework
Details in the database were initially analyzed to check the differences among four study sites and to identify the characters of different farming systems such as use of crop varieties and animal breed, resource utilization, irrigation methods, integrated farming practices, fertilizer usage, cropping pattern, pest and disease management, etc. Analysis of variance (ANOVA) was done for continuous variables (cultivated extent, age, living period, income, expenditure), and Chi-Square tests were performed using percentages and frequencies for the nominal and ordinal data in order to test the differences among four sites.
2.3.1 Indicator approach
The construction of an index based on specific sets or combinations of parameters, which serve as proxies, is a commonly used quantitative approach to assess climate resilience. The parameters were selected to capture the current status of the system with respect to climate resilience in selected mountainous areas.
Normalization of parameters
Parameters used in the study were measured in different scales and units. Therefore, normalization of parameters was done to obtain values ranging between 0 and 1 that are free from units and comparable. Before the values were normalized, the functional relationship between the parameters and the climate resilience were determined from previous studies or based on the theoretical assumptions as stated in Table 1.
If resilience increases with an increase in the value of the parameter (positive correlation), resilience has a positive functional relationship. Then normalization was carried out by using Equation 1, developed according to the Min-Max method described by (OECD, 2008).
where Xij is the znormalized value of parameter (j) with respect to household (i), Xi is the actual value of the parameter with respect to household (i), and Min {Xj} and Max {Xj} are the minimum and maximum values, respectively, of parameter (j) among all the households.
If the functional relationship with resilience was negative, i.e. the resilience decreases with an increase in the value of the parameter (negative correlation), the normalized score was computed using Equation 2, developed according to the Min-Max method described by OECD (2008).
Climate Resilience Index
As defined by the Intergovernmental Panel on Climate Change (IPCC, 2007), climate resilience is the ability of a social or ecological system to absorb disturbances while retaining the same basic structure and ways of functioning, the ability of self-organization, and the capacity to adapt to stress and changes. According to Welle et al. (2014), climate resilience is the combination of absorptive, adaptive and transformative capacities.
Aligning with the definition provided by IPCC, a Climate Resilient Index (CRI) was developed to assess the capacity of the community to reach and maintain an acceptable level of functioning with ongoing climate change and variability using 31 parameters. To better understand resilience, the parameters selected for CRI were aggregated into three resilience capacities: Adaptive Capacity (ADC; 18 parameters), Absorptive Capacity (ABC; 9 parameters), and Transformative Capacity (TC; 4 parameters), and their description and the hypothesized relationship with the climate resilience are presented in Table 1. In order to accomplish a good validity and provision for cross-comparison, parameters were selected based on the literature available for situations similar to the present study and expert opinion followed by correlation analysis.
Normalised parameters were aggregated into respective resilience capacities to generate the CRI using Equation 3:
where CRIi is the climate resilience score, ADCi is the value of adaptive capacity, ABCi is the value of absorptive capacity, and TCi is the value of transformative capacity concerning i th household. The NADC, NABC and NTC are the number of parameters in adaptive capacity, absorptive capacity, and transformative components, respectively.
Values for ADC, ABC and TC were calculated using Equations 4, 5 and 6, respectively. Equal weight was assigned for each parameter to make it simple in approach and interpretation.
where ADCi is the value for adaptive capacity with respect to household (i) and ADCij is the value of the j th parameter of adaptive capacity with respect to the i th household.
where ABCi is the value for absorptive capacity with respect to household (i) and ABCij is the value of the j th parameter of absorptive capacity with respect to i th household.
where TCi is the value for transformative capacity with respect to household (i) and TCij is the value of the j th parameter of transformative capacity with respect to i th household.
Values of CRIi were calculated separately for each of the 424 households of each site and pooled to have a systems approach. Based on the maximum and minimum values of CRIi, cut-off points of the five resilience levels, namely, least, less, moderate, high and very-high, were determined using the Equal Interval Classification method (Osaragi, 2008). The percentage of households in each category was computed separately for each study site and those details were used for within site and among sites comparisons. The study sites were mapped for climate resilience based on the values calculated for each household, using the Inverse Distance Weighted (IDW) interpolation algorithm of Geographic Information Systems (GIS) to examine the spatial representation of the results of the index.
As the majority of the parameters comprised categorical data (only four parameters out of 31 parameters were continuous), the traditional Principle Component Analysis (PCA) was not used to reduce dimensionality and in finding the contribution from each parameter. Therefore, the contribution of each parameter for CRI of the respective study site was calculated based on the average contribution of the households’ responses of the corresponding parameter for each study site separately. As the average value of each parameter ranged between 0 and 1, based on the equal interval classification, the parameters having average values between 0.0–0.33 were considered as least contributing, between 0.34–0.66 were considered as moderately contributing and 0.67 to 1.0 were considered as most contributing to the CRI in the respective study site.
| Capacity | Components of climate resilience | Parameters selected for analysis | Description of parameters | Type of Data | Hypothesized relationship between parameter and climate resilience | ||
| Adaptive Capacity | Socio- Demography | Gender of the household head | Whether the household is a male or female | Categorical (Male, Female) |
Households with female head, lower the resilience (Asmamaw, Mereta, & Ambelu, 2019; Fuller & Lain, 2019) | ||
| Dependent household head | Household heads older than 65 years | Categorical (Whether the household head is older than 65 years or not) |
Households with dependent Household head, lower the resilience (Asmamaw et al., 2019) | ||||
| Condition of the house | Based on the construction materials of the walls, roof and the floor | Categorical |
Poorly constructed houses lower the resilience (Tran et al., 2012) |
||||
| Education | Educational level | Whether the household head has completed primary, secondary or post-secondary education | Categorical (Education level: No schooling, Primary, Secondary, post-secondary) |
Household heads with no formal education, lower the resilience (Abdul-Razak & Kruse, 2017) | |||
| Economy | Property regime | Availability of own land | Categorical (Yes, no) |
Households that do not own private land, lower the resilience (Ali & Erenstein, 2017; Asmamaw et al., 2019; Roth, 2013) | |||
| Income sources | Diversified income sources | Descrete (No. of income sources) |
Having more than one income source, higher the resilience (Abdul-Razak et al., 2017; Asmamaw et al., 2019) | ||||
| Household employment | Whether the members of households are employed or not | Descrete (No. of employed members in the household) |
Any member of household is not employed, lower the resilience (Jamshidi, Asadi, Kalantari, Azadi, & Scheffran, 2019; Opiyo, Wasonga, & Nyangito, 2014; Zurovec, Cadro, & Sitaula, 2017) | ||||
| Savings | Ratio of income and expenditure | Continuous (Ratio of income and expenditure) |
Households with little or no savings, lower the resilience (Botero & Salinas, 2013; Silva, Kawasaki, & A, 2018; Sverdlik, Mitlin, & Dodman, 2019) | ||||
| Dependence on agriculture | Percentage of agriculture base income | Continuous (Percentage of agriculture base income) |
Households that depend on agriculture as the major source of income, lower the resilience (Botero et al., 2013; Laitae, Praneetvatakul, & Vijitsrikamol, 2014) | ||||
| Animal Husbandry | Practising of animal husbandry | Whether the household is practising animal husbandry | Categorical (Yes, no) |
Practising of animal husbandry, higher the resilience (FAO, 2020) | |||
| *Diversity of Species | No. of animal species | Descrete (No. of animal species) |
Have more than one species, higher the resilience (Rojas-Downing, Nejadhashemi, Harrigan, & Woznicki, 2017) | ||||
| *Animal breed | Whether animals are hybrid, cross bread or indigenous | Categorical (hybrid, cross bread, indigenous) |
Have hybrid breeds, lower the resilience (Ahmed, Alam, Al-Amin, & Hassan, 2013; Rahim, Saleem, Rueff, & Maselli, 2013) | ||||
| *System of animal rearing | Whether animals are rearing as extensive, intensive or semi-intensive system | Categorical (Extensive, intensive and semi-intensives) |
Practicing of extensive system for animal rearing, lower the resilience (Rust, 2018) | ||||
| *Feeding method | Whether animals are feed with concentrate, cut and fed, free grazing or other | Categorical (Concentrate, cut and fed, free grazing or other) |
Feeding animals with concentrate feeds, higher the resilience (Chaidanya et al., 2015) | ||||
| Awareness | Farming knowledge | Years of experience in farming | Continuous | lower the farming experience, lower the resilience (Abdul-Razak et al., 2017) | |||
| awareness about the area | Living period in the area in years | Continuous | lower the living period, lower the resilience (Opiyo et al., 2014) | ||||
| Climate change | Noticed the changes in climate | Categorical (Yes, no) |
Having noticed the changes in climate, higher the resilience (Opiyo et al., 2014) | ||||
| Changes in farming system | Noticed the changes in farming system | Categorical (Yes, no) |
Having noticed the changes in farming system, higher the resilience (Tripathi & Mishra, 2017) | ||||
| Food | food from own cultivation | Whether households consume food from animal husbandry | Categorical (Yes, no) |
Consuming food from own cultivation, higher the resilience (FAO, 2015) | |||
| food from animal husbandry | Whether households consume food from their cultivations | Categorical (Yes, no) |
Consuming food from animal husbandry, higher the resilience (FAO, 2020) | ||||
| Sanitation | Improved toilets | Type of toilet | Categorical (Septic tank, sewerage system, open pit, outside land, other) |
Having improved toilets, higher the resilience (Sherpa, Koottatep, Zurbrügg, & Cissé, 2014) | |||
| Absorptive Capacity | Technology utilization | Diversity of crops | No. of crops cultivated | Descrete (No. of Crops cultivated) |
Having cultivated more than three crops, higher the resilience (Lin, 2011; Rojas-Downing et al., 2017) | ||
| Cropping System | Whether cultivated as sole crop or mixed cropping | Categorical (Sole crop, mixed crop) |
Cultivated as sole crop, lower the resilience (Lizarazo, Tuulos, Jokela, & Mäkelä, 2020) | ||||
| Cultivated variety | Cultivated variety | Categorical (Hybrid, local) |
Cultivated hybrid varieties, lower the resilience (Abewoy, 2018; Negi, 1994) | ||||
| Fertilizer management | Type of fertilizers used in the cultivation | Categorical (Organic, inorganic, both organic and inorganic) |
Using organic fertilizers, higher the resilience (Müller, 2009; Niles, 2008) | ||||
| Irrigation Potential | Cultivation under irrigation | Sources of water for agricultural activities | Categorical (Rainfed, irrigated, both rainfed and irrigated) |
No potential for irrigation, lower the resilience (Abdul-Razak et al., 2017) | |||
| Ecological Stability | Presence of naturally grown plants | No. of naturally grown plants available | Descrete (No. of naturally grown plants available) |
Presence of naturally grown plants, higher the resilience (Cleland, 2011) | |||
| Presence of woody trees | No. of woody trees available | Descrete (No. of woody trees available) |
Presence of woody trees, higher the resilience (Akinnagbe & Irohibe, 2015; Mosquera-Losada, Borek, Balaguer, Mezzarila, & Ramos-Font, 2017) | ||||
| Soil and water conservation | Practising of soil and water conservation methods | Categorical (Yes, no) |
Practising of soil and water conservation methods, higher the resilience (Akinnagbe et al., 2015; Jamshidi et al., 2019) | ||||
| Slope of the land | Whether the land is flat, undulating, moderate slope or steep slope | Categorical (flat, undulating, moderate slope and steep slope) |
lower the slope, higher the resilience (Asmamaw et al., 2019) | ||||
| Transformative Capacity | Infrastructure | Availability of storage facilities | Whether households have storage facilities | Categorical (Yes, no) |
Having storage facilities, higher the resilience (Williams, Crespo, & Abu, 2018) | ||
| Access to basic public services | Distance to market | Categorical (Market distance is <1 km, 1-5 km, 5-10 km, >10 km) |
Higher the distance to market, lower the resilience (Williams et al., 2018) | ||||
| Social capital | Presence of middleman | Presence of middleman when marketing their products | Categorical (Yes, no) |
Presence of middleman, lower the resilience (Scott, Archer, Monteith, & Gawler, 2017) | |||
| Hired labour | No. of hired labour used in farming activities | Descrete (No. of hired labours) |
Use of hired labour, lower the resilience (Fagariba, Song, & Baoro, 2018) | ||||
Table 1. The 31 aggregated parameters selected for climate resilience index with their hypothesized relationship to climate resilience.
3. Results
3.1 Characteristics of farming systems
A Farming System (FS) consists of a set of organized conditions for the production of crops, livestock, fish, agroforestry, etc., and includes the procedure of using the land, labour, inputs, and capital to manage farm, household, non-farm and off-farm production, and consumption to meet its objectives and priorities under a certain physical, biological and socioeconomic conditions. The FSs varies with available natural resource base including water, land, grazing areas and forest, climate, landscape including slope, farm size, tenure and organization. Furthermore, different FSs could be identified based on the dominant pattern of farm activities and household livelihoods, including crops, livestock, trees, aquaculture, hunting and gathering, processing and off-farm activities, main technologies used, the intensity of production and integration of crops, livestock and other activities.
In all four study locations, the majority of the household heads (HHs) were males. Hatton site in Sri Lanka had the highest percentage of female household heads (21%), while it ranged from 2% to 8% in other study locations. A higher proportion of elderly HHs (≥ 65 years) were reported in Welimada (17%), followed by Hatton (12%), Jhikhu Khola (11.7%) and Chittagong (6.3%). Furthermore, more than 60% of HHs in Hatton were below 50 years, which could be due to their early marriages compared to other study sites. The HHs were categorized into three education categories as no schooling, primary education (grade 1 to 5) and secondary education and above (grade 6 to advanced level was considered as secondary education and diplomas, degrees, etc., were considered as post-secondary education). The summary of the education levels of HHs in four locations is shown in Table 2.
|
Education level |
Bangladesh |
Nepal |
Sri Lanka |
|
|
Chittagong (%) |
Jhikhu Khola (%) |
Hatton (%) |
Welimada (%) |
|
|
No schooling |
62.5 |
25.7 |
12.8 |
3 |
|
Primary education |
24 |
53.5 |
83.2 |
86 |
|
Secondary education or above |
13.5 |
20.8 |
4 |
11 |
Table 2. Percentage of household heads in each education category of Chittagong in Bangladesh, Jhikhu Khola in Nepal, and Hatton and Welimada in Sri Lanka (Source: Survey data; N = 424).
Farming was the primary employment of all HHs in the study sample of Jhikhu Khola, and the majority in Chittagong (98%) and Welimada (96%), while the majority in Hatton (67%) were day-labourers of tea estates. In Chittagong, approximately 96% of respondents cultivated only in the summer season (Kharif I: May–June; pre-monsoon, and Kharif II: July–October (monsoon rains) and were full-time farmers under rainfed systems. Due to the unavailability of sufficient water and unfavourable climatic conditions, the respondents in Chittagong did not cultivate in the Rabi season (winter season with no or little rainfall; November-April). About 95% of the farmers in Jhikhu Khola cultivated crops during the monsoon season (June-September), post-monsoon season (October-November), and the winter season (December-February). In the two sites in Sri Lanka, nearly 98% of the farmers cultivated during both growing seasons, i.e. Yala season (March-April with First Inter-monsoon and May-September with South West Monsoon) and Maha season (October-November with Second Inter-monsoon and December-February with North East monsoon).
All interviewed households in Chittagong used hired labour in at least one of the cultivation types (home garden and upland) and at least in one season. The households in Hatton did not use hired labour for any type of cultivation in both seasons. As the cultivated extent of HHs in Hatton was smaller, they did not require hired labour and cultivation was managed using family labour. The majority of households in Welimada (92%) and Jhikhu Khola (91%) were using hired labour.
The average cultivated extent of Hatton was very low (89.8 ± 76.04 m2) compared to Chittagong (20,084.4 ± 15,148.3 m2), Welimada (16,530.23 ± 9,461.5 m2) and Jhikhu Khola (3,021.07 ± 1,756 m2). A high proportion in Chittagong (97%), Welimada (95%) and Hatton (61 %) practised mixed-cropping while in Jhikhu Khola, a higher proportion (67%) practised sole cropping with paddy as the main crop in valleys. All the respondents in Welimada, 79% in Chittagong, 30% in Jhikhu Khola and 27% in Hatton cultivated high yielding hybrid crops. About 97% of the households in Chittagong used synthetic fertilizer in their cultivations and no household in the study site opted for integrated fertilizer usage (synthetic + organic fertilizers), while 71% in Welimada used only synthetic fertilizers. Integrated fertilizer management was practised by 45% in Jhikhu Kola, 75% in Hatton and 20% in Welimada.
About 99 % of Chittagong interviewees used rainfed cultivation both in home garden systems and upland cultivation. All Interviewees in Hatton cultivated both rainfed and irrigated lands and did not have lowlands to cultivate. In Jhikhu Khola, a higher proportion of interviewees cultivated their home gardens and uplands only as rainfed, while the majority of the lowlands were rainfed and irrigated. In Welimada, the majority of the home gardens were only rainfed, while lowlands and uplands were rainfed and irrigated.
The majority of households in Jhikhu Khola (98%) and Chittagong (62.5%) reared animals, while only 38% in Hatton and 24% in Welimada did animal farming. Among animal rearing households in Chittagong, 98% of the interviewees reared poultry while 8% reared cattle and 30% swine. The majority of households in the other three locations reared cattle rather than poultry. Goat farming was observed in Jhikhu Khola and Hatton. Species diversity among animal-rearing households in each location is illustrated in Figure 1. Among the farm animal-rearing households, 83% in Welimada, 38% in Hatton, 12% in Jhikhu Khola and 3% in Chittagong reared high yielding hybrid cattle/swine/poultry.
All interviewed households in Chittagong, Hatton and Welimada, and 70% of interviewed households in Jhikhu Khola did integrated farming. In Chittagong, around 55% of the households had paddy and Other Food Crops (OFCs) such as cereals, vegetables and fruit in their uplands, while the rest of households had different combinations of paddy, OFCs, tree crops, farm animals and aquaculture (Table 5). The majority of those in Jhikhu Khola had paddy + OFCs + farm animals in their farming systems. In Hatton, 62% had OFCs integrated with tree crops (perennials) while the rest had OFCs, tree crops and farm animals in their farming systems. In Welimada, the majority (67.7%) had integrated paddy + OFCs, 22% had paddy + OFCs + animal, and 10% practised different combinations of paddy, OFCs, tree crops, farm animals, and aquaculture.
|
Type of Integrated Farming |
Bangladesh |
Nepal |
Sri Lanka |
|
|
Chittagong |
Jhikhu Khola |
Hatton |
Welimada |
|
|
(%) |
(%) |
(%) |
(%) |
|
|
Paddy + Food crops |
55.2 |
4.1 |
– |
67.7 |
|
Paddy + Animal |
– |
2.7 |
– |
– |
|
Paddy + Food crops + Animal |
– |
86.3 |
– |
22.2 |
|
Paddy + Animal + Aquaculture |
– |
5.5 |
– |
– |
|
Other |
44.8 |
1.4 |
– |
10.1 |
|
Food Crops + Tree Crops |
– |
– |
62.4 |
– |
|
Food Crops + Tree Crops + Animals |
– |
– |
37.6 |
– |
Table 3. Percentage of households who practice different integrated farming methods at Chittagong in Bangladesh, Jhikhu Khola inNepal, and Hatton and Welimada in Sri Lanka (Source: Survey data; N = 424).
The highest average household income and expenditure was reported in Welimada and the lowest in Jhikhu Khola (Table 4).
|
Location |
Average Income |
Average Expenditure (USD / Month) |
|
|
(USD / Month) |
|||
|
Bangladesh |
Chittagong |
207.5 ± 134.5a |
151.84 ± 89.99b |
|
Nepal |
Jhikhu Khola |
201.7 ± 163.1a |
145.43 ± 86.05b |
|
Sri Lanka |
Hatton |
221.66 ± 105.95a |
171.24 ± 76.59b |
|
Welimada |
255.7 ± 199.5a |
241.1 ± 237.7a |
|
Table 4. Average monthly income and expenditure of the households of Chittagong in Bangladesh, Jhikhu Khola in Nepal, and Hatton and Welimada in Sri Lanka (Source: Survey data; N = 424). Note: Within a column, means followed by the same letters are not significantly different at p = 0.05.
Almost all the households in each location marketed their products, while only 2% of Jhikhu Khola households did not market their products. In Chittagong, the distance to market was 5-10 km for 67% of the households and >10 km for the rest. In Jhikhu Khola, all households had to travel <10 km distance to reach markets, and among them, 56% travel <1 km distance. In Hatton, too, the majority (36%) had to travel <1 km to reach the markets, the lowest proportion (9%) travelled 5-10 km distance, and nearly equal proportions travelled 1-5 km and >10 km to reach the markets. Interviewees in Welimada did not have markets within reach of 1-5 km distance from their households. The majority (53%) had markets access at >10 km distance, while 44 % of households had to travel 5-10 km distance to reach markets. Only 3% of households had markets close by (at <1 km distance). The majority of interviewees in Chittagong and Jhikhu Khola and all interviewees in Welimada had the intervention of a middleman in marketing their products, while the majority of the interviewees (94%) in Hatton did not experience the involvement of a middleman when marketing their products. All households in Chittagong and Welimada had their own storage facilities and the majority of the households in Jhikhu Khola (69%) and Hatton (92%) did not have their own storage facilities for their produce.
All interviewees in Hatton and Welimada had septic tanks at their homesteads. In Chittagong, the majority of the households were using other types of toilets such as temporary pits in their own lands and 3% had open pit-type toilets. Using outside land was recorded only in Jhikhu Khola (7%), but 91% had septic tanks.
3.2 Climate Resilience Index
Since climate resilience cannot be measured directly, to explore households’ resilience to climate change and climate change-induced shocks, a climate resilience index (CRI) was developed. The CRIi score ranged between 0 (negligible climate resilience) and 1 (high climate resilience). Each household in this study had a CRI between 0.36 and 0.76. Table 5 shows the average climate resilience scores for each location. Among the four study sites, the average CRI was highest in Hatton, while the lowest was
recorded in Chittagong.
|
Index |
Bangladesh |
Nepal |
Sri Lanka |
|
|
Chittagong |
Jhikhu Khola |
Hatton |
Welimada |
|
|
Climate Resilient Index (CRI) |
0.48 |
0.59 |
0.67 |
0.6 |
Table 5. Average CRI Values of Chittagong in Bangladesh, Jhikhu Khola in Nepal, and Hatton and Welimada in Sri Lanka (Source: Survey data; N = 424).
The cut-off points for each resilience category and percentage of households in the respective resilience category are shown in Table 6.
|
Resilience level |
Cut Off Points |
% of Households in different resilience levels |
|||
|
Bangladesh |
Nepal |
Sri Lanka |
|||
|
Chittagong |
Jhikhu Khola |
Hatton |
Welimada |
||
|
Least Resilient |
0.36 – 0.44 |
18.8 |
1 |
0 |
0 |
|
Less Resilient |
0.44 – 0.52 |
60.4 |
8.7 |
0 |
6 |
|
Moderately Resilient |
0.52 – 0.60 |
18.8 |
39.8 |
11.2 |
40 |
|
Highly Resilient |
0.60 – 0.68 |
2.1 |
43.7 |
46.4 |
51 |
|
Very Highly Resilient |
0.68 – 0.76 |
0 |
6.8 |
42.4 |
3 |
Table 6. The cut-off points for each resilience category and percentage of households in respective resilience category for each site.
The cut-off points of the index are relative measures and this categorization supports comparison of farming systems within and among sites. However, variation among households was observed within the four study sites.
Table 7 shows the average contribution of each parameter used in the study to the CRI, which provides the relative influence of those parameters for climate resilience of each study site.
|
Parameter |
Expression |
Relative Contribution of paramters to CRI |
|||
|
Bangladesh |
Nepal |
Sri Lanka |
|||
|
Chittagong |
Jhikhu Khola |
Hatton |
Welimada |
||
|
Sex of the household head |
Female headed households |
0.01 |
0.04 |
0.11 |
0.08 |
|
Age of the household head |
Presence of dependent household heads |
0.06 |
0.13 |
0.14 |
0.17 |
|
Condition of house |
Do not have proper housing |
0.79 |
0.67 |
0.33 |
0.10 |
|
Educational level |
Household heads with primary education or no schooling |
0.83 |
0.68 |
0.70 |
0.64 |
|
Property regime |
Do not have own lands |
0.33 |
0.17 |
0.67 |
0.22 |
|
Diversified income sources |
Have only one income source |
0.93 |
0.40 |
0.11 |
0.23 |
|
Household employment |
Any member of household is not employed |
0.99 |
0.98 |
0.16 |
0.89 |
|
Income/expenditure |
No savings |
0.86 |
0.83 |
0.86 |
0.86 |
|
Share of income from farming |
Share of income from farming is more than 50% |
0.99 |
0.20 |
0.32 |
0.48 |
|
Practising of animal husbandry |
Do not practice animal husbandry |
0.38 |
0.01 |
0.62 |
0.76 |
|
Species diversity |
Rearing only one animal species |
0.10 |
0.33 |
0.21 |
0.17 |
|
Animal breed |
Rearing Hybrid animals |
||||
|
System of rearing |
Animals are rearing extensively |
||||
|
Method of feeding |
Do not feed concentrate feeds |
||||
|
Experience in farming |
Farming experience in years (Less) |
0.61 |
0.65 |
0.80 |
0.52 |
|
Living period in the area |
Living period in years (Less) |
0.66 |
0.66 |
0.53 |
0.32 |
|
Climate change |
Have not notice the changes in climate |
0.00 |
0.26 |
0.00 |
0.00 |
|
Changes in farming system |
Have not noticed the changes in farming system |
0.00 |
0.17 |
0.00 |
0.06 |
|
Food from own crop cultivation |
Do not consume own products from crop cultivation |
0.08 |
0.00 |
0.00 |
0.00 |
|
Food from animal husbandry |
Do not consume own products from animal husbandry |
0.28 |
0.67 |
0.92 |
0.95 |
|
Type of toilet |
Do not have septic tank or sewerage system type toilets |
0.98 |
0.07 |
0.00 |
0.00 |
|
Crop diversification |
Cultivate less than three crops |
0.10 |
0.02 |
0.17 |
0.00 |
|
Cropping System |
Cultivate as sole crop |
0.00 |
0.64 |
0.39 |
0.15 |
|
Cultivated variety |
Cultivate hybrid varieties |
0.79 |
0.30 |
0.27 |
1.00 |
|
Fertilizer management |
Use inorganic fertilizer only |
0.97 |
0.43 |
0.19 |
0.71 |
|
Water usage in farming system |
Cultivations are only rainfed |
0.99 |
0.49 |
0.00 |
0.30 |
|
Presence of naturally grown plants |
Do not have naturally grown plants |
0.51 |
0.00 |
0.41 |
0.27 |
|
Presence of woody trees |
Do not have woody trees |
0.00 |
0.02 |
0.00 |
0.18 |
|
Following soil and water conservation methods |
Not following soil and water conservation methods |
0.63 |
0.65 |
0.00 |
0.04 |
|
Slope of the land |
Having lands with steep slope |
0.85 |
0.33 |
0.96 |
0.61 |
|
Availability of storage facilities |
Do not have own storage facilities |
0.00 |
0.72 |
0.92 |
0.06 |
|
Access to basic service |
Distance to market is more than 10 km |
0.44 |
0.14 |
0.43 |
0.68 |
|
Presence of middleman |
Middlemen is present |
0.91 |
0.87 |
0.06 |
1.00 |
|
Use of hired labor |
Use hired labors |
1.00 |
0.97 |
0.00 |
0.86 |
Table 7. The relative contribution of each parameter to the CRI Values of Chittagong in Bangladesh, Jhikhu Khola in Nepal, and Hatton and Welimada in Sri Lanka (Source: Survey data; N = 424).
3.2.1 Climate resilience in Chittagong (Bangladesh)
In Chittagong, the majority of households (60.4%) were in the less resilient group and 18.8% each were in the least and moderately resilient groups, respectively. Only 2.1% of the households were in the category of highly resilient, while none of the households were categorized as very-highly resilient. Figure 4 illustrates the spatial distribution of climate resilience in Chittagong. The FSUs in all resilience levels were scattered throughout the study site across different elevations, showing that there is no relationship between elevation and the CRI.
Chittagong was the least climate-resilient site among the four study sites. The parameters that contributed most to Chittagong being the least climate resilient were: household heads with no proper education (0.83), households with only one income source (0.93), presence of unemployed members in the household (0.99), no savings (very low income:expenditure ratio) (0.86), higher income share from farming for livelihood (0.99), lack of proper housing (0.79) lack of proper sanitary facilities (0.98), use of hired labour (1.0), cultivating hybrid crops (0.79), relying only on synthetic fertilizers (0.97), cultivations are only rainfed (0.99), presence of middleman when marketing their produce (0.91), and having land with steep slopes (0.85). The factors that contributed to increasing climate resilience in Chittagong were: having a male household head (0.99) who are not dependents (0.94), having land ownership (0.67), cultivating more than three crops (0.9), having mixed-cropping systems (1.0), implementing good animal husbandry practices (0.90), having storage facilities (1.0), consuming products from own crop cultivations (0.92) and animal husbandry (0.72), having woody trees in their land (1.0), having noticed changes in climate (1.0) and changes in farming systems (1.0).
3.2.2 Climate resilience in Jhikhu Khola (Nepal)
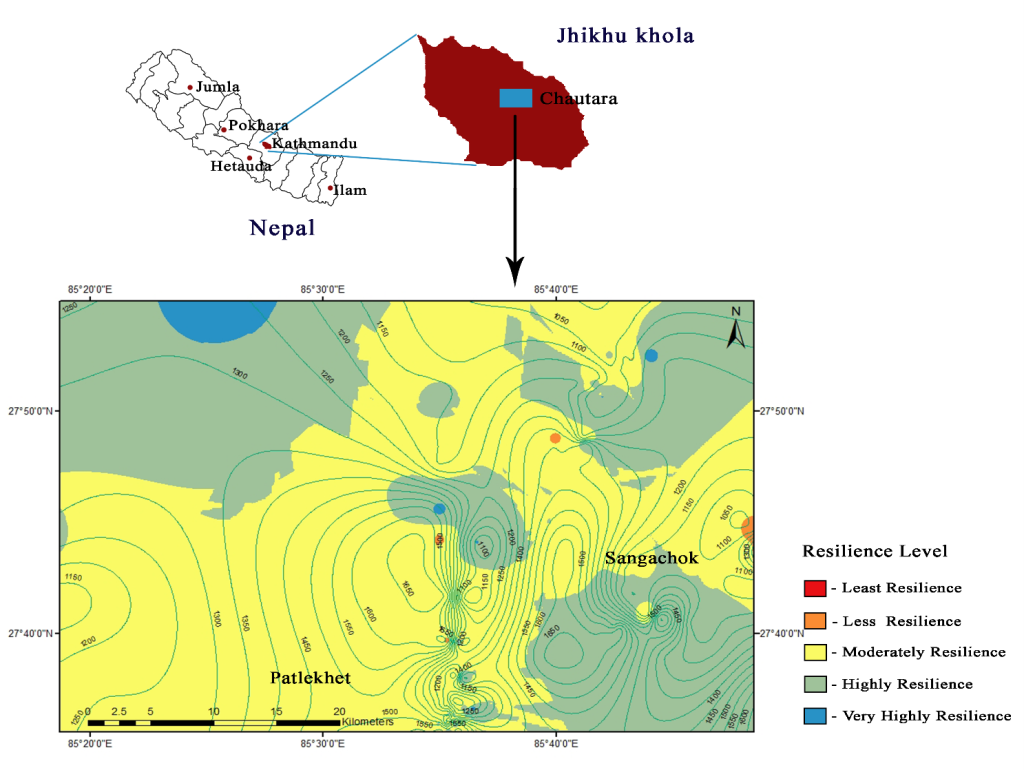
Compared to Chittagong, climate resilience was high in Jhikhu Khola in Nepal. A higher proportion (43.7%) of the households in Jhikhu Khola were in the highly resilient category, followed by 39.8% under a moderately resilient category and 6.8% in the very-highly resilient category. About 8.7% of the households in Jhikhu Khola were the less resilient group, and 1% were least resilient to climate change. The spatial distribution of climate resilience is demonstrated in Figure 4. As FSUs in all resilient levels were scattered throughout the study site, no direct relationship could be established between the CRIi and the elevation of the location of FSUs.
The important factors that have contributed to reducing the climate resilience of FSUs in Jhikhu Khola study site in Nepal were: household heads without proper education (0.68), no members in the household employed with an additional income (0.98), no savings (0.83), absence of storage facilities (0.72) and presence of middleman when marketing their produce (0.87), use of hired labour (0.97), not consuming products from animal husbandry (0.67) and not having proper housing (0.67).
As indicated in Table 9, factors such as male household heads (0.96) who are not dependents (0.87), cultivating more than three crops (0.98), not cultivating hybrid crop varieties (0.7), consuming products from own crop cultivation (1.0), market distance less than 10 km (0.86), presence of naturally grown plants (1.0) and woody trees (0.98), having land ownership (0.83), land that is not steep (0.67), having proper sanitary facilities (0.93), not relying totally on agriculture-based income (0.80), practising farm animal husbandry (0.99), implementing good animal husbandry practices (0.67) and having noticed changes in climate (0.74) and changes in farming systems(0.83) contributed significantly to increased the climate resilience in Jhikhu Khola site.
3.2.3 Climate resilience in Hatton (Sri Lanka)
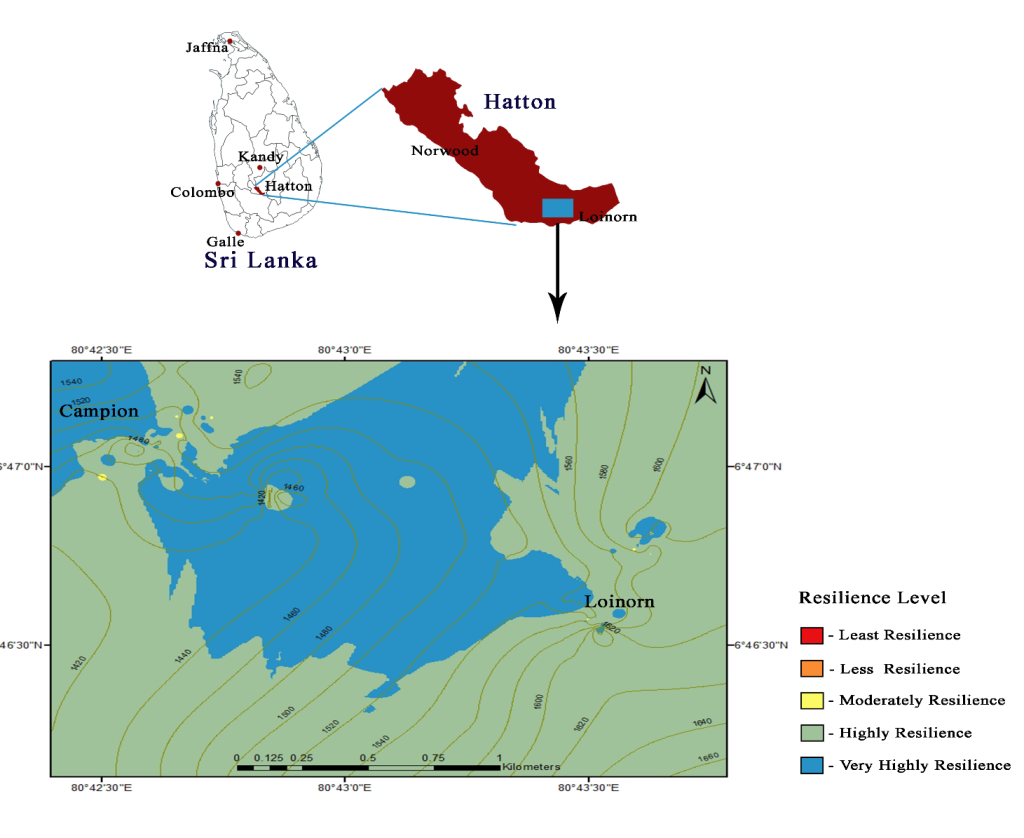
As shown in Table 8, Hatton did not have households that fall into the least or less climate-resilient groups. A higher proportion (46.4%) of the households in Hatton were in the highly climate resilient group, 42.4% were very-highly resilient and 11.2% were moderately resilient. Figure 5 illustrates the spatial distribution of the climate resilience in Hatton, which showed the highest climate resilience among the four locations. Similar to the observation made in the other sites, the elevation among the location of FSUs varied largely. Therefore the level of resilience in the FSUs could not be related to the elevation.
Being the most resilient among the study sites (Table 7), parameters such as presence of male household heads (0.89) who are not dependents (0.86), having more than one income source (0.89), presence of employed members in the household (0.84), not relying totally on agriculture-based income (0.68), cultivating more than three crops (0.83), use of local crop varieties (0.73) and organic fertilizers in their cultivations (0.81), consuming products from own crop cultivation (1.0), not using hired labors (1.0), marketing their products without a middleman (0.94), availability of irrigation facilities (1.0), presence of woody trees in their land (1.0), practicing of soil and water conservation methods (1.0), implementing good animal husbandry practices (0.79), having proper housing (0.67) and sanitary facilities (1.0) and having noticed the changes in climate (1.0) and the changes in farming system (1.0) have contributed to increase the climate-resilience of the FSUs in the Hatton study site, compared to those in Chittagong, Jhikhu Khola and Welimada. However, household heads without proper education (0.70), not having storage facilities (0.92), not consuming own products from animal husbandry (0.92), having landwith steep slopes (0.96), no savings (0.86), not having own land (0.67), and having less experience in farming (0.8) have contributed to reducing the climate resilience of the FSUs of the Hatton study site.
3.2.4 Climate resilience in Welimada (Sri Lanka)
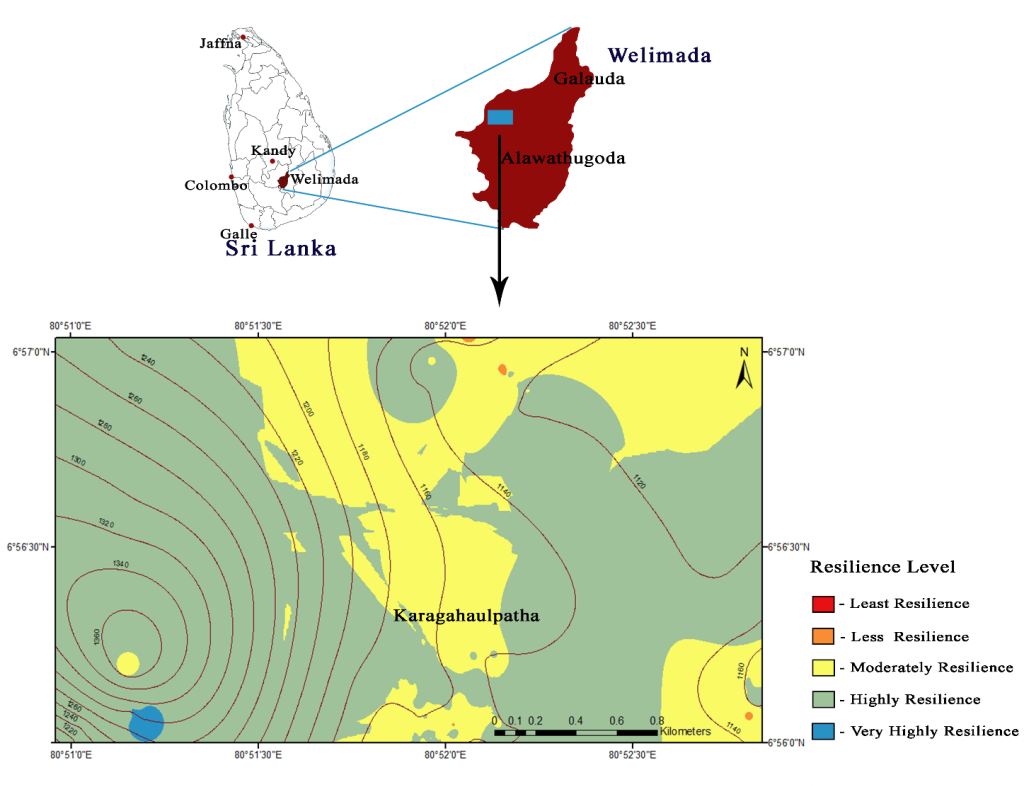
In Welimada, 51% of the households were highly climate resilient, 40% were moderately resilient, 3% were very-highly resilient, while 6% were less resilient. There were no households from the Welimada site that belonged to the least climate resilient group. Figure 6 demonstrates the spatial distribution of the climate resilience in Welimada. The FSUs in all resilience levels were scattered throughout the study site across different elevations, showing that there is no relationship between elevation and the CRI.
As presented in Table 9 parameters such as, presence of male household heads (0.92) who are not dependents (0.83), cultivation of more than three crops (1.0) as mixed cropping (0.85), availability of irrigation facilities (0.70), consuming products from own crop cultivation (1.0), having storage facilities (0.94), presence of naturally grown plants (0.73) and woody trees (0.82) in their land, following soil and water conservation methods (0.96), having land ownership (0.78), proper housing (0.90) and proper sanitary facilities (1.0), having more than one income source (0.77), implementing good animal husbandry practices (0.83), having a higher lifespan in the area (0.68), and having noticed changes in climate (1.0) and changes in farming systems (0.94) have contributed to increasing climate resilience in the Welimada study site. However, unemployed members in the household resulting in no additional income (0.89), no savings (0.86), cultivation of crop hybrids (1.0), using only inorganic fertilizers (0.71), using hired labour (0.86), not practising animal husbandry (0.76) and not consuming products from own animal husbandry (0.95), distance to market is more than 10 km (0.68) and presence of middleman when marketing their products (1.0) are the factors which have contributed to reducing climate resilience in the Welimada study site in Sri Lanka.
4. Discussion
Climate is the primary determinant of agriculture (Berhane, 2018) and climate change affects agriculture and food production through direct effects on production to markets and supply chain infrastructure (Gregory et al., 2005), thus increasing the climate vulnerability of a farming community. The study revealed that female-headed households are more likely to be vulnerable to climate-induced stresses and shocks compared to male-headed households, as the females face gender discrimination with respect to resources, rights, education, income and economic opportunities (Alhassan, Kuwornu, & Osei-Asare, 2018; Opiyo et al., 2014). In this study, HH was considered the decisionmaker of the household. As the education level matters in decision making, a low level of education of HH may lead to reduced resilience. Moreover, households headed by the elderly (above 65 years of age) are more likely to be vulnerable compared to those having younger household heads. Opiyo et al. (2014) reported that elderly household heads are weak in preparing strategies to protect their families against adverse climatic stresses thus making them less climate-resilient.
In the present study, the majority of households in Chittagong, Jhikhu Khola and Welimada had only HH employed, which has led to reliance on agriculture as the main source of livelihood. In Hatton, the majority of the respondents are day labourers of tea estates and the income from the job was the main source of livelihood. In general, households with a diversity of income sources are less vulnerable and are able to quickly recover against climate change-induced shocks than those who are solely dependant on a single source of income (Akinnagbe et al., 2015; Asmamaw et al., 2019). When climate change affects income sources, financial stability of a household is challenged. Moreover, extreme climate events affect food production and availability, hence trigger food price hikes and affect the earnings of poor people (Gregory et al., 2005), making them more vulnerable.
The households selected in this study who had multiple income sources, large asset holding and strong social capital were more resilient to climate-induced shocks than the rest.Iqbal, Ahmad, and Rafique (2015) reported that households with more than one income source would have added advantages in terms of increased purchase power in a changing climatic scenario. Compared to Chittagong, the majority of the respondents in the other three locations had more than one income source and did not rely totally on agriculture-based income resulting in comparatively high climate resilience. If the households are able to save more, it would help in allocating more finances for food purchases and other basic needs in emergencies due to climate change. As explained by Asmamaw et al. (2019), there is a positive and direct association of diversity of income sources with resilience.
High yielding crop varieties are more sensitive to changes in climate and susceptible to climate-induced pest and disease attacks, etc. (Abewoy, 2018; Negi, 1994). Hence, cultivating high yielding hybrids have contributed to increasing the vulnerability in Chittagong and Welimada. The development of tolerance of crop hybrids to excess soil moisture, drought, and pest and disease incidences will be helpful to overcome the impacts of climate change with more adaptability, thus increasing resilience. The sensitivity of different crops to climate change will vary. The presence of different crop categories in a farming system could reduce crop failures in a changing climate (Iqbal et al., 2015) thus, increasing resilience. In all study sites, the majority of the respondents cultivated more than three crops, thus contributing to increased climate resilience.
The practice of farm animal husbandry and the presence of diversified food and income sources (FAO, 2020; Sansoucy, 1995) have been identified to increase climate resilience. In Chittagong and Jhikhu Khola, the majority of households practised animal husbandry, thus increasing their resilience to climate-induced shocks. However, the number and diversity of animals would critically impact their economic returns (Rojas-Downing et al., 2017). Compared to high-productivity breeds, indigenous breeds are more resistant to locally prevailing diseases and ensure higher survival rates, minimizing expenditures for veterinary services, better tolerate the weather extremes and periods of feed scarcity, and can survive on low-quality forage (Ahmed et al., 2013; Rahim et al., 2013). As stated by Hidosa and Guyo (2017), climate change is expected to affect livestock feed in terms of quality and quantity. Hot and dry seasons have induced the greatest reduction in biomass yield for different types of grass-growing in low land environments resulting in low feed availability. In the changing climate scenario, nutritional stress act as the most important indirect stress affecting livestock, leading to decreased performance (Chaidanya et al., 2015). Hence, in the changing climatic scenario, the livestock needs to be protected against the adverse effects of environmental stresses to maintain production and performance by providing optimum nutrition, proper management practices and health care. Grazing animals in arid and semiarid regions are generally subjected to periods of under-nutrition during extreme hot environments due to non-availability of feed and poor pasture conditions caused by lower availability of nutrients, which in turn results in low productivity. Feeding concentrates (Hidosa et al., 2017) and intensive rearing of livestock (Rust, 2018) are increasing resilience to climate change.
Consumption of own products from cultivation and animal rearing could reduce the expenditure on food purchase of a household, thus lowering the food insecurity (FAO, 2015; FAO, 2020). The results of the present study clearly indicated that consumption of products from the own crop cultivations has contributed to increasing climate resilience in all study sites. With the availability of proper storage facilities, farming households would store the farm products for extended usage, as well as to obtain better prices for their farm products (Jobbins & Henley, 2015), facilitating the increase in food availability and income thus, leading to lower vulnerability. In Chittagong and Welimada, this was one of the contributing factors to enhance climate resilience. It is important to note that majority of the households in Jhikhu Khola and Hatton did not have storage facilities, despite having higher resilience. Hence such interventions would help farming households increase their level of climate resilience.
The misuse of synthetic fertilizers has led to several issues, such as leaching losses, resulting in lower land productivity. Increased application of organic manures/fertilizers would enhance soil organic matter (and thus soil organic carbon) content and improve soil structure (Müller, 2009), increasing soil biological activity, maintaining long-term soil fertility, reducing nutrient losses from synthetic fertilizers, and promoting a healthy soil environment, while minimizing environmental pollution. The combined use of synthetic and organic fertilizers would thus enhance the fertilizer and nutrient use efficiency thereby enhancing crop/land productivity and reducing climate vulnerability. In Chittagong and Welimada, the majority of the households used synthetic fertilizers, with minimum use of organic manure/fertilizers, thus reducing climate resilience.
Farming systems located on steep slopes with infertile land and minimum effort made for soil and water conservation are less resilient to shock impacts (Asmamaw et al., 2019). Furthermore, the adoption of soil and water conservation measures would lead to quick recovery from the adverse impacts of erosion (Akinnagbe et al., 2015; Jamshidi et al., 2019). In Chittagong and Hatton, steep land was one of the most contributing parameters to increase climate vulnerability. However, the majority of households in both these sites practised soil and water conservation measures, thus increasing their level of climate resilience. Moreover, households with land ownership are more likely to invest in land, soil and water conservation, and thus, are more likely to bounce back quickly against climate-shock impacts (Ali et al., 2017; Asmamaw et al., 2019; Roth, 2013).
Proper sanitary facilities is one of the health concerns and lack of improved sanitation is known to increase the risk of transmission of diseases under climate shocks (Schnitter et al., 2019). With a projected increase in extreme rainfall events (Punyawardena & Premalal, 2013) and increasing climatic hazards (e.g. floods), the study sites could be experience increased transmission of human diseases owing to high vulnerability. The presence of naturally grown plants and woody vegetation in agricultural lands facilitate temperature stability and reduce the impact of extreme heat and the potential of ammonia and nitrous oxide volatilization, and thus, greenhouse gas (GHG) emissions. Furthermore, such plant cover will help in nutrient recycling from agricultural land, improve land productivity and water retention and be associated with higher biodiversity, which increases climate resilience (Cleland, 2011; Mosquera-Losada et al., 2017).
The proportion of vulnerable people increases with elevation in mountain ecosystems (Huddleston et al., 2003) . Further, species in high altitude areas are found to be more vulnerable to climate change (Tsering et al., 2010). In the present study, irrespective of the elevation, highly and less resilient households could be found (Figure 5; Figure 4; Figure 3). Further, it was found that there is no correlation between elevation and CRIi. This scattered distribution clearly demonstrates that the resilience to climate change does not depend on the elevation. The results of the present study also revealed that there are diverse levels of integrations of crops, livestock, agroforestry, etc., in the farming systems of mountain ecosystems in all study sites. Strategies such as crop selection according to agroecology, crop diversification, mixed cropping, adopting soil and water conservation methods, having diverse income sources, consuming products from own crop cultivation and animal husbandry, etc., are practised by many households irrespective of the altitude, which would have contributed to increasing the climate resilience of households.
From the results of the socioeconomic survey (APN, 2021) , factors such as the practise of both crop cultivation and animal husbandry, cultivation of diverse crops through mixed cropping, consumption of foods from own crop cultivation and animal husbandry, the economic stability of the household with more than one income source, presence of employed members in the households in addition to the HH, etc.), presence of naturally-grown plants and woody trees in the land, adopting integrated farming and soil and water conservation methods, having a house in good condition, knowledge of the HH on the changes in climate could be identified as characteristics of a climate-resilient farming system. However, the contribution of each factor varies from site to site as well as among farming systems. Identification of good management practices of the mountain farming systems with high climate resilience and implementing those practices in vulnerable ecosystems would lead to increase climate-resiliency and wellbeing of farming communities in steep terrain in mountain ecosystems at national and regional levels.
5. Conclusion
The study revealed that the farming systems in mountain areas in Chittagong (Bangladesh), Jhikhu Khola (Nepal), and Hatton and Welimada (Sri Lanka) differ in their size (extent), composition, resource utilization, and sustainable management practices adopted by the farmers.
Among four study sites, the average value for climate resilience was highest in Hatton with a CRI of 0.67 and the lowest in Chittagong with a CRI of 0.48. The Hatton study site had the highest proportion of households with very highly resilient farming systems in steep terrains, followed by Welimada, Jhikhu Khola and Chittagong. None of the households in the study sample in Chittagong could be categorized as having very high resilient farming systems. Different demographic, socioeconomic and environmental parameters under ADC, ABC and TC have contributed at different scales to the level of climate resilience of farming systems in steep terrains in hilly areas in the four study sites. Identification of factors that would contribute to increasing the resilience of households and hence the climate resilience in each site is necessary to address the site-specific issues and improving the already existing good practices to build climate resilience in farming systems in steep terrain.
6. Policy implications
The changing climate with extreme and unpredictable weather events have significant impacts on regional, national, and local development efforts and have added challenges to the communities of developing countries in their development interventions since the impact of climate change goes beyond specific sectors, geographic areas, communities and ecosystems.
Farming systems in developing countries are highly vulnerable to climate change impacts (Engle et al., 2013; Marambe et al., 2015; Mendelsohn, 2008). To promote climate-resilient development and to reduce these potential climate change impacts, decision-makers and development practitioners need to understand the climate vulnerabilities of the people, sectors, and places that they care about (USAID, 2016). Therefore, there is a growing need for approaches and concepts to assess climate vulnerability, adaptation and resilience and to monitor the progress in achieving resilience on national, sub-national and regional levels (Welle et al., 2014).
Assessment of climate resilience facilitates the understanding of environmental processes and would make governments and policymakers better equipped to develop sustainable solutions that could combat the effects of climate change. It also guides in establishing the idea of vulnerable and stable socio-ecological systems.
Acknowledgement
The research was funded by the Asia Pacific Network (APN) for Global Change Research through the CAF grant scheme (Grant No. CAF2016-RR10CMY-Marambe). The authors would like to thank Dr Linda Anne Stevenson, Ms Dyota Condrorini and Ms Nafesa Ismail for providing necessary guidance and various support throughout the implementation of the project.