
Climate change risk assessment and adaptation for loss and damage of urban transportation infrastructure in Southeast Asia
Keywords
Climate change adaptation · Flooding · Loss and damage · Urban transportation infrastructure · Vulnerability assessment
Highlights
- This study highlighted the vulnerabilities of urban transportation infrastructure to climate change in six cities of Southeast Asia.
- Road networks were the main type of urban transportation infrastructure vulnerable to climate change in the selected cities.
- Analyses conducted with NK-GIAS revealed economic losses for each flood scenario examined.
- It is recommended that future research further develops road damage curves through laboratory analysis.
1. Introduction
Historical evidence and future climate change projections point to past and ongoing climate change in Southeast Asia. Increases in average annual temperature, changes in regional precipitation regimes, and sea-level rise (SLR) were evident during the last century. Future climate modelling projects temperature increases; precipitation to increase regionally though variable locally; and SLR to reach 30-40 cm by the end of this century (Hijioka et al., 2014; IPCC, 2013; IPCC, 2014; NIC, 2009). Increased frequencies of weather extremes, tropical cyclones, floods and drought have been experienced in Southeast Asia (ADB, 2009; ADB, 2010). Projections indicate that climate change will lead to increased precipitation extremes related to monsoon and tropical cyclones, and flooding and coastal erosion caused by SLR will become a major threat to coastal communities (Hijioka et al., 2014; UN-Habitat, 2011) .
Across Asia, communities will be increasingly vulnerable to the effects of climate change through its impact on water resources, agricultural production, natural resources, coastal and urban areas, and infrastructure (Hijioka et al., 2014). Given the region’s high population, rapid urbanization and development, and economies reliant on agriculture and the use of natural resources, Southeast Asia is recognized as particularly vulnerable to the effects of climate change (ADB, 2009; ADB, 2010) . Sea level rise will likely impact communities living in low-lying regions of Southeast Asia. In the Mekong River delta, it is estimated that a 1 m SLR could displace between 3.5 and 5 million people (IPCC, 2007). Groundwater abstraction and development policy may exacerbate the risk of flooding (Hens et al., 2018). In low-lying regions of Southeast Asia, groundwater abstraction can contribute to subsidence, as evidenced in Bangkok and other cities of the region; and government policy may encourage development in flood-prone areas, such as in the city of Quy Nhon, Vietnam. Infrastructure is at increased risk from SLR and a variety of measures are required to address this issue, including adaption and mitigation approaches (Hens et al., 2018). Infrastructure, including transportation, is threatened by other climate change-related impacts, including flooding and landslides, storms and drought (World Bank, 2010).
Potential adaptation options to address climate change impacts include hard adaptation strategies, such as building new transportation systems, dikes, strengthening infrastructure; and soft options such as providing early warning systems, policymaking and planning (World Bank, 2010). Climate-proofing of urban transportation infrastructure might include hard adaptation options such as revising design standards for roads and associated assets such as culverts, bridges and embankments (ADB, 2010). Concerning adaptation, Southeast Asia is acknowledged as needing more investment in multiple sectors of the economy, with infrastructure, including transportation, highlighted as a priority area for support (ADB, 2009).
This project addresses the need to improve the mainstreaming of climate change into development planning of urban transportation infrastructure (UTI). An understanding of both the impacts of climate change and vulnerability of UTI is required. Vulnerability assessment can provide insights into potential loss and damage of infrastructure and support adaptation efforts through the sharing of knowledge on hazard factors, vulnerability profiles, and the building of community adaptive capacity. Such information can better inform decision-makers in implementing appropriate measures and policies for adaptation to climate change impacts, and especially for flood loss reduction. Vulnerability assessment techniques and tools attempt to incorporate knowledge across environmental, social and economic concerns; and the outputs of such analyses can provide a stronger evidence base for determining vulnerabilities and sensitivities of systems, whether at regional or city level, related to various climate change scenarios (Füssel & Klein, 2006).
The adoption of appropriate adaptation measures and strategies for UTI will be informed from the variety of approaches already implemented in cities and economic sectors, including transportation. Recognized challenges include inappropriate planning due to a lack of climate change awareness and information, with solutions typically informed by assessing investment costs and benefits. This study is expected to support cities and countries by contributing knowledge and capacity building to facilitate improved climate change adaptation for UTI planning.
2. Objectives
This study aims to advance knowledge on loss and damage of UTI in the context of climate change in selected cities in Southeast Asia and bring effective and applicable climate change risk assessment tools and methods to UTI planning and management. To achieve this outcome, the objectives of this study are two-fold:
- Develop a methodology for assessing loss and damage for UTI in the context of climate change at the city level; and
- Identify climate change adaptation measures for incorporation into urban transport planning
The study examines the linkages between hazards, vulnerability and adaptive capacity, focusing on flood-related loss and damage for roads, which form the main UTI in the study areas. It also helps identify adaptation measures for incorporation into urban transport planning at the city level. Limitations of the study relate to the scope of the loss and damage assessment for UTI, which only considers the negative impacts of climate change in the context of urbanization. Furthermore, hydraulic effects were addressed through integrating road damage curve findings from the literature review, as appropriate laboratory experiments were out of the study’s scope.
3. Methodology
Six cities (two cities per country) were selected for conducting rapid assessments. These assessments focused on loss and damage of UTI in the context of climate change by applying Participatory Rural Appraisal (PRA), Impact Matrix, and Multiple Criteria Analysis (MCA). Based on the rapid assessment findings and city selection criteria, three pilot cities were selected (one city per each country) for subsequent vulnerability assessments (VA) at the community level using NK-GIAS. The NK-GIAS is specialized geographic information system (GIS) software that enables the management, display, editing and analysis of spatiotemporal data. It is used here for estimating the loss and damage for each type of UTI associated with key hazards.
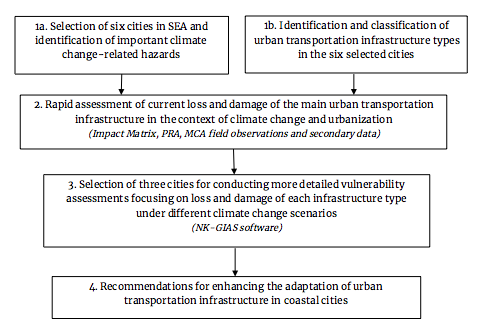
The loss and damage estimation process utilizing NK-GIAS (Samarakon, Nakamura, & Hunukumbura, 2012) is outlined as follows in four steps and also shown in Figure 1. The project considers climate change-related disaster risk as a function of the interaction between hazards, vulnerability, and adaptive capacity.
In step 1a, six cities in three countries (two per country) were selected as the study areas. City selection was based on a literature review concerning climate change-related risk, as well as from secondary data concerning climate change impacts and loss and damage of UTI.
In step 1b, each country project partner reviewed and classified UTI types in each city based on a literature review, survey, and consultation with key stakeholders (Green Style Co., Ltd., 2018; Samut Sakhon Municipality, 2018; Hoi An Transportation Department, 2017; Hua Hin Municipality, 2015; MPWT, 2009; MPWT, 2013; Vinh Long PC, 2015).
In step 2, rapid assessment (Füssel et al., 2006; Noi & Nitivattananon, 2015) was conducted to determine the current loss and damage of urban transportation infrastructure associated with identified hazards based on current and historical data at the city level over a period of 5 to 10 years. The assessments addressed the costs of recovery/repair and percentage of UTI damaged after a flood, storm, heavy rain, and landslide; applied PRA to identify hazards, associated vulnerability, and current adaptive capacity; and used Impact Matrix and MCA to estimate UTI vulnerability to hazards.
In step 3, findings from Step 2 were used and more detailed vulnerability assessments were conducted for one pilot city per country to estimate loss and damage for the main UTI types. Loss and damage were estimated using NK-GIAS software (Samarakon et al., 2012) for the most vulnerable UTI. The loss and damage estimation process utilizing NK-GIAS is outlined as follows: (1) selection and processing of baseline data including topography, meteorology, hydrology; (2) creation of infrastructure map density layers; (3) analysis of hazard impacts under different climate change scenarios (flooding scenarios); (4) generation of hazard maps showing projected future maximum flood depths; (5) development/adaptation of damage curves for each type of UTI (i.e., roads) from surveys, secondary data, and literature review; (6) estimation of damage for each type of UTI by applying the function of total structural damage for the UTI types based on the results of step (3) and (4); and (7) summarizing of damage estimations (cost estimations) and the proposing of recommendations.
In step 4, the research methodology and findings were shared with stakeholders through workshops, and recommendations for enhancing the adaptation of urban transportation infrastructure management in coastal cities were discussed. During the implementation of the project, the team had the opportunity to discuss the research and ongoing findings with various government departments, and at the conclusion and approval of the final report, the findings will be shared with key stakeholders. Although not part of the project, it would be interesting as a future initiative to follow up with stakeholders to discuss progress in mainstreaming climate change into planning for urban transportation infrastructure.
4. Results and discussion
4.1 Rapid vulnerability assessment of UTI in selected cities
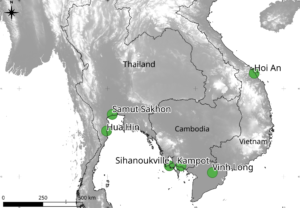
Selection of the three countries in Southeast Asia for the study was based on consideration of their vulnerability to climate change, especially to SLR and the existing research network for conducting a collaborative project between the selected countries. The city selection criteria used in the assessment were representation, significance, and data accessibility. Based on the literature review, the cities selected for the study were Hoi An and Vinh Long in Viet Nam, Hua Hin and Samut Sakhon in Thailand, and Kampot and Sihanoukville in Cambodia (see Figure 2 and Table 1).
Given that approximately 70% of Hoi An is situated below an elevation of 3 m, it is highly vulnerable to SLR (Hoi An PC, 2015; SIHYMECC, 2015). The need for implementing climate change adaptation measures to reduce threats to natural resources, the local community, economy and transportation assets is recognized. Presently, the city prioritizes adaptation measures to reduce coastal erosion.
Vinh Long city is highly vulnerable to climate risks, especially to rising sea level and increased rainfall, and their combination with high tide has the potential to exacerbate flooding (Vinh Long PC, 2015). Given its low topography, the city is exposed to flooding with increasing duration and magnitude, with UTI already affected by flooding. In the city, hard and soft adaptation measures have been developed, but those for UTI are insufficient.
In Thailand, Hua Hin is coastally situated, with inland flooding due to runoff, a key climate-related hazard, which may worsen in the future with increased rainfall extremes during the southwest monsoon season. In addition, typhoons and tropical storms are described as being of ‘relatively high risk’ in southern parts of Thailand, including Hua Hin city (Thailand Meteorological Department, 2012). In the city, climate-related hazards have the potential to impact overall development, including UTI functions, and to increase the costs of repair and maintenance for UTI. Climate change adaptations are being implemented in the city but are not targeted at UTI.
Located along the northern edge of the Gulf of Thailand, Samut Sakhon is at risk from SLR and storm surge, as well as from coastal erosion and saltwater intrusion. The city has a large population with a high density of infrastructure, including UTI that is vulnerable to climate change impacts. Climate change adaptation measures are being implemented, which focus mainly on hard infrastructure solutions (Samut Sakhon Municipality, 2019).
Kampot city in Cambodia is vulnerable to storms, rainfall extremes, floods and saltwater intrusion (JICA, 2015; MPWT, 2013) . These hazards directly affect important facilities that provide services for water supply, sanitation, and road infrastructure, all of which are in an underdeveloped state. The effects of climate change on urban infrastructure have previously been studied: roads, dikes, canals, bridges and railways, drainage systems and water supplies are all vulnerable to storm, floods, and sea level rise (JICA, 2015; RUPP, 2018) .
|
City |
General information |
Urban transportation infrastructure |
|---|---|---|
|
Hoi An |
– Total area: 6,148 km² (Hoi An PC, 2019) . – Population: 98,599 (Hoi An PC, 2019) . – Located in a vulnerable coastal region and downstream of the Vu Gia–Thu Bon River. – Recognized as a World Heritage Site since 1999. – The city’s location and region are especially susceptible to climate-related impacts. Much of Hoi An is low-lying, with 70% of the city below an elevation of 3 m (SIHYMECC, 2015). |
– The width of the main inland road system is 5–7 m and in some places up to 14–20 m excluding pedestrian walkways (Hoi An PC, 2015) . – The inner-city road network is old and small, and related infrastructure old. The total road length is 133.6 km, of which 67% is bituminous (Department, 2017) . |
|
|
|
|
|
Vinh Long |
– Total area: 47.82 km² (Vinh Long PC, 2019) . – Population: 98,599 (Vinh Long PC, 2019) . – Located in the central area of the Mekong Delta, between the Tien River and Hau River. – Vulnerable to the combination of rising sea level, and heavy rainfall, which can result in flash flooding, and high tide (Vinh Long PC, 2015) . |
– Located in an area with a dense stream network, the city has access to water and inland road networks. – Some urban roads are susceptible to flash flooding of up to 20-30 cm depth, causing traffic congestion and damage. These roads do not comply with the required rain drainage standard (Vinh Long PC, 2015) . – The city is exposed to flooding of increasing duration and magnitude given the city’s lowland setting, with UTI already affected by flood (Vinh Long PC, 2015) . – Hard and soft climate change adaptation measures are being implemented, but those for UTI are not adequate (Vinh Long PC, 2015) . |
|
|
|
|
|
Hua Hin city |
– Total area: 86.36 km2 – Population: 65,983 (Hua Hin Municipality, 2015) – Hua Hin is a popular coastal resort and the largest coastal settlement in the Thai province of Prachuab Khiri Khan. – Hua Hin has a rapidly growing population and large tourist population (Hua Hin Municipality, 2015) – Inland flooding caused by runoff will likely become greater in the future with increasing rainfall extremes. During the rainy season, flash flooding is an issue in a lower-lying part of the city (Hua Hin Municipality, 2015; JICA, 2013) |
– The main UTI are road and rail networks and related infrastructure. – Climate change adaptation efforts are being implemented but are not targeted at UTI (Hua Hin Municipality, 2015; JICA, 2013) – Transportation planning does not extend beyond a‘densification’ road development target of 1 km per km2 (currently 0.8 km/ km2) as per the report of Hua Hin Municipality (2015 ) |
|
|
|
|
|
Samut Sakhon city |
– Total area: 1,033 km2 – Population: 68,381 (Samut Sakhon Municipality, 2019) – Samut Sakhon province is part of the Bangkok Metropolitan Region and comprises three districts, of which the capital district, Meuang Samut Sakhon, and its coastal municipal sub-districts are of interest in this study. – Climate-related hazards include coastal flooding from SLR, storm surge, and coastal erosion (Samut Sakhon Municipality, 2018) |
– Key UTI comprise road and rail networks and related assets, which are at risk from climate-related hazards. – Adaptation measures are being implemented, which focus mainly on hard infrastructure solutions (Green Style Co., Ltd., 2018; Samut Sakhon Municipality, 2018) . – Engineering adaptation measures include ground elevation and sea wall construction, though leakage through the latter was reported (Samut Sakhon Municipality, 2018). |
|
|
|
|
|
Sihanoukville city |
– Total area: 85.56 km2 – Population: 79,745 (Sihanoukville Administration, 2019) – Sihanoukville city is described as an economic zone port and tourism development city – The vulnerability of Sihanoukville was previously assessed (UN-Habitat, 2011) and SLR was identified as a key risk factor, rising up to 1.5 m by the end of the century, with resultant flooding a threat to low elevation areas and with impacts potentially exacerbated by storm surge and high tide (JICA, 2015; MPWT, 2013) . |
– Sihanoukville has 48,385 km of existing roads in four districts, of which 3,668 km are constructed with concrete, 25 km with laterite, 4.8 km with constructed earth, and 4.74 km with unconstructed earth. – The railway from Phnom Penh to Sihanoukville is 266 km in length (MPWT, 2013). – The Department of Public Works and Transport spend more than 50,000 USD annually for repairing and maintaining the road system (MPWT, 2013). |
|
|
|
|
|
Kampot |
– Total area: 39.41 km2 – Population: 35,874 (Kampot Administration, 2015) – This city is vulnerable to various climate hazards, including extreme winds, SLR, prolonged drought, saltwater intrusion, and floods caused by intensive rainfall. Historical evidence reveals the damage of such extremes to residents and city infrastructure (JICA, 2015; MPWT, 2013) . – Several communes are highly vulnerable to SLR, particularly Chum Kriel, Traeuy Koh, Boeung Sala Tboung and Russei Srok Keut. Flooding of salt farms and saltwater intrusion represent key impacts of SLR (MPWT, 2013) |
– The road system in Kampot has a total length of 45,117 km which extends over five districts, of which 1,556 km of road are constructed of concrete, 33.224 km with laterite, 2.848 km with earth and 4.760 km with unconstructed earth (MPWT, 2013) . – A variety of infrastructure assets, including roads, dikes, canals, bridges and railways, drainage systems and water supply systems, are vulnerable to storm, floods, and SLR. Substantive economic, social and infrastructural damage results from these hazards (RUPP, 2018) . |
Table 1. Key information of three cities chosen for rapid vulnerability assessment.
The Cambodian city of Sihanoukville is vulnerable to SLR, storms and flooding. These hazards cause coastal erosion and flash flooding in the city and resultant infrastructure losses include UTI damage (JICA, 2015; MPWT, 2013). Current coastal infrastructure will not adequately cope with increased flood risk and extreme events due to climate change. Furthermore, key UTI is inadequate and of poor quality (e.g., earthen roads), so it is difficult to reduce the impact of flood events, and the lack of relevant expertise and access to funds offer considerable challenges. Overall, the vulnerability of the city has been ranked as ‘medium’, but some areas along the coastline are recognized as being highly vulnerable.
A variety of factors were assessed for each city-specific rapid vulnerability analysis (RVA) (Noi et al., 2015). Inputs were sought through interviews with local experts; exposure to climate change-related hazards; UTI vulnerabilities; and each city’s particular geographic settings and social and economic characteristics. Current and potential approaches to adaptation and adaptive capacity were discussed, and the vulnerability of each city ranked accordingly. A city was given the highest vulnerability ranking if adaptation measures were absent and described as having ‘low vulnerability’ if some adaptation measures were currently being implemented. If a city had high adaptive capacity, it was defined as having ‘low vulnerability’ and with ‘negligible vulnerability’ if there were no climate-related hazards.
A summary of the RVA results is given in Figure 3.
Based on rapid assessment with group discussions and expert interviews, Table 2 presents the sensitivities of the six selected cities and their capacity to adapt to current and projected climate-related hazards. Table 2 shows that when the adaptive capacity of a city is low, the city may be vulnerable or highly vulnerable to hazards, or if exhibiting medium or a higher level of adaptive capacity, the city may have low vulnerability to hazards. If adaptive measures are lacking, vulnerability is higher. All hazards were considered with regard to their impacts on the main UTI, including roads, ports/harbours and rail. Based on evidence derived from field observations and expert interviews, the effectiveness of implementing a climate change adaptation measure was shown for the Samut Sakhon River dike construction in 2009. Dike construction was found to reduce flood frequency and depth; and total loss and damage, estimated from socioeconomic and natural resources, was reduced by over 70% (Samut Sakhon Municipality, 2019).
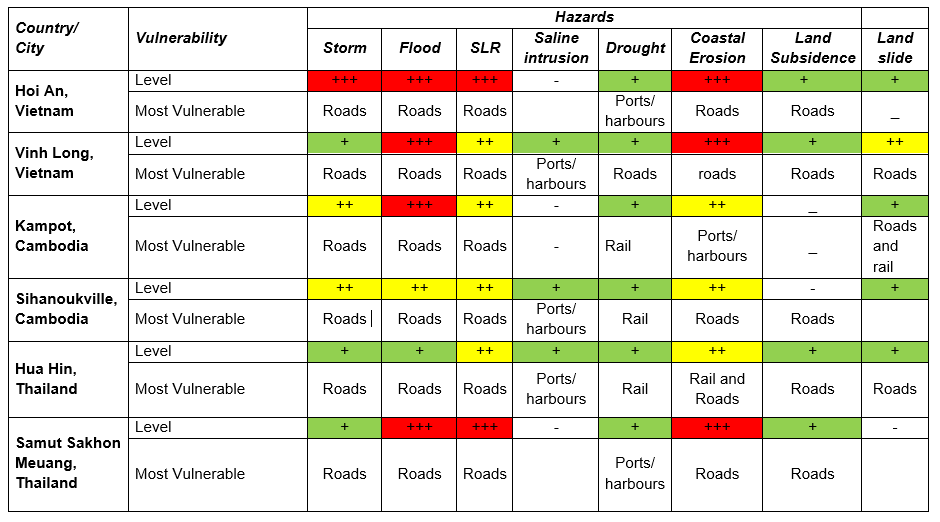
Table 2 shows that the main climate change-related factors affecting UTI are flood and SLR, which represent potential hazards for roads in all of the selected cities. In addition, the main UTI that is vulnerable to climate change in the selected cities are roads, ports/harbours and rail (roads are more vulnerable to flood). Based on RVA results, three cities (one in each country) that were identified with the highest UTI vulnerability (i.e., Hoi An, Kampot and Samut Sakhon) were selected for a more detailed vulnerability assessment, which focused on loss and damage of roads under different flood scenarios.
4.2 Assessment of UTI damage by applying NK-GIAS
4.2.1 Damage curve development for road damage
According to (Bruijn, 2005) , the damage function for infrastructure is defined as follows:
where ED represents economic damage in US dollars (USD), α is the damage factor of the damage category, d is water depth (m), Dmax is the maximum damage per unit in category (USD/m2), and ε is the conversion factor or extra factor.
This study adapted the damage function to calculate road damage as follows:
where
-
Di max is the maximum damage per unit of road (construction cost as USD/m2)
-
S is cell size (m2)
-
αi is the roads damage factor depending on flood depth (h)
-
ε= 1: The road was digitized from road and digital elevation maps, which included detailed roadways. The roadways can be accurately measured, so there is no correction factor and ε = 1.
The relationship between flood depth and percentage of road damage, as given by Chen (2007) and De Bruijn (2005), was adopted, where the road damage factor and flood depth are correlated and defined in the road damage curve as follows:
The α values were calculated based on flood depth, with the results presented in Table 2.
The α value was applied for calculating road damage based on flood depth in the calculation of cost damage.
|
x (Flood depth in meters) |
Y (α) |
|
0 |
0.00 |
|
0.15 |
0.00 |
|
0.35 |
0.10 |
|
0.60 |
0.27 |
|
0.75 |
0.49 |
|
0.91 |
1.00 |
4.2.2 Results of maximum road damage under different flood scenarios
The following section summarizes road damage results from the main flood scenarios examined. The detailed steps for calculating road damage using NK-GIAS followed the methodology described in section 2. The NK-GIAS software was validated and calibrated using historical flood depth data and the actual damage to roads in the case study areas. Actual road damage was compared with the calculated results of maximum road damage, and the model then adjusted for final validation and calibration before being applied to the three selected cities.
4.2.2.1. Flood scenarios
Flood scenarios were based on maximum water levels as recorded from events in the last 10 to 20 years or the highest historical water level based on data available. The data used for flood scenario analysis had the following Hmax values (m) where Water level (Hmax) = flooding depth (h) + ground elevation (with all units in meters): Hmax = 3.40 m in Hoi An on November 1964 (SIHYMECC, 2015); Hmax = 4.0 m in Kampot on September 2013 (JICA, 2015); and Hmax = 2.7 m in Samut Sakhon on October 2011 (Green Style Co., Ltd., 2018; Samut Sakhon Municipality, 2019). In addition, for estimating maximum road damage, new flood scenarios were created by increasing the water level (Hmax) as follows:
Scenario 1: The mean water level over the last 20 years in the study areas.
Scenario 2: The water level that is equal to the maximum flood depth experienced over the last 20 years in the study areas.
Scenario 3: The water level that is equal to an increase in flood depth of 3 to 7% compared to the maximum flood depth over the last 20 years in the study areas (based on topographic characteristics of each city and expert consultation).
Scenario 4: The water level that is equal to an increase of 10 to 17.5% compared to the maximum flood depth over the last 20 years in the study areas (based on topographic characteristics of each city and expert consultation).
4.2.2.2. Calculation of maximum road damage
It is assumed that damage occurs after inundation and the cost of recovery to the state/condition of the road before flooding is considered as road damage.
Hoi An City
The main urban roads investigated in the study are detailed in Table 3.
|
Roads |
R1 (AC, SDP, CC) |
R2 (Pen, AC, CC, Earth) |
R3 (AC, Pen, CC) |
R4(AC, Pen, CC) |
R5 (AC, CC, Pen) |
Total |
|
Length (m) |
84,024 |
20,742 |
7,078 |
6,146 |
15,620 |
133,610 |
|
Percentage (%) |
62.89 |
15.52 |
5.30 |
4.60 |
11.69 |
100.00 |
|
Surface (m2) |
1,247,859 |
239,209 |
62,936 |
45,201 |
71,195 |
1,666,401 |
|
Percentage (%) |
74.88 |
14.35 |
3.78 |
2.71 |
4.27 |
100.00 |
|
Cost (USD/m2) |
90 |
90 |
82 |
68 |
38.83 |
|
Table 3. Road types in Hoi An city. Source: Hoi An Transportation Department (2017) and VMC (2015). Note: AC: Asphalt concrete; Pen: Penetration; CC: Cement concrete; SDP: Surface dressing pavement.
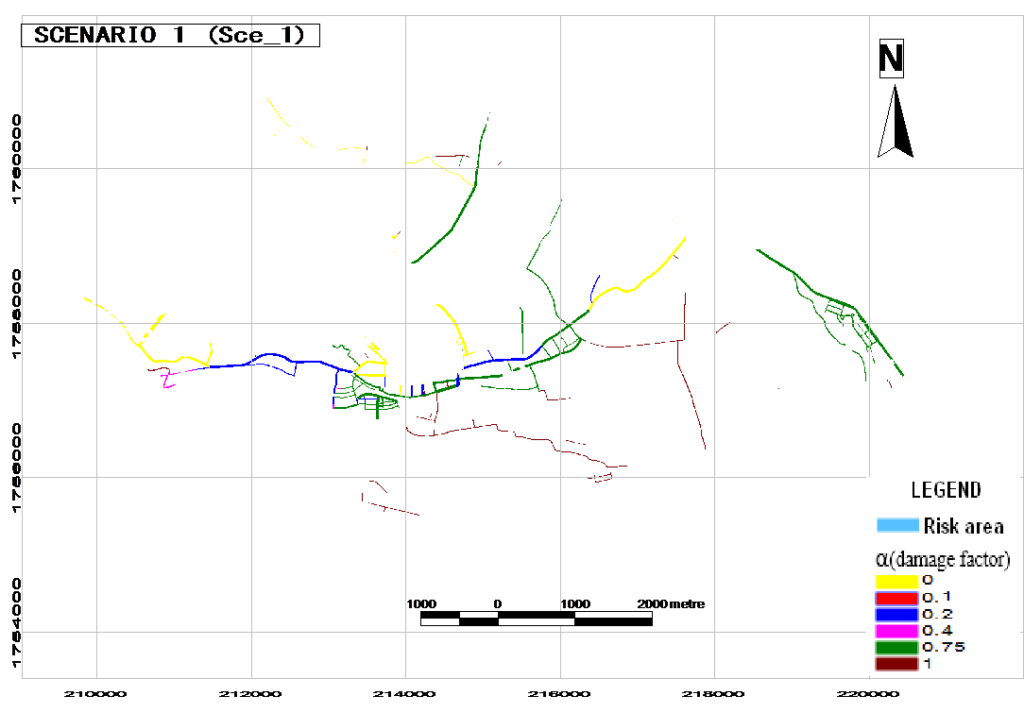
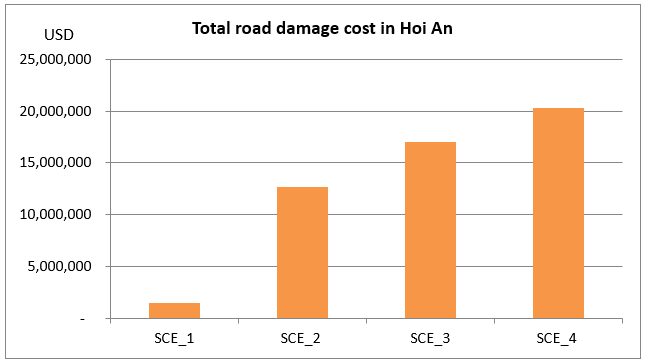
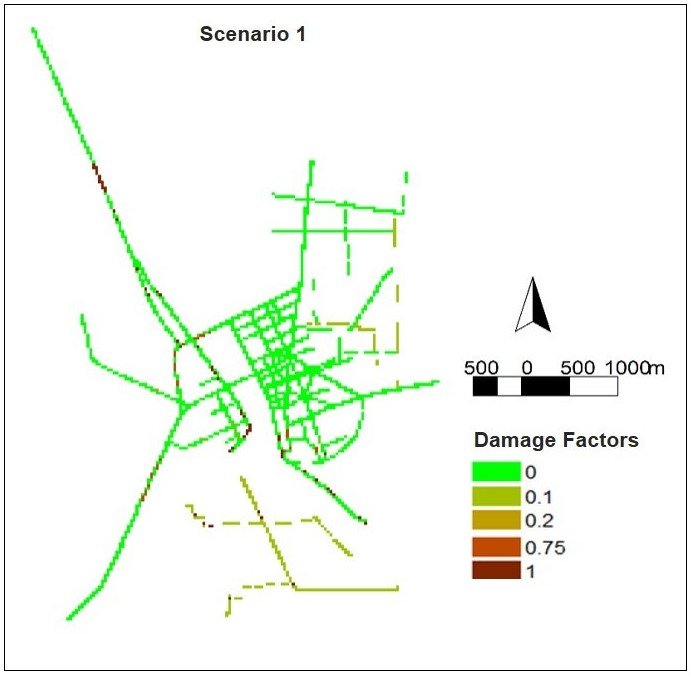
The road damage factors determined in Hoi An under scenario 1 (SCE_1) are presented in Figure 4, and road damage costs for each scenario and type of urban road are shown in Table 4.
|
|
|
Name of scenario
|
|||
|---|---|---|---|---|---|
|
|
|
SCE_1 (m)
|
SCE_2 (m) 3.4
|
SCE_3 (m) 3.61
|
SCE_4 (m) 3.94
|
|
Road damage |
R1 |
621,335 |
6,173,497 |
8,886,456 |
11,344,227 |
|
R2 |
74,411 |
776,228 |
1,165,390 |
1,528,950 |
|
|
R3 |
71,559 |
852,295 |
1,187,013 |
1,380,114 |
|
|
R4 |
550,092 |
3,992,492 |
4,562,281 |
4,631,773 |
|
|
R5 |
104,912 |
884,930 |
1,220,152 |
1,386,971 |
|
|
Total (USD) |
1,422,311 |
12,679,444 |
17,021,294 |
20,272,036 |
|
Table 4. Total road damage under different scenarios in Hoi An City.
Based on secondary data and expert consultation in Hoi An (2017), the estimated road damage due to flooding in the city mostly relates to the road surface. In addition, as discussed during the transport expert consultation, the road foundation can minimize damage from flood due to robust road construction and other adaptation measures such as dikes and embankments (Hoi An Transportation Department, 2017). Furthermore, this research only considers hydraulic effects based on the road damage curve and does not apply any hydraulic modelling. According to the results, the maximum road damage is 20.3 million USD under flooding scenario 4 (Table 4).
Kampot city
The various metrics of urban roads within Kampot city are presented in Table 5.
|
|
Road type in Kampot city
|
||||
|
|
R1 (AC)
|
R2 (CC)
|
R3 (DBST)
|
R4 (DBST)
|
Total
|
|
Length (m) |
9,295 |
3,542 |
14,150 |
21,945 |
48,932 |
|
Surface (m2) |
103,182 |
37,246 |
142,017 |
149,952 |
432,397 |
|
Length (%) |
19% |
7% |
29% |
45% |
|
|
Surface (%) |
24% |
9% |
33% |
35% |
|
|
Cost (USD/m2) |
48 |
44.18 |
34.4 |
|
|
Table 5. Road types in Kampot city. Note: DBST = Double Bituminous Surface Treatment.
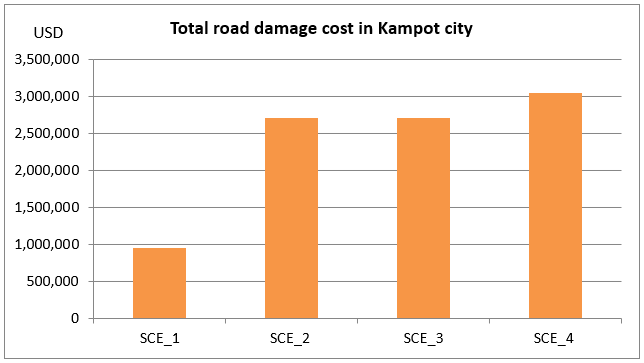
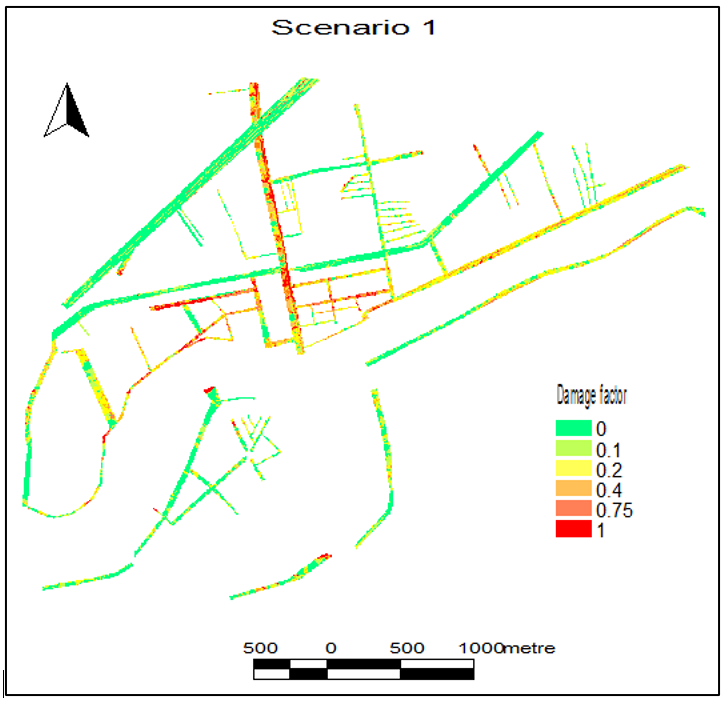
Road damage factors are shown in Figure 6 for scenario 1, and damage costs for each kind of road with regard to each flood scenario in Kampot are presented in Figure 7 and Table 6.
Findings reveal that the total cost of loss and damage from urban flooding under each scenario is substantial (Table 6 ). Under scenario 1, with an average flood depth of 0.3 m, costs amounted to more than 952K USD, which is the lowest economic loss in comparison to the other three scenarios. The road damage cost for scenario 2 (SCE_2), which reflects the maximum flood within the last two decades, is higher than the base scenario with costs amounting to 2.7 million USD and is comparable to the cost of scenario 3. However, when the water level increases by 17.5% compared to scenario 3 (SCE_3), the economic loss peaks at about 3 million USD.
|
|
|
Name of scenario
|
|||
|---|---|---|---|---|---|
|
|
|
SCE_1 (m)
|
SCE_2 (m)
|
SCE_3 (m)
|
SCE_4 (m)
|
|
|
|
3.3
|
4.0
|
4.3
|
4.7
|
|
Road damage |
R1 |
516,987 |
1,623,104 |
1,623,104 |
1,647,624 |
|
|
R2 |
27,387 |
223,745 |
223,745 |
508,044 |
|
|
R3 |
393,855 |
758,393 |
758,393 |
779,599 |
|
|
R4 |
13,860 |
104,445 |
104,879 |
105,940 |
|
|
Total (USD) |
952,089 |
2,709,688 |
2,710,122 |
3,041,208 |
Table 6. Total road damage under different scenarios in Kampot city.
Results also indicate how different road surfaces impact costs. Asphalt concrete is most vulnerable to economic loss when flooding occurs in urban areas compared to other road types. Cement concrete roads are the choice for commune development due to limited resources and geographical availability. Laterite roads were mostly used in peri-urban communities and for connecting main roads in the city. The economic loss of laterite roads is lower compared to other types, although representing 45% of the total road length in the city. The DBST road type is most common in the city and is the second most vulnerable road surface type to economic loss by flood impact, with cement concrete roads being more vulnerable.
The cost of road damage under different scenarios is shown in Figure 7. Results indicate that the base scenario is less vulnerable under the current situation of road infrastructure development. Alternative scenarios show substantive impacts on UTI, especially for AC and DBST road types. Estimated damage costs were not significantly different between scenarios 2, 3 and 4 in the model due to the limitation of the DEM used in Kampot city (30 m resolution). A higher DEM resolution would have likely improved findings but was not available.
Samut Sakhon
The various metrics of road infrastructure in Samut Sakhon are presented in Table 7.
|
|
Road type in Samut Sakhon city |
|||
|---|---|---|---|---|
|
|
R1 (RC)
|
R2 (A)
|
R3 (Highway)
|
Total (m)
|
|
Length (m) |
18,233 |
23,029 |
39,215 |
80,477 |
|
Surface (m2) |
332.20 |
272.80 |
63.00 |
668 |
|
Length (%) |
23% |
29% |
49% |
|
|
Surface (%) |
50% |
41% |
9% |
|
|
Cost (USD) |
725 |
29 |
300 |
|
Table 7. Road type in Samut Sakhon city. Source: Samut Sakhon Municipality (2018). Note: RC = Double Bituminous Surface Treatment.
Samut Sakhon has only three types of urban road, including reinforced concrete (RC) and asphalt (A) and highway with RC surfaces. The total length of highway road is 39,215 km which represents around 9% of the road surface in the city.
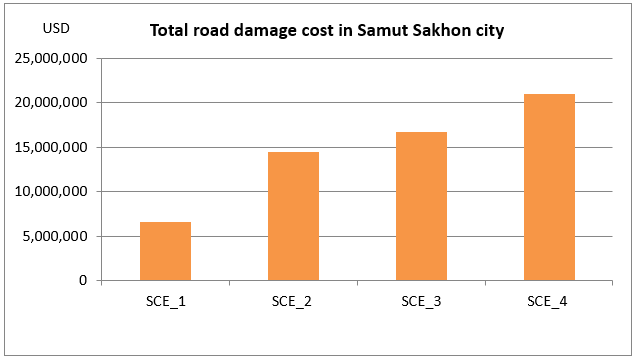
Road damage factors are shown in Figure 8 for scenario 1, and the estimation of road damage under different flooding scenarios is shown in Table 8 and Figure 9.
|
|
|
Name of scenario |
|||
|---|---|---|---|---|---|
|
|
|
SCE_1 (m)
|
SCE_2 (m)
|
SCE_3 (m)
|
SCE_4 (m)
|
|
|
|
2.4
|
2.7
|
2.79
|
2.99
|
|
Road damage |
R1 |
1,921,350 |
3,912,921 |
4,409,701 |
5,272,966 |
|
R2 |
3,534,049 |
6,934,664 |
7,776,366 |
9,069,439 |
|
|
R3 |
1,139,290 |
3,698,020 |
4,528,451 |
6,703,217 |
|
|
Total (USD) |
6,594,689 |
14,545,605 |
16,714,518 |
21,045,622 |
|
Table 8. Total road damage under different scenarios in Samut Sakhon city.
Samut Sakhon is a low-lying city with mean elevation under 1.8 m (Samut Sakhon Municipality, 2018). According to Table 8 and Figure 9, using road damage calculations based on scenario 3, the water level was 2.79 m which was about 3.3% higher than the historical Hmax in October 2011 (Green Style Co., Ltd., 2018). Ongoing construction of a river dike will protect much of the city (as of 2019, 500 m remains to be built), which is a critical climate change adaptation measure in the study area. However, with only 0.09 m of increased flood depth under scenario 3, the economic loss increases from 14.5 to 16.7 million USD (a 15% increase). Under scenario 4, with a flood depth increasing by 0.29 m compared to scenario 2, losses increased by 44.7% from 14.54 to 21.04 million USD.
Results indicate that under scenario 1, the current situation of road infrastructure development is vulnerable. Discussions with the Disaster Prevention Department indicated that two subdistricts, Tha Shalom and Mahachai, were flooded by a mean flood level of 0.6 m (water level is 2.4 m) before dike construction. Dikes were built between 2007 and 2009, and flood depth is now always under 0.6 m and only in Chalom subdistrict which is an area outside of the dike (Samut Sakhon Municipality, 2019).
Alternative scenarios show greater impacts on UTI, especially for the RC road type. Estimated damage costs were significantly different between scenarios 2, 3 and 4 due to differences in inundation areas. One factor supporting more accurate determination of the inundated areas (and flood depths) would be to use a DEM with higher resolution (2 m resolution) in Samut Sakhon city.
5. Conclusions and recommendations
This study defined an assessment methodology for applying climate change risk assessment for UTI at the local level. An enhanced understanding of potential hazards, vulnerabilities and adaptive capacity was achieved through adopting RVA approaches and using NK-GIAS for more detailed analyses. Based on the review process adopted, the six cities selected in this study were shown to be vulnerable with regard to a number of aspects. Given their geographic settings, the six cities were especially at risk from flooding and salinity intrusion, with risk further exacerbated by SLR and storm surge. Road infrastructure was identified as being most at risk from the impacts of climate change, and current policies for UTI lack considerations of climate change. In all of the six cities, flooding and SLR represent potential hazards as identified through the RVA.
This study demonstrates how economic losses can relate to different flood scenarios, where increasing depth directly increases damage costs in each city. Based on the results from the NK-GIAS analysis under scenario 1, the estimated maximum damage costs for Hoi An, Kampot, and Samut Sakhon were 0.95, 1.5 and 6.5 million USD, respectively. The flood scenarios examined provide a range of possible damage costs by city: under SCE_4 (the most extreme scenario examined), estimated maximum damage costs reach 20 million USD for Hoi Anh, 3 million USD for Kampot, and 21 million USD for Samut Sakhon. Note, however, that the actual damage costs reduced considerably following dike construction in Samut Sakhon in 2009, with the dike reducing flooding under SCE_1 to SCE_3 (the water level is lower than the dike height), but the maximum damage cost may reach 21 million USD under SCE_4.
Two key constraints to the assessment methodology were identified: reduced accuracy in the flooded area may result from using a DEM with low resolution, which preferably should not be larger than 5 m for the input DEM; and conducting flood damage assessment should apply a suite of approaches for investigating all vulnerability factors and the sensitivities of each city to flooding.
Engineered adaptation measures that have been implemented by local governments to address flooding include the development of dikes and embankments for long-term protection and the use of sandbags as a temporary measure. The effectiveness of dike protection is demonstrated in Samut Sakhon, where after completing its construction around the city, the frequency of flooding was reduced by more than 70% (Samut Sakhon Municipality, 2019). However, concerns about incorporating climate change into policy and planning is a more recent consideration. Existing climate change action plans (to 2050) for Vinh Long and Hoi An (Viet Nam) are rather general and lack details with regard to UTI and, more specifically, associated design and construction requirements.
A number of recommendations are proposed based on the study’s findings: (i) to encourage the mainstreaming of climate change into policy and planning, training should be provided to relevant government authorities and especially for local government staff in Hoi An, Kampot and Samut Sakhon cities; (ii) to encourage collaboration among the private sector, city municipalities and local government to ensure UTI development is both cost-efficient and climate-resilient; and (iii) to utilize best available evidence on flood frequencies and historical water levels to inform infrastructure design (e.g., for strengthening the foundation of coastal and riverside road bridges and culverts); (iv) the results of the UTI damage assessment might be improved if research could have focused on developing new damage curves in the laboratory using physical models to simulate damage related to both flood depth and duration. Further research is recommended to conduct laboratory experiments to refine road damage curves for strengthening the NK-GIAS analysis.