Climate change adaptation through optimal stormwater capture measures
Keywords
Climate change · GCM · Rainfall IDF · Runoff · Stormwater · Yato Watershed
Highlights
- An overall increase of 6% to 25% is projected in extreme precipitation intensities over the study area
- Increase in peak discharge by 11% to 20% due to increasing extreme rainfall precipitation events
- Quantile mapping technique enabled a significant reduction in GCM precipitation bias
- Use of multiple GCMs and RCPs are recommended due to significant uncertainty associated with climate projections
Introduction
In recent years, stormwater management has become challenging and expensive because these events occur more frequently and are becoming more extreme. Many scientists believe that climate change and urbanization have caused these so-called extreme events. Rapid and unplanned urban expansion threatens sustainable development when the necessary infrastructure is not developed or when policies are not implemented. In other words, the absence of adaptation strategy increases the risk of hazards such as floods. Urban floods are frequently reported due to the significant rise in extreme precipitation intensity (Saraswat, Kumar, & Mishra, 2016; Herath, Penh, Okui, Imbe, & Kitagawa, 2012; Luo et al., 2010). Today the world is confronted with climate change, which poses unprecedented multidimensional challenges for all countries and communities in the Asia-Pacific region due to the uneven distribution of precipitation between wet and dry seasons (UNISDR, 2015). With an energized global water cycle, the future climate is expected to feature increased precipitation intensities and more dry days (IPCC, 2014; Yilmaz, Hossain, & Perera, 2014). Thus, increased rain intensities and prolonged water scarcity periods are two of the most serious problems associated with climate change (Adusumalli & Arora, 2015). Water resources will be affected in both quantity and quality, and hence water, stormwater and wastewater infrastructure will face greater damage risk. The effect of climate change will manifest from difficulties in operations to disrupted services and increased cost of water and wastewater services. Governments and water managers will therefore have to re-examine development processes for municipal water services and adaptation strategies and incorporate climate change into infrastructure design, operation and maintenance. The expected climate change impacts involve an increase in precipitation intensities, direct runoff as well as quick rise in stream flow and depletion in groundwater table, which are similar to urbanization impacts on the water cycle. Similarly, due to the increase in impervious areas and construction of stormwater drainage networks that shorten the period of concentration and increase direct runoff, this results in a sharp rise in stream flow and depletion of groundwater table (Herath & Musiake, 1994). Hence, experiences and methods adopted for coping with water management in the context of urbanization can also be used for adaptation.
It is inappropriate to seek large scale investments for stormwater management, especially under the large degree of uncertainty associated with climate change. Therefore ‘soft’ measures such as infiltration trenches, landscaping and preservation of natural water bodies in reducing urban flood risks are imperative. Onsite measures are one of the soft measures that can be adopted readily under an uncertain future climate. For example, incorporating storage facilities into city planning can prolong the time of concentration together with infiltration facilities to infiltrate excess rainfall runoff from rooftops and paved areas to ultimately reduce the direct runoff volume (Herath et al., 2012). Such onsite facilities recover the pre-global change infiltration and retention functions as well as help revert the hydrological cycle to its original state. Pavement materials, drainage components as well as storage systems have been developed to improve efficiency and effectiveness to address urbanization through onsite measures. This research proposes adopting a similar kind of development for climate change in order to restore the local water cycle, and investigates the stability of the local water cycle as the target for sustainable urban stormwater management. This requires taking an integrated approach to stormwater management by managing the total hydrological cycle. The overall objective of this study is to review and analyse various on-site measures that can help restore the water cycle to the pre-climate change state, and reduce flooding due to future climate uncertainty.
Climate projections are used to understand the expected impact of climate change on different sectors of a country. Climate projections are synthetic time series of climate variables with the goal that such time series statistics will match real world data. The climate projections can be for past, current as well as future conditions. Global Climate Models (GCMs) simulate the response of greenhouse gas concentrations and provide estimates of climate variability such as temperature and precipitation (Mishra & Herath, 2011). The latest generation of state-of-the-art Earth System General Circulation Models (ES-GCMs) has recently been used to carry out simulations of a new set of scenarios for Coupled Model Intercomparison Project Phase 5 (CMIP5) (Taylor, Stouffer, & Meehl, 2012). The CMIP5 simulations include four future emission scenarios referred to as representative concentration pathways (RCPs): one mitigation scenario (RCP2.6), two medium stabilization scenarios (RCP4.5/RCP6) and one very high emission scenario (RCP8.5). GCM outputs are often not suitable for direct application to assess climate change impact at the local level due to their oversimplification of coarse resolution input information, resolving equations and other factors. To bridge the gaps between the scale of GCMs and local scales, and to account for inaccuracies in describing precipitation extremes, downscaling methods are commonly used in climate change studies. Dynamic downscaling and statistical downscaling are the two most common methods used in literature. Dynamic downscaling includes nesting of high-resolution Regional Climate Models (RCMs) with GCMs, which ensures consistency between climatological variables, yet are computationally demanding. On the other hand, statistical downscaling methods use statistical relationships between large-scale climate variables (predictors) and local-scale climate variables (predictant) and hence require less computation (Willems & Vrac, 2011).
Assessment of extreme precipitation events is an integral part of stormwater risk analysis and design. Design precipitation, the maximum amount of precipitation for a given duration and a return period, is often required for the design of different hydraulic structures. Frequency analysis is commonly used to estimate the design precipitation for a given duration and for a selected return period when there are adequate annual extreme precipitation intensity data records available. Results of the frequency analysis are commonly presented in the form of Intensity-Duration-Frequency (IDF) curves (Nhat, Tachikawa, Sayama, & Takara, 2007). In many cases (including this study), very little short duration extreme precipitation data was found, hence temporal downscaling was carried out. Different approaches have been used to detect temporal scaling properties of precipitation. Scaling theory is applied for deriving the short duration precipitation intensities from daily precipitation data. Menabde, Seed, and Pegram (1999) applied the simple-scaling theory to describe precipitation IDF in Australia and South Africa. Bara, Kohnova, Gaal, Szolgay, and Hlavcoval (2009) applied the simple scaling theory to the IDF characteristics of short duration precipitation in Slovakia. The analysis of scaling properties of extreme precipitation processes observed at a given site was based on the examination of scaling behaviour of the statistical moments of precipitation data over different durations using the simple scaling framework.
Computer-based modelling is utilized to assess and analyse the flood hazard and vulnerability, and also helps in comprehending the magnitude and frequency of the event (Mishra, 2017; Saraswat et al., 2016). In recent years, two-dimensional models have mainly been employed to simulate urban storm-water flood problems. Tools such as HEC-HMS, SWMM, MIKE are widely used to model urban drainage systems (Elliott & Trowsdale, 2007), and such models provide good representations of physical phenomena. Geographic Information Systems (GIS) are commonly used to collect and manage the spatial data required as input for models (Heaney, Sample, & Wright, 2001). Through the modelling results, different adaptation measures can be selected to assess the effectiveness of reducing risk exposure. Hydrological changes due to urbanization have been extensively studied in the past (Weesakul, 2010; Suriya & Mudgal, 2010; UNISDR, 2012); however, very few studies cover the quantitative optimization of stormwater capture measures in urban areas due to climate change (Herath et al., 2012).
Study area
Urbanization in Tokyo caused changes in the water cycle due to the reduction of forests as well as conversion of paddy fields to new towns or residential areas, impacting the water retention capacity of the land surface (Nakao & Tanimoto, 1997). Consequently, surface runoff has been increasing progressively through urbanization. Tokyo Metropolitan Government has been widening rivers to accommodate excessive precipitation. In order to prepare for the possible additional precipitation under climate change, alternative measures such as infiltration pits and rainwater harvesting systems have to be implemented, which can also be beneficial to the water cycle. Tokyo presents typical characteristics of urban areas: low land, dense population, valuable assets, and intensive on-land and underground infrastructures. The city is one of the busiest zones in the world, highly urbanized and highly vulnerable to flood risk (Unno & Maeda, 2004). Moreover, lying in the humid subtropical climate zone, Tokyo experiences very intense precipitation and typhoons every year. Many flood disasters have occurred due to typhoons, heavy rains and storm surges. While progress in river improvements is ongoing, the risk of heavy rains exceeding the current protection level has risen in recent years, and Tokyo still experiences flood disasters frequently.
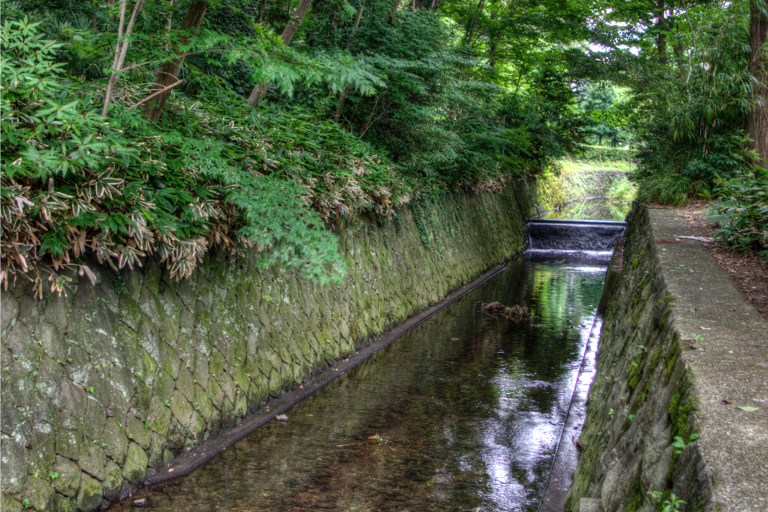
As a result, from the realization of the problems and challenges, various moves have begun toward resolving the problems related to urban flood risk. Infiltration and storage facilities have been installed in the Yato River catchment to increase the infiltration capacity of the area, to cut the peak discharge and maintain a good balance in the city’s water cycle. Such facilities still offer high potential as a measure to reduce flood risk. This study investigated on-site measures to simulate and test adaptation strategies to reduce climate change-induced floods and water scarcity to cope with future climate uncertainty in the Yato Watershed. The Yato Watershed, situated in Setagaya Ward, Tokyo, Japan (Figure 1), with drainage area of approximately 3 km2 is a tributary of the Tama River. The river flows southwards with a total length of 3.3 km and is urbanized. Yato River is a typical urban river with a concrete bank in the form of an open ladder-type ditch over most of the river length, except the section flowing through Kunita Park which is in the shape of a natural stream. The watercourse in some parts is “invisible” as it flows underground (under highways, or pedestrian concourses) in the form of a closed culvert. Land-use land-cover maps for the simulation period were reclassified based on 2006 and 2011 land-use maps. Land-use maps include eight categories listed in Figure 1. Removal of vegetation, increased imperviousness and drainage channels are characterized by high flow peaks and fast response to even minor precipitation events. There are four types of soil in Yato Watershed: Kanto loam, Alluvial lowland, Kazusa group, and Shimosa layer group (Penh, 2012). Most of the area is covered by Kanto loam, which consists of volcanic ash, a suitable type of soil for infiltration. Under the impact of climate change, precipitation intensity increases and the return period declines in the future (Herath et al., 2012).
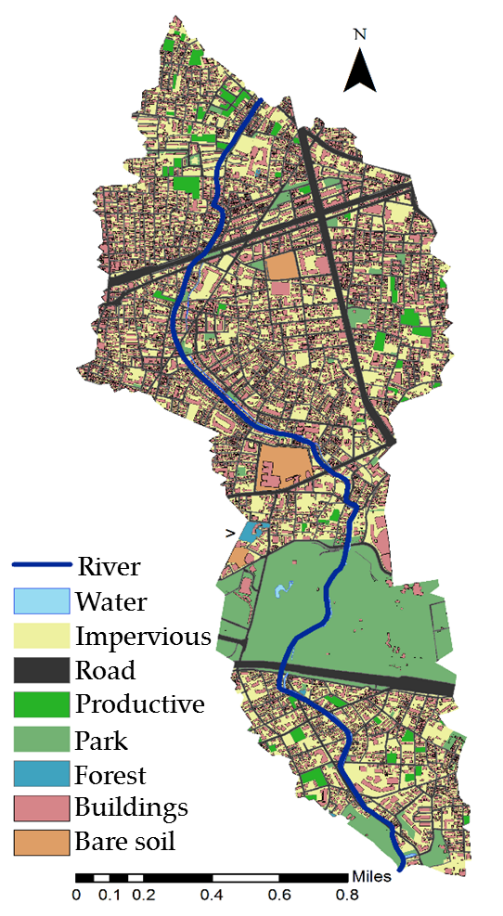
Figure 1. Yato Watershed and its various types of land use.
Methodology
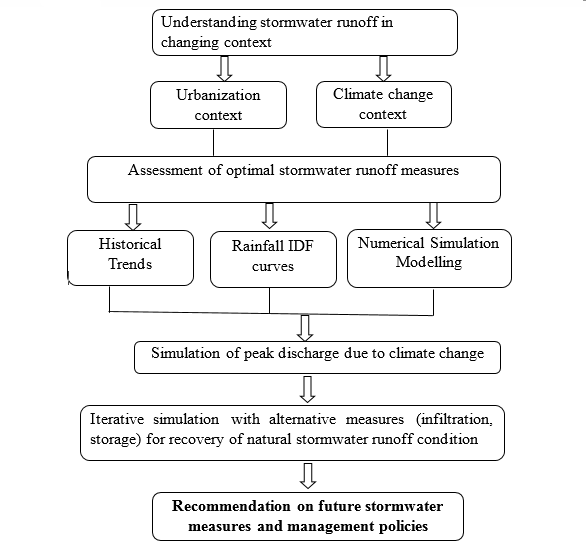
This study blends meteorological, hydrological, engineering and socioeconomic research to provide methodologies and a framework useful for strategic planning to address water management in urban areas under climate change and urbanization. The research combined climate change risk quantification, physical process simulation and decision making for water management planning and implementation in the urban watershed context. In this study, GCM precipitation output from GFDL-CM3 and MRI-CGCM3 with RCP8.5 emission scenario were employed to assess the impact of climate change on precipitation patterns over the Yato Watershed. These GCMs were selected for the study due to its easy accessibility and high temporal resolution (3-hour) for the analysis period. The RCP8.5 corresponds to the pathway with the highest radiative forcing or greenhouse gas emissions compared to the other RCPs. Moreover, the RCP8.5 scenario was selected to study the extreme precipitation events in the future as present emission scenarios are already either following or very close to the RCP8.5 (Sanford, Frumhoff, Luers, & Stanford, 2014). Observed precipitation data from 1976 to 2005 were compared with the corresponding GCM precipitation data for identifying the biases. Next, quantile-based bias correction was employed to correct the GCM precipitation data from 2071 to 2100 as the future climate for impact assessment. Furthermore, a simple scaling technique was applied to derive the short-duration precipitation intensities from available precipitation data. The scaling behaviour of observation precipitation intensities was examined, and it was revealed that the statistical properties of observation precipitation follow the assumption of simple scaling. The comparison of IDF curves for present and future climate indicated a significant increase in maximum precipitation intensities, which has major implications on planning and design of urban stormwater drainage systems. In order to understand the change in peak discharge at the outlet caused by increased extreme precipitation, HEC-HMS was utilized to simulate the rainfall-runoff model at the Yato catchment. Major steps involved in carrying out this study are described below (Figure 2).
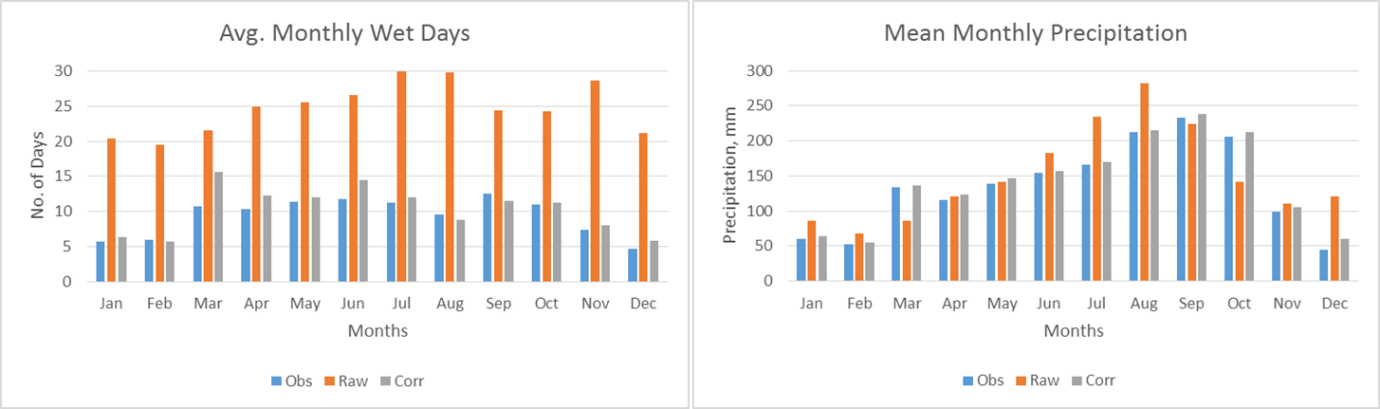
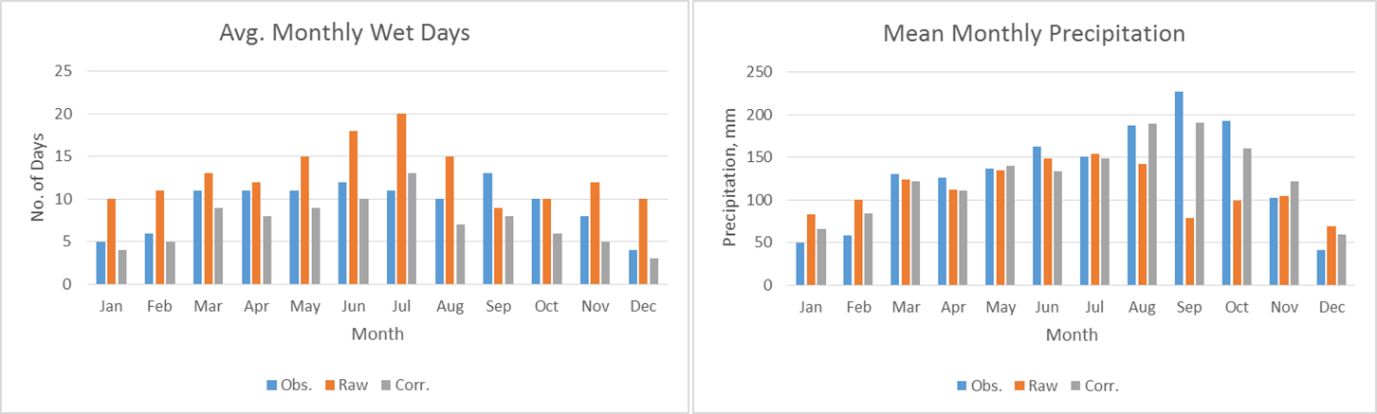
1. GCM outputs were analysed and evaluated to establish the validity of the GCM simulations at the local context. GCM outputs underwent two inherent drawbacks, namely coarse resolution and biases in their frequencies/magnitudes which warrant that GCM output should not be used directly at the local scale. The drawbacks were minimized using quantile-quantile bias correction technique (statistical downscaling). In this technique, simulated changes in the daily frequency distribution of GCM precipitation are applied to observation precipitation (Mpelasoka & Chiew, 2009). This method consists of two steps: (1) truncating GCM precipitation data below a threshold value corresponding to non-exceedance probability of zero observational precipitation value; and (2) matching cumulative distribution function (CDF) of truncated GCM data series and observation data series by taking the inverse CDF of the GCM data with observational shape and scale parameters. The comparison (visual and relative error) of average monthly wet days and precipitation amount for raw and corrected GCM daily precipitation outputs with those of the observation data used to measure the performance of the downscaling A smaller error is expected in the case of corrected GCM.
2. Hydrological regime was analysed using HEC-HMS (Hydrologic Engineering Centre – Hydrologic Modelling System) developed by the US Army Corps of Engineers to establish catchment scale water cycle for the current and future HEC–HMS supports both lumped and distributed parameter modelling. The HEC–HMS model was calibrated and validated for isolated precipitation events. The event-based simulations employed the Natural Resource Conservation Service (NRCS) loss method to compute infiltration and unit hydrograph method to transform excess precipitation into a runoff. The NRCS method uses a curve number (CN) that depends on land-use, hydrological soil groups and antecedent soil moisture. Simulated river discharge with observed was compared, and the best fit was obtained by adjusting model parameter values. The stormwater modelling result was evaluated by visual inspection and using the Nash-Sutcliffe (NS) efficiency which indicates the degree of match between observed and simulated flows (Nash & Sutcliffe, 1970). Past studies have shown that these methods were successfully used to analyse goodness of fit. The NS values can vary from 0 to 1, with 1 indicating a perfect fit of the data. Calibration of the model was carried out using data on 24-hour precipitation with 10-minute interval for 24th August 2009. In order to validate the calibrated model, another set of 24-hour precipitation data with 10-minute interval for 3rd December 2010 was used. First, the model was run with the model input values. This was followed by varying each input parameter within the prescribed range keeping the others constant and running the model.
3. Performance of on-site facilities and development of optimum adaptation strategies were analysed using HEC-HMS stormwater model coupled to onsite facility performance at the grid level. Combination of storage facilities and infiltration are proposed in developing a flood control plan to reduce the flood peak in future. Several simulations were carried out iteratively for on-site facility installations until the hydrologic cycle for pre- and post-climate change period were similar.
4. Previous reports on perception on alternative infiltration and storage facilities were reviewed to understand the local cultural values and perception as well as willingness of the locality to install the infiltration facilities to reduce urban flood risk and improve the urban water balance (Penh, 2012).
Results and Discussion
Bias correction
This study utilized the quantile-quantile bias correction technique which reduces biases from the entire frequency distribution of a variable. The technique has shown to be very effective in removing biases from GCM outputs while retaining changes in precipitation frequency and variability (Mansoor, Mishra, & Herath, 2015; Mishra & Herath, 2014). In the beginning, GCM precipitation output of MRI-CGCM3.2 and GFDL-CM3, each for RCP8.5 scenario were evaluated with the observed precipitation data to obtain a better result. Two-parameter gamma distribution was used for frequency distribution analysis. Figures 3 and 4 show the comparison of monthly average wet days and precipitation amounts for the two GCMs. Biases in monthly wet days and precipitation amounts have been reduced with the use of a threshold. The observations showed that the proposed bias-correction technique could be reliably used for correcting biases in future GCM outputs with the use of present climate parameters. Such bias-corrected daily GCM precipitation data exhibit far better agreement with the observed precipitation than that of raw GCM.
Precipitation IDF curves
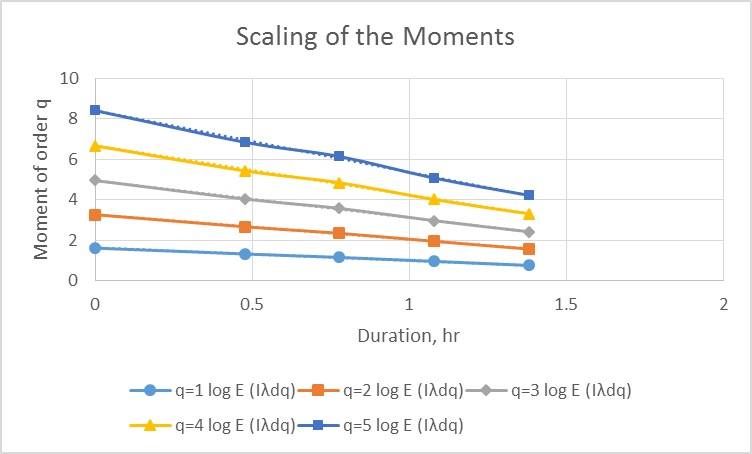
Precipitation Intensity Duration Frequency (IDF) curves for the Yato Watershed were produced to examine any significant deviation in extreme precipitation event pattern in the future due to climate change. Over 30 years of records (1976–2005) of precipitation data of the Yato Watershed were collected for confirming the simple scaling properties. Precipitation intensities of 1-, 3-, 6-, 12- and 24-hour durations were tested to investigate the scaling properties as sub-daily precipitation was unavailable. A log-log plot of the moments against their durations was examined for moment order q=1, 2, 3, 4 and 5. Figure 5 illustrates the qth moment of the precipitation intensities (mm/h) against different durations. With the application of the simple scale scaling model for precipitation intensities at the Setagaya precipitation station, the scale factor was estimated to be 0.6012.
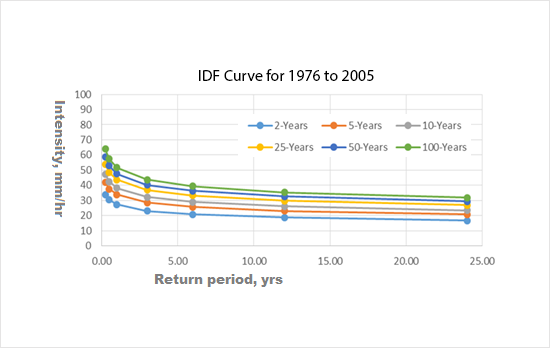
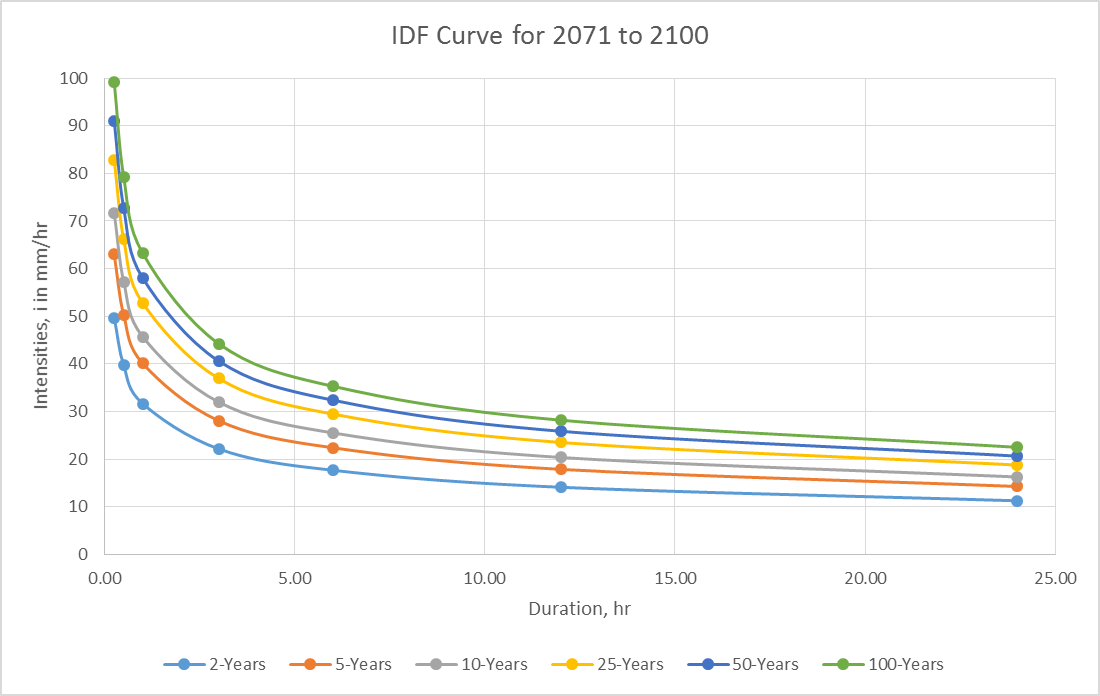
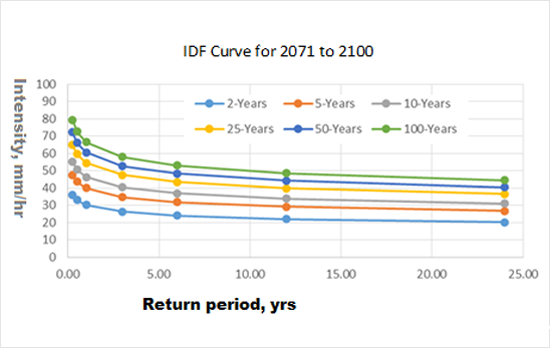
Using the Gumbel distribution (Koutsoyiannis, 2004), the precipitation IDF for different duration (1-, 3-, 6-, 12- and 24-hrs) precipitation intensities and precipitation IDF curves for 2-, 5-, 10-, 25-, 50- and 100-year return periods for present (1976-2005) and future (2071-2100) climates (Figures 6–8) were estimated. From the IDF curves we can observe that, for all return periods and all durations, the precipitation intensities are significantly greater for the future climate than the present climate. The calculations revealed that there would be an average increase of 6% to 25% in extreme precipitation intensities. For smaller return periods, the increase (change) in extreme precipitation intensities was found to be smaller. Average increases of 6% and 25% were found for 2-year and 100-year return period values. These observations can have major implications for the design, operation and maintenance of stormwater infrastructures in the Yato Watershed.
Stormwater modelling
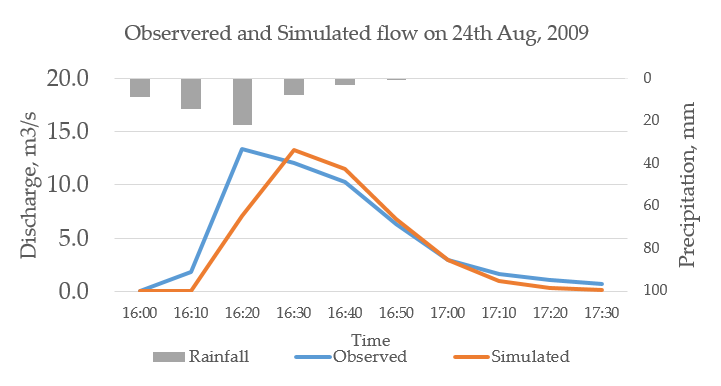
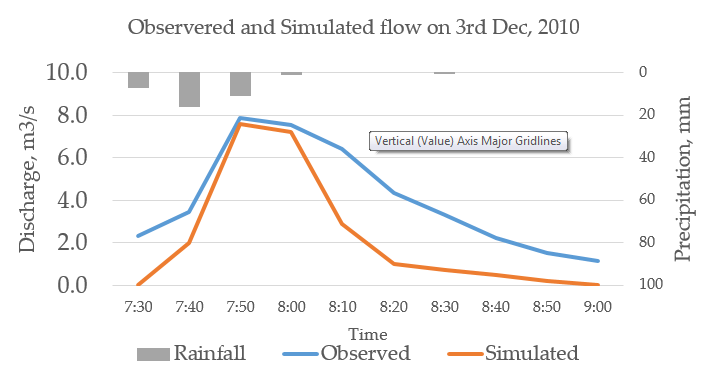
In this study, stormwater modelling was performed primarily to generate flood hydrographs with certain statistical return periods resulting from single design storm events with the same statistical return periods. The HEC-HMS tool was used to perform rainfall-runoff modelling based on a combination of the NRCS Curve Number model and the NRCS Unit Hydrograph model. The model calibration was carried out by adjusting the model parameters until simulated results matched historical data. The process was carried out manually by repeatedly adjusting parameters, computing and inspecting the goodness of fit between simulated and observed hydrographs. Watershed parameters were modified to produce the best fit between model and observation values. Validation results indicate that there is good agreement between the observed and simulated flows. The observed and simulated discharge hydrographs are presented in Figure 9 and Figure 10. The results show that the calibrated model is capable of capturing 24 hours of precipitation and producing satisfactory stream discharge. The NS efficiency values for calibration and validation were found to be 0.77 and 0.56. Usually, NS values greater than 0.5 are considered acceptable. Hence, the model was used to estimate discharge at Yato Watershed outlet for present and future precipitation.
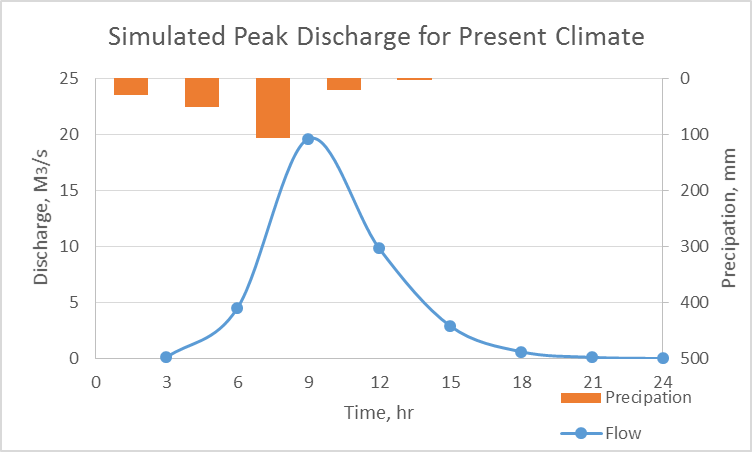
Daily maximums form a 20-year return period were projected for present and future climate scenarios to understand the impacts of extreme precipitation events on flood discharge. Figs. 11-13 show flood hydrographs that the model predicted for the Yato Watershed outlet for a return period of 20 years. From Table 1, the present precipitation leads to a peak discharge of 19.6 m3/s in the Yato River whereas MRI-CGCM3.2 and GFDL-CM3 give peak discharges of 23.6 m3/s and 21.8 m3/s respectively. The flood hydrographs indicated that there would be an increase of 11% to 20% in peak values at the outlet of Yato Watershed when considering climate change.
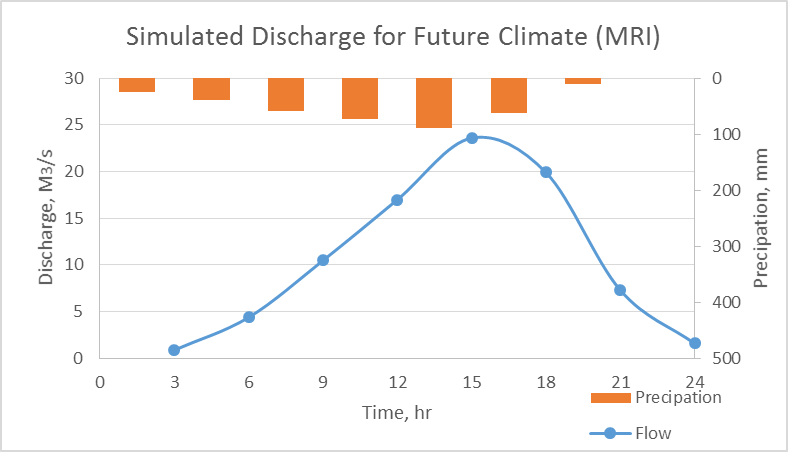
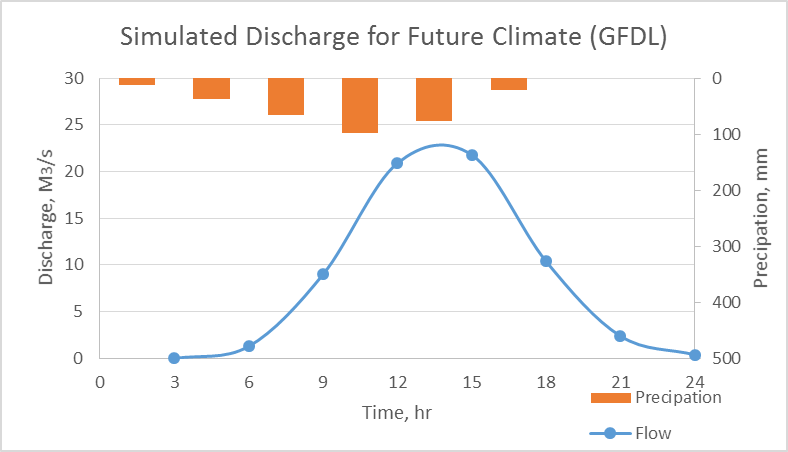
| Simulation | Peak Discharge (m3/s) | Precipitation Volume (1000m3) | Loss Volume (1000m3) | Discharged Volume (1000m3) |
| Present | 19.6 | 754.2 | 347.6 | 406.6 |
| MRI-CGCM3 | 23.6 | 1329.1 | 405.5 | 923.6 |
| GFDL-CM3 | 21.8 | 1105.0 | 388.4 | 716.6 |
Developing alternative on-site measures
Infiltration facilities offer more benefits such as reducing surface inundation, requiring only small underground space, and improving the groundwater table in the sense of improving urban water balance. On the other hand, storage facilities are very effective in controlling river flood. Based on a previous study (Herath et al., 2012), the cost of infiltration facilities is more expensive than the cost of a storage facility at Yato Watershed under various design precipitation intensities. Further, the study shows that the total cost of the combined facilities will be more than constructing either storage facilities or infiltration facilities. Therefore, the combination of storage facilities and infiltration facilities is the best option economically. Thus, considering the flood control efficacy, economic outlay and environmentally-friendliness, a combination of infiltration and storage facilities should be considered. In developing a flood control plan to reduce flood peaks in the future, a combination of storage facilities and infiltration were taken into account. From the land-use planning perspective, Kinuta Park is in a good strategic location for building a storage facility. Volume calculations suggested that a storage facility (Location: 35° 37′ 51.5″N 139° 37′ 0.4″ E) with a maximum of 180,163.14 m3 can be built in Kinuta Park. Table 2 gives a summary of simulations carried out with the proposed storage facility at Kinuta Park. Stormwater simulations revealed that the storage facility alone is inadequate for reducing the future peak discharge to the present level of peak discharge. Therefore, the average Curve Number (CN) of Yato Watershed has to be lowered by 1.15% to 6.65%. This translates as an expansion of the infiltration facilities in the area. The types of infiltration facilities that can be installed in the catchment depend on the land use, and residential areas, public facility areas, green areas, and roads are suitable.
| Simulation | Peak Discharge (m3/s) | Precipitation Volume (1000m3) | Loss Volume (1000m3) | Discharged Volume (1000m3) | Change in CN no. |
| MRI-CGCM3 | 19.5 | 1329.1 | 832.6 | 496.5 | 1.15% |
| GFDL-CM3 | 19.6 | 1105.0 | 691.4 | 413.6 | 6.65% |
Conclusion
The general characteristics of precipitation over the Yato Watershed, Tokyo have been studied, and a synthetic design storm pattern has been developed that accounts for climate change. Climate change considerations were reflected in the design precipitation pattern, which shows that intensity increases the most. The predicted amount of precipitation from the quantile mapping method and the number of wet days computed are notably close to the observations. Further, this method accurately captured extreme values of precipitation for all GCMs. Given there is large uncertainty in the projected precipitation intensity of these climate models, developing an ensemble model by incorporating all climate models, performing an uncertainty analysis, and creating probability-based IDF curves offers a solution to reduce this uncertainty. Comparison of IDF curves for present and future climates indicated a significant increase in maximum precipitation intensities, which has major implications for planning and design of urban stormwater drainage systems. Integration of runoff CN values offers a useful technique for identifying suitable infiltration measures (surface materials) and their locations during urban planning, in order to reduce urban floods and increase groundwater recharge. The results of this study are of significant practical importance for the design, operation, and maintenance of stormwater management infrastructures under a changing climate scenario. The results will also help local governments incorporate strategic decisions in response to climate change in a consistent framework and investigate technologies suited for water management from both short- and long-term perspectives.
Promotion of rainwater storage and infiltration facilities will contribute to a well balanced hydrological system as well as reduction in global warming impact. Countermeasures for urbanization or drainage and storage of excessive precipitation during the wet season can be introduced to cope with floods and simultaneously compensate for water scarcity during the dry season and restore the water cycle to its original state. Thus, the incremental flood and water scarcity problems brought about by climate change can be addressed.
Considering the substantial uncertainty associated with the climate change projections for different GCMs and RCPs, selection and use of GCMs and RCPs can be further explored. The key to any stormwater management practice is community acceptance, and various studies have shown that the more aware a community is of the advantages, maintenance and operation problems, the more willing they are to contribute in any form, thus it is vital to involve the community as an integral part of any new stormwater management policy. This study was initially intended as part of a broader-based socio-economic component study context, and was compiled based mainly on previous studies and reports.
Acknowledgement
The authors would like to acknowledge various students and staff of the United Nations University, Tokyo, Japan; Asian Institute of Technology, Bangkok, Thailand; and Institute of Meteorology, Hydrology and Environment, Vietnam as well as local experts in the study cities for their collaboration and suggestions in completing the project successfully. We would also like to thank the Asia Pacific Network for Global Change Research (APN) for financially supporting this project (ARCP2014-20NMY-Mishra): Climate Change Adaptation through Optimal Stormwater Capture Measures: Towards a New Paradigm for Urban Water Security.
References
- Adusumalli, M., & Arora, K. (2015). Towards sustainable community and institutional response to climate extremes: a situational analysis of institutions, communities and their response to climate change induced disasters in Uttarakhand. European Scientific Journal, ESJ, 11(10).
- Bara, M., Kohnova, S., Gaal, L., Szolgay, J., & Hlavcova, K. (2009). Estimation of IDF curves of extreme rainfall by simple scaling in Slovakia. Contributions to Geophysics and Geodesy, 39(3), 187-206.
- Elliott, A. H., & Trowsdale, S. A. (2007). A review of models for low impact urban stormwater drainage. Environmental modelling & software, 22(3), 394-405.
- Heaney, J.P., Sample, D., & Wright, L. (2001). Geographical Information Systems Decision Support Systems, and Urban Management. US Environmental Protection Agency.
- Herath, S., Penh, S., Okui, H., Imbe, M., & Kitagawa, Y. (2012). Centralized and decentralized urban flood control measures under physical and societal constraints. In Proceedings of 11th International Symposium on New Technologies for Urban Safety of Mega Cities in Asia, October (pp. 10-12).
- Herath, S., & Musiake, K. (1994). Simulation of basin scale runoff reduction by infiltration systems. Water Science and Technology, 29(1-2), 267-275.
- IPCC (2014). Climate Change 2014, Synthesis Report, Contribution of Working Groups I, II and III to the Fifth Assessment Report of the Intergovernmental Panel on Climate Change. IPCC, Geneva, Switzerland, pp. 151.
- Koutsoyiannis, D. (2004). Statistics of extremes and estimation of extreme rainfall: I. Theoretical investigation/Statistiques de valeurs extrêmes et estimation de précipitations extrêmes: I. Recherche théorique. Hydrological Sciences Journal, 49(4).
- Luo, P., He, B., Takara, K., Xiong, Y. E., Nover, D., Duan, W., & Fukushi, K. (2015). Historical assessment of Chinese and Japanese flood management policies and implications for managing future floods. Environmental Science & Policy, 48, 265-277.
- Mansoor, A., Mishra, B.K., & Herath, S. (2015). Assessing impacts of climate change on rainfall extremes for sustainable stormwater management in Yato Watershed, Tokyo, Towards Urban Water Security in Southeast Asia: Managing Risk of Extreme Events. International Expert Workshop, pp. 213-223.
- Menabde, M., Seed, A., & Pegram, G. (1999). A simple scaling model for extreme rainfall. Water Resources Research, 35(1), 335-339.
- Mishra, B. K. (2017). Precipitation change assessment over upper Bagmati river basin using regional bias corrected GCM data. International Journal of Water, 11(3), 294-313.
- Mishra, B. K., & Herath, S. (2014). Assessment of future floods in the Bagmati River Basin of Nepal using bias-corrected daily GCM precipitation data. Journal of Hydrologic Engineering, 20(8), 05014027.
- Mishra, B. K., & Herath, S. (2011, October). Climate projections downscaling and impact assessment on precipitation over upper Bagmati River Basin, Nepal. In Third International Conference on Addressing Climate Change for Sustainable Development through Up-Scaling Renewable Energy Technologies (pp. 275-281).
- Mpelasoka, F. S., & Chiew, F. H. (2009). Influence of rainfall scenario construction methods on runoff projections. Journal of Hydrometeorology, 10(5), 1168-1183.
- Nash, J. E., & Sutcliffe, J. V. (1970). River flow forecasting through conceptual models part I—A discussion of principles. Journal of Hydrology, 10(3), 282-290.
- Nhat, L. M., Tachikawa, Y., Sayama, T. & Takara, K. (2007). Regional rainfall intensity-duration-frequency relationships for ungauged catchments based on scaling properties. Annual Report of Disaster Prevention Research Institute, Kyoto University, 50B, 33-43.
- Nakao, T., & Tanimoto, K. (1997). Comprehensive flood control measures in the Tsurumi River Basin in Japan. Water International, 22(4), 252-258.
- Penh, S. (2012). Assessing Combined Use of Infiltration and Storage Facilities under Physical and Social Constraints for Urban Flood Control (Master Thesis). United Nations University, Tokyo, Japan.
- Saraswat, C., Kumar, P., & Mishra, B. K. (2016). Assessment of stormwater runoff management practices and governance under climate change and urbanization: An analysis of Bangkok, Hanoi and Tokyo. Environmental Science & Policy, 64, 101-117.
- Sanford, T., Frumhoff, P. C., Luers, A., & Gulledge, J. (2014). The climate policy narrative for a dangerously warming world. Nature Climate Change, 4(3), 164.
- Suriya, S. & Mudgal, B. V. (2010). Impact of urbanization on flooding: Tirusulam watershed a case study, The changing physical and social environment: Hydrologic impacts and feedbacks. In Hydrology Conference 2010, California, USA.
- Taylor, K. E., Stouffer, R. J., & Meehl, G. A. (2012). An overview of CMIP5 and the experiment design. Bulletin of the American Meteorological Society, 93(4), 485-498.
- Weesakul, U. (2010). Influence of deforestation on climate change: Future water availability in Chi and Mun river basins. In Meeting Climate Change Challenges in Transboundary Basins: Role of Sciences (pp. 213-224). United Nations University.
- Willems, P., & Vrac, M. (2011). Statistical precipitation downscaling for small-scale hydrological impact investigations of climate change. Journal of Hydrology, 402(3-4), 193-205.
- UNISDR. (2015). Sendai framework for disaster risk reduction 2015–2030. United Nations Office for Disaster Risk Reduction (UNISDR): Geneva.
- UNISDR. (2012). Annual Report. The United Nations Office for Disaster Risk Reduction. Geneva, Switzerland.
- Unno, S. & Maeda, S. (2004). Comprehensive water management toward the sound water cycle in the river basin taking the Tsurumi river as example. In Proceedings of the APHW. Retrieved from http://rwes.dpri.kyoto-u.ac.jp/~tanaka/APHW/APHW2004/proceedings/FWR/56-FWR-M157/56-FWR-M157MS.pdf (accessed on March 1, 2019)
- Yilmaz, A. G., Hossain, I., & Perera, B. J. C. (2014). Effect of climate change and variability on extreme rainfall intensity–frequency–duration relationships: a case study of Melbourne. Hydrology and Earth System Sciences, 18(10), 4065-4076.