A framework for water security assessment at basin scale
Keywords
Basin-scale analysis · DPSIR framework · Indicator-based methodology · Water security assessment · Water security index
Highlights
- An operational framework to assess water security was developed.
- The framework includes five dimensions and eight indicators.
- The framework results in a quantifiable water security index.
- The study informs decision-making for practical enhancement of water security.
1. Introduction
Water is at the heart of basic human security—food, energy, culture, aesthetics. How water is managed will have repercussions on almost every aspect of human security, which is why achieving adequate water security is among the top priorities of government policies across the globe. While formulating policies to enhance water security are important, even more crucial is monitoring the changes brought about by implementing these policies. As the adage goes, “we cannot manage what we cannot measure”. In today’s time, operationalizing water security is becoming urgent. Water security assessment frameworks, therefore, need to have the potential to monitor the plans and policies that are taken to ensure water enhancement. Such plans and policies are usually implemented within administrative or hydrological boundaries within a country. Therefore, the objective of this study was to develop a framework for water security assessment at a basin level that would subsequently inform decision making on enhancing water security.
Measuring water security is not new. A number of studies have done so at different scales (e.g. Falkenmark, 1989; Gleick, 1990; Heap, Kemp-Benedict & Raskin, 1998; GWP, 2000; Sullivan, Meigh, & Giacomello, 2003; Zeitoun, 2011; ADB, 2013; Srinivasan, Konar, & Sivapalan, 2017; Varis, Keskinen, & Kummu, 2017; Zende, Patil, & Patil, 2018, Jensen & Wu 2018; among others). Most of these assessments are made at a national or regional scale and consider specific aspects of water security. For example, the work of Falkenmark (1989) was associated mostly with water scarcity and proposed the widely accepted water stress indicator. Similarly, Sullivan, Meigh, and Giacomello (2003) also worked on the water scarcity aspect proposing the water poverty index as a measure of scarcity. Srinivasan, Konar, and Sivapalan (2017) argued for a case of assessing dynamic water security to account for human adaptation to environmental change and increasing spatial specialization in the modern world. Jensen and Wu (2018) focused on the water security of urban areas. A common feature with these assessments of water security is the use of simple (but effective) indicators, which help in quantifying the various aspects of water security. However, very few studies (e.g. ADB, 2013) have attempted to capture multiple perspectives of water security into an assessment. This study builds on previous work on water security by firstly evaluating the water security at a basin-scale to account for hydrological boundaries and, secondly, considering all the relevant components of water security that are applicable at a basin level.
2. Methodology
The study began with a thorough literature review on water security assessments to develop an academic context of the subject matter. In order to get a sense of the “operational” context of water security, stakeholder consultations with various government and non-governmental agencies were conducted in India, Thailand and Vietnam. The feedback received from the stakeholders was amalgamated with scientific understanding to arrive at a first draft of the water security framework. This draft framework was again presented to the stakeholders to solicit critical feedback, especially for the operationalization potential of the water security assessment. The framework was then fine-tuned to account for the critical feedback received from stakeholders and finalized.
The project used the DPSIR (Driving forces– Pressure–State–Impact–Response) approach to develop the framework for water security assessment. The DPSIR approach was developed in the late 1990s and proposed by the Organization of Economic Co-operation and Development (OECD, 2003) to show the cause-effect relationships between environmental and human systems. The DPSIR approach has been widely used for monitoring and evaluation studies in a wide variety of sectors such as environmental management (e.g. Malekmohamaddi &Jahanishakib, 2017); forestry (e.g. Scriban, Nichiforel, Bouriaud, Barnoaiea, & Barbu, 2017); urban infrastructure (e.g. Spanò, Gentile, Davies, & Lafortezza, 2017); climate change mitigation (e.g. Zhou, Singh, Wu, Sinha, & Frostell, 2015); hydrology (e.g. Sun, Wang, Liu, Cai, & Xu, 2016), among others. Details of the DPSIR approach can be found elsewhere (e.g. Tscherning, Helming, Krippner, Sieber, & Paloma, 2012).
The water security assessment framework developed in the study has an overall water security index (WSI) that comprises of various water security dimensions. These dimensions take into account the various driving forces that have an impact on water security. Each dimension is represented by one or more indicators. The indicators conform to the SMART (specific, measurable, attainable, relevant and time-bound) criteria of assessment. Each indicator is then measured with respect to specific variables. The framework is presented in Figure 1.
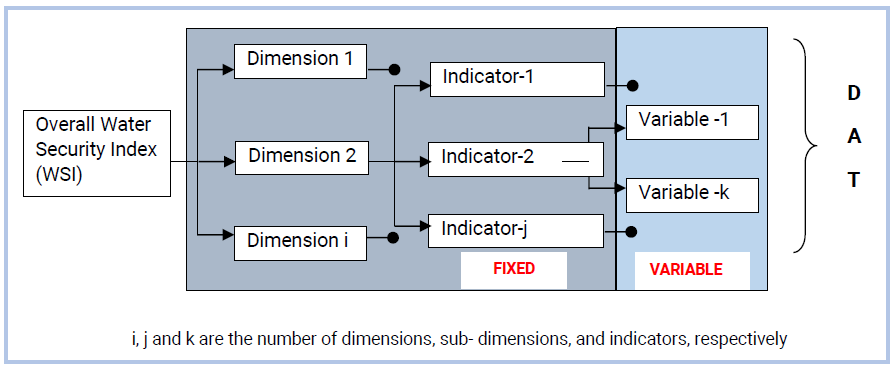
The framework has two shaded portions. The portion shaded in grey is the generic (and fixed) part of the framework, which will be applicable to a geographic area. The portion shaded in blue is the variable part of the framework that will depend on site-specific conditions and data availability.
In order to assess water security, it is important to first quantify it. Hence, all the variables suggested in the framework are quantitative in nature. The variables are to be normalized in the range 1 to 5 in order to facilitate easy interpretation of the water security index. This normalization can be based on threshold/reference values from literature, expert opinion or other sources. For example, ADB’s Asian Water Development Outlook (ADB, 2013) recommends a score of 1, 2, 3, 4 and 5 for agricultural water productivity (agricultural revenue/agricultural water use) corresponding to 0-0.1; 0.1-0.2; 0.2-0.35; 0.35-1; and >1 USD/m3 respectively. It is important to note that for this study the threshold/reference values may change from place to place because the objective of developing this framework is not for comparison/benchmarking purposes. Rather, it has been developed to facilitate operationalization of water security, which will depend upon the environment in which it is being operationalized.
In order to quantify water security, an aggregation method is used. The variables measuring each indicator are normalized between the range 1 and 5 by using reference values from literature, logical deductions, and expert opinion. These are then aggregated together using equal weights. This implies that each variable contributing to an indicator is equally important. However, if there is a case where one of the variables is more significant than the other, weights in proportion to significance can be used. The aggregation of variables will result in each indicator receiving a score between 1 and 5. Using a similar procedure, the indicators are aggregated into dimensions, and dimensions into the overall WSI which will also have a score between 1 and 5.
3. Results and Discussion
Table 1 presents the framework developed for basin-scale assessment. The framework comprises of five dimensions and eight indicators. Following is a description of the framework.
| Dimension | Indicator | Potential variables | Suggested ways to measure |
| Water availability | Sustainable basin exploitation | 1. Per capita water availability | Surface runoff/Population (Falkenmark, 1989) |
| 2. Water scarcity | Annual per capita water resources availability (Babel and Wahid, 2008) | ||
| 3. Water variation | The coefficient of variation of precipitation over the last 50 years (Babel and Wahid, 2008) | ||
| Water productivity | Economic value of water | 1. Commercial/industrial revenue per drop | Non-agricultural GPP/Non-agricultural water use in the basin (ADB, 2013) |
| 2. Agricultural, aquaculture and livestock revenue per drop | Agricultural, aquaculture and livestock GPP/ Agricultural, aquaculture and livestock water use in the basin (ADB, 2013) | ||
| Water-related disasters | Drought factor | 1. Drought damage | Economic damage caused by droughts |
| 2. Proportional area under drought | Drought area/Total area (Xiao, Li, Xiao, & Liu, 2007) | ||
| 3. Drought occurrence frequency | Number of drought occurrence per year (Koontanakulvong, Doungmanee, & Hoisungwan, 2013) | ||
| 4.Ratio of the area with water-saving irrigation to the total area of arable land | Area of irrigation/ Area of arable land (Xiao, Li, Xiao, & Liu, 2007) | ||
| Flood factor | 1. Flood damage | Economic damage caused by floods | |
| 2. Proportional area of flooding | Flooding area/Total area (Xiao, Li, Xiao, & Liu, 2007) | ||
| 3. Flood occurrence frequency | Number of flood occurrence per year (Koontanakulvong, Doungmanee, & Hoisungwan, 2013) | ||
| 4. Percentage of population living in hazard-prone areas | Population living in hazard-prone areas/Total population (Mehr, 2011) | ||
| 5. Flood control capacity | Ratio of the water reserved in dams at the end of the year to the total water utilization (Xiao, Li, Xiao, & Liu, 2007) | ||
| Watershed health | Health of water bodies | 1. Surface water quality factor | Dissolved oxygen concentration/Permissible limit |
| 2. Groundwater quality factor | Concentration of site-specific pollutants /Permissible limits of these pollutants | ||
| 3. Average class water quality rivers | Country-specific conditions (ADB, 2013) | ||
| 4. Biochemical oxygen demand (BOD) in water bodies | BOD 5-day values of river water samples. (Mehr, 2011) | ||
| Vegetation cover | Natural vegetation factor | Natural vegetation area/Basin area | |
| Water governance | Overall management of the water sector | Institution factor | Questionnaire |
| Potential to adapt to future changes | Adaptability factor | Questionnaire |
Dimension 1: Water availability: Arguably this is the fundamental dimension of water security that is associated with water availability in the basin to sustain all kinds of human activities that include domestic, agriculture, commercial, recreational, and others. The indicator used to represent this dimension is sustainable basin exploitation, which throws light on how much water is available in the basin to sustainably carry out various activities. There are a number of variables reported in the literature that can measure this indicator. A commonly used one is ‘per capita water availability’ introduced by Falkenmark (1989) that calculates the total annual renewable water resources per capita (m3/capita/year). Babel and Wahid (2008) used the water scarcity variable that relates water resources with population and is defined as the ratio of Falkenmark’s threshold (1,700 m3/person/year) for water stress and annual per capita water resources availability in the basin. Babel and Wahid (2008) also used the ‘water resources variation’ variable to depict the water availability situation in the basin. Variation of water resources over the years determines the reliability of annual available water resources. To reflect the long-term variation of water resources, they used the coefficient of variation of rainfall over the previous 30 years and setting 0.30 as the critical level of variation.
Dimension 2: Water productivity: This dimension considers the economic aspect of water security. It seeks to evaluate the economic value of the water used for all commercial activities in the basin. A single indicator, ‘economic value of water’, has been identified to represent this dimension. This indicator is expected to throw light on how judiciously is water used in terms of economic benefits. Two variables have been suggested to measure this indicator. Both have been used in the Asian Water Development Outlook (2013) for national-scale assessments. The first is ‘commercial/industrial revenue per drop’, which calculates the revenue generated by the commercial/industrial sector water use (USD/m3). In basins where agriculture is a major sector, the ‘agriculture, aquaculture and livestock revenue per drop’ could be a very significant variable.
Dimension 3: Water-related disasters: This dimension is intended to capture the effects of floods and droughts in the basin. Hence, two indicators have been used to represent this dimension. The first indicator is the ‘drought factor’ to evaluate the effects of droughts in the basin, and the measures taken to mitigate the impacts. Among the potential variables to measure this indicator is ‘drought damage’ which takes into account the economic losses (e.g. in USD) caused by the effects of droughts. Another variable to measure the impacts of droughts in terms of spatial coverage is ‘proportional area under drought’ as proposed by Xiao, Li, Xiao, and Liu (2007), which looks at what portion of the total basin area is affected by droughts. Koontanakulvong, Doungmanee, & Hoisungwan (2013) introduced the ‘drought occurrence frequency’ variable which essentially is a count of the number of drought events in a year. Given that droughts are slow-onset events, this variable is likely to be more useful in dry and arid basins. Xiao, Li, Xiao, and Liu (2007) also proposed a proxy variable in the form of ‘ratio of irrigated area to arable area’ to evaluate the measures taken to minimize the effects of droughts. This ratio calculates the portion of the arable area which receives irrigated water from planned supplies. The second indicator is the ‘flood factor’ to evaluate the effects of floods in the basin, and the measures taken to mitigate impacts. The variables used to measure this indicator include ‘flood damage’ to quantify the losses caused by floods; ‘proportional area under floods’ (Xiao, Li, Xiao, & Liu, 2007) that looks at the spatial coverage of flooding events; flood occurrence frequency (Koontanakulvong, Doungmanee, & Hoisungwan, 2013) that provides a count of the number of flooding events; population living in hazardous zones (Mehr, 2011) that provides a count of the number of people living in flood prone areas; and flood control capacity (Xiao, Li, Xiao, & Liu, 2007) that evaluates if the storage capacity of the dams is enough to prevent the onset of a flood.
Dimension 4: Watershed health: This dimension captures the environmental angle of water security in the basin. Two indicators have been used to represent this dimension. The first is ‘health of water bodies’ in the basin, which throws light on the current condition of the major river bodies and groundwater in the basin. A potential variable to measure this indicator is ‘surface water quality factor’ that considers the frequency with which the permissible limit for dissolved oxygen is breached in the water bodies. A similar variable can be used to assess the groundwater situation through the ‘groundwater quality factor’. Another variable as proposed by AWDO (2013) is the ‘average river class’. Most countries categorize their rivers into different classes based on the water quality. Hence, the average class of the rivers in the basin will provide useful information about the overall river health situation in the basin. Mehr (2011) used ‘Biochemical Oxygen Demand’ of surface water to evaluate the river health, which can be used if found appropriate. The second indicator is ‘vegetation cover’ that depicts the state of natural vegetation cover in this basin. This is a new indicator proposed by the study. The premise for including this variable is that in an age of rapid urbanization and economic activities, land use changes have a significant impact on the health of water bodies. The variable used to measure this indicator is ‘natural vegetation factor’ that measures the proportion of the basin area that is covered by natural vegetation.
Dimension 5: Water governance: Although water governance is central to the judicious management of water resources in the basin, it has rarely been considered in water security assessment frameworks in the past. A possible reason for this could be that water governance is implicitly reflected in the assessment of every dimension of water security. However, for this study, we decided to make this important aspect explicit, and assign a dedicated dimension for water governance. This dimension captures the ability of the government to manage the water sector and plan for anticipated changes. Two indicators have been used to represent this dimension. The first of these is the overall management of the water sector that depicts the picture of the overall management of the various elements of the water sector in the basin. The suggested way to measure this is through a questionnaire to evaluate how the management practices of the major water-related institutions in the basin (institution factor). The second indicator is the potential to adapt to future changes that evaluate how well equipped the basin is to cope with emerging pressures on water security. The suggested way to measure this is also through a questionnaire to examine if the plans and policies for water sector development consider long-term drivers of water security.
As described in Section 2, the dimensions and indicators of the water security framework are fixed and can be cross-scaled to any basin of interest. However, the choice of variables (both type and number) depends upon the user and should account for the site-specific requirements and conditions.
Using the aggregation technique described in Section 2, the variables are to be aggregated to arrive at an indicator score between 1 and 5; then the indicators are to be aggregated to represent the dimension score; and finally the aggregation of dimensions will lead to the overall WSI, which will also have a score between 1 and 5.
Hence, WSI = (Score for DIM1 + Score for DIM2 + Score for DIM2 + Score for DIM4 + Score for DIM5) / 5
Where:
DIM1 = Water availability
DIM2 = Water productivity
DIM3 = Water-related disasters
DIM4 = Watershed health
DIM5 = Governance.
The interpretation of the different magnitudes of the WSI is presented in Table 2.
4. Conclusion
Achieving water security is a complex process that requires a holistic understanding and treatment of the various elements (or dimensions) of water security. This study has developed a framework to assess water security with respect to these varied dimensions, at a basin scale. Although the framework has been designed to be generic in nature so that it can be applied in diverse climatic and socioeconomic conditions, it has a provision for site-specific nuances to be reflected in the assessment of water security. In order to apply the framework in a specific area, the data corresponding to the selected variables should be collected from reliable sources. The data must be then examined for consistency and quality. The variables should then be estimated quantitatively or qualitatively as presented in the framework. These variables must then be normalized between the range 1 and 5 by using a combination of reference values from literature, logical deductions, and expert opinion. The variables contributing to particular indicators are aggregated and averaged to get an indicator score between 1 and 5. Similarly, the indicators contributing to a dimension are aggregated and averaged to obtain a dimension score. Finally, the dimensions scores are aggregated and averaged to get the overall water security index. It is expected that the outcome of this study should help inform decision making on water security enhancement and infrastructural development, which in turn will have a spiralling benefit for human health as well as economic development.
Acknowledgement
The authors would like to acknowledge the support of the Asia Pacific Network for Global Change Research (APN) for the conduct of this study. The authors also acknowledge the various government and non-governmental stakeholders in Thailand, India and Vietnam for providing useful input for this study.
References
- Asian Development Bank. (2013). Asian Water Development Outlook: Measuring Water Security in Asia and the Pacific, Manila, Philippines.
- Babel, M. S. & Wahid, M. S. (2008). Freshwater under threat: South Asia Vulnerability Assessment of Freshwater Resources to Environmental Change, Kenya, United Nations Environment Programme.
- Falkenmark (1989). “The massive water scarcity threatening Africa-why isn’t it being addressed.” Ambio 18, no. 2: 112-118.
- Gleick, P.H. (1990). Global climatic changes: A summary of regional hydrologic impacts. Civil Engineering Practice. 5 (1), 53-68.
- Global Water Partnership. (2000). Towards Water Security: A Framework for Action. Stockholm, Sweden.
- Heap, C., Kemp-Benedict, E. & Raskin, P. (1998). Conventional worlds: technical description of bending the curve scenarios. Polestar series report. Stockholm Environmental Institute, Boston.
- Jensen, O. & Wu, H. (2018). Urban water security indicators: Development and pilot. Environmental Science and Policy, 83, 33-45.
- KoontanakuIvong, S., Doungmanee, P. & Hoisungwan, P. (2013). Water Security Index Concept Thailand’s Water Security Situation in the context of world and ASEAN. Thailand: Chulalongkorn University and Research Center, National Institute of Development Administration. (In Thai).
- Malekmohammadi, B. & Jahanishakib, F. (2017). Vulnerability assessment of wetland landscape ecosystem services using driver-pressure-state-impact-response (DPSIR) model. Ecological Indicators, 82: 293-303.
- Mehr, S. (2011). Integrated framework for assessment of water security. (Master research study No. WM-10-1, Asian Institute of Technology, (2011). Thailand: Asian Institute of Technology.
- Organization for Economic Co-operation and Development. (OECD, 2003). OECD Environmental Indicators Development, measurement and use. Retrieved September 2014, from http://www.oecd.org/environment/indicators-modelling-outlooks/24993546.pdf
- Scriban, R.E., Nichiforel, L., Bouriaud, L.G., Barnoaiea, I. & Barbu, C.O. (2017). Governance of the forest restitution process in Romania: An application of the DPSIR model. Forest Policy and Economics. In press, corrected proof, Available online 7 November 2017.
- Spanò, M., Gentile, F., Davies, C. & Lafortezza, R. (2017). The DPSIR framework in support of green infrastructure planning: A case study in Southern Italy. Land Use Policy, 61, 242-250.
- Srinivasan, V., Konar, M. & Sivapalan, M. (2017). A dynamic framework for water security. Water Security, 1, 12-20.
- Sullivan, C. A., Meigh, J. R., & Giacomello, A. M. (2003). The Water Poverty Index: Development and application at the community scale. Natural Resources Forum, 27(3), 189-199. doi:10.1111/1477-8947.00054.
- Sun, S., Wang, Y., Liu, J., Cai, H. & Xu, L. (2016). Sustainability assessment of regional water resources under the DPSIR framework. Journal of Hydrology, 532,140-148.
- Tscherning, K., Helming, K., Krippner, B., Sieber, S. & Paloma, S.G. (2012). Does research applying the DPSIR framework support decision making? Land Use Policy, 29(1), 102-110.
- Varis, O., Keskinen, M. & Kummu, M. (2017). Four dimensions of water security with a case of the indirect role of water in global food security. Water Security, 1, 36-45.
- Xiao, S., Li, J., Xiao, H., & Liu, F. (2007). Comprehensive assessment of water security for inland watersheds in the Hexi Corridor, Northwest China. Environmental Geology, 55(2), 369-376.
- Zeitoun, M. (2011). The Global Web of National Water Security. Global Policy. 2, 286–296.
- Zende, A.M., Patil, R.A. & Patil, V.M. (2018). Water security assessment in semi-arid region using geospatial techniques. Materials Today: Proceedings, 5, 1, Part 1, 620-627.
- Zhou, G., Singh, J., Wu, J., Sinha,R. & Frostell, B. (2015). Evaluating low-carbon city initiatives from the DPSIR framework perspective. Habitat International, 50, 289-299.