A hierarchical and inclusive zonation of Sundarbans for monitoring and management of the world heritage area
Keywords
HIERARCHICAL ZONATION · MANGROVE ECOSYSTEM · Remote sensing · SUNDARBANS · VULNERABILITY ANALYSIS
HIGHLIGHTS
- A hierarchical zonation of Sundarbans has been proposed using high-resolution remote sensing data from PlanetScope images.
- The zonation process includes assembling various existing and new geospatial data sets to cater to the spatio-temporal changes in the study area.
- A climate change vulnerability analysis of the Sundarbans mangrove ecosystem was done using geospatial data to identify stable and vulnerable parts of the study area.
1. INTRODUCTION
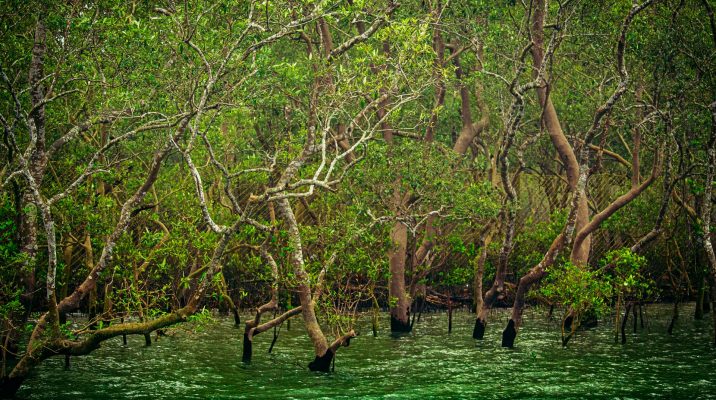
The Sundarbans, a UNESCO World Heritage Site, is the world’s largest contiguous mangrove forest, composed of a network of low-lying conglomeration islands created from sediment loads deposited from the Himalayan rivers (Ghosh et al., 2015). These islands are of mudflats with salt pans and natural levees that are separated by tidal creeks (Siddiqi, 2001) and provide the world’s largest remaining habitat for the globally endangered Bengal tiger (Panthera tigris tigris) (Mukul et al., 2019). The Sundarbans play a vital ecological role by mitigating coastal erosion and buffering against tropical cyclones, while also supporting local livelihoods through the provision of resources such as honey, fuelwood and fish (Kibria et al., 2018). The key vegetation species defining zonation are sundri (Heritiera fomes), gewa (Excoecaria agallocha) and goran (Ceriops decandra) (Hoq et al., 2001). The ecosystem experiences tropical cyclones and tidal surges, and studies indicate certain vegetation species are more vulnerable to such events (Halder et al., 2021).
An integrated approach that envisages the ecological and adjacent socio-cultural systems (Sarkar et al., 2024; Sayer et al., 2013). It is suggested to be reconciled for natural hazards protection, livelihood improvement and poverty alleviation. The Indian vision emphasises community wellbeing, ecosystem conservation and phased out-migration. The Bangladesh vision emphasises the management and conservation of the delta (IUCN, 2014). The majority of the forested grids in the region are likely to experience a shift in forest types due to climate change under different IPCC scenarios (Ravindranath et al., 2006). Deforestation contributes 6–17% of anthropogenic CO2 emissions, for example, from 2000 to 2010, about 1.0 Pg C/yr was emitted (Baccini et al., 2012).
1.1. History of Sundarbans
The Sundarbans mangrove ecosystem was formed around 7000 years ago with the deposition of sediments from the Ganges and Brahmaputra River systems (Islam, 2016; Mahmood et al., 2021). The Sundarbans were largely considered forests inhabited by dangerous wildlife (tigers, crocodiles and snakes). The conversion of the fringe areas of this ecosystem to agricultural land commenced in 1781, but this was not found profitable due to a hostile environment (Bhattacharyya, 2019; Mahmood et al., 2021). From 1875 onwards, this ecosystem was mainly considered a source of timber (Bhattacharyya, 2019). A comparison of the area with earlier survey records (e.g. early 19th-century Dampier and Hodges survey of forest extent) indicates that the mangrove has shrunk to almost half in size (DasGupta & Shaw, 2017). In old topographic maps from the Survey of India (based on information collected in the late 18th and 19th Centuries), a large part of the present settlement areas falls under the Sundarbans mangrove forest areas (Rennell, 1794). The anthropogenic interference began in the region in the late 18th Century mainly through agricultural practices (Ghosh et al., 2015). From 1951 onwards, the ecosystem was considered a source of timber, and a detailed inventory was prepared for vegetation that was classified according to their diameters at breast height (DBH).
1.2. Current state of the Sundarbans
There are several administrative classifications of the Sundarbans, both for India and Bangladesh. The first zonation of Sundarbans was done under the colonial period of India, which classified Sundarbans into six ranges and 75 compartments (Curtis, 1931, 1933). The Bangladesh part still uses 55 compartments, and the Indian forest department still uses 20 compartments as forest blocks. Based on the species composition and salinity, the Bangladesh part of Sundarbans was classified as freshwater (oligohaline), moderate saltwater (mesohaline) and saltwater zones (polyhaline) (Hoque et al., 2006). During the British colonial period, the Sundarbans were administratively divided into six zones in East Pakistan and four regions in the Indian territory.
1.3. The need for hierarchical zones
Several studies on the Sundarbans were conducted at a local scale, mainly in accessible parts of the ecosystem. Most of the coarse-scale studies are confined either to India or Bangladesh. This created a lack of consistency in the availability of data sets, leading to challenges in creating maps of the entire ecosystem. This study uses hierarchical geographic units for the study area. A geographic unit is defined as the smallest region in geospatial data that can be used for collecting and analysing data. Such units are primarily used for census data, e.g. geographic units are used by the US Census (Schlossberg, 2003) and Mesh Blocks by the Australian Bureau of Statistics (Cockings et al., 2013; Juricev-Martincev et al., 2024; Smailes, 1998). Such geographic units are primarily used for demographic and social science studies. For environmental studies, there are numerous examples of the use of bioclimatic zones at different scales (Fischer et al., 2022; Hutchinson et al., 2005; Metzger et al., 2013). Such zones are often used to compare vegetation structure (Box, 2016), biodiversity (Metzger et al., 2013), and climatic scenarios (Soteriades et al., 2017).
The hierarchical zonation approach is proposed in the present study to classify Sundarbans mangrove areas in different zones by assembling the administrative boundary layers and different ecological data layers. This will enable policymakers to formulate better management strategies for this world-famous mangrove forest through a more uniform, unbiased, and systematic approach. Unlike other zonation data sets, this data set will be available in a digital format usable by modern geospatial analysis tools.
1.4. Identification of vulnerable areas
Identifying vulnerable areas, especially for the geographic units of hierarchical zones using biophysical data, will enable better management practices and enhance disaster preparedness and mangrove restorations. Vulnerability is the degree to which a system is susceptible to the adverse effects of hazards such as extreme events and variability in climate (Brooks, 2003; IPCC, 2007). Vulnerability is further classified as biophysical and socioeconomic vulnerability, and this study primarily focuses on the biophysical component of vulnerability. Other terms used while defining vulnerability are exposure, sensitivity, hazards, risk, and adaptive capability. Hazard is defined as a potential source of adverse effects on a system that can be natural or anthropogenic, while sensitivity refers to the degree to which a system is adversely or beneficially affected by climate-related stimuli (Brooks, 2003; IPCC, 2007). The adaptive capacity is the ability of the system to adjust to climatic extremes (IPCC, 2007).
2. METHODOLOGY
2.1. Study area
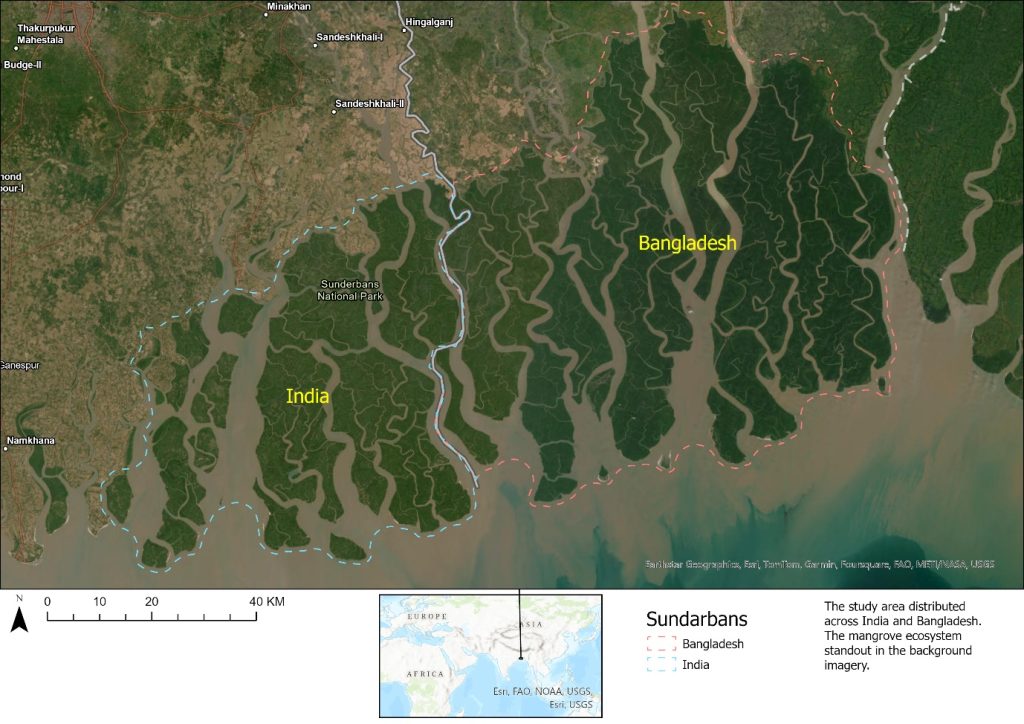
Situated within a tropical cyclone belt, the Sundarbans mangrove ecosystem exemplifies the intricate interplay between social and ecological systems (Figure 1). Fluctuations in water levels, temperature and wind flow are altering the region’s topography, increasing its susceptibility to multiple natural hazards and contributing to the degradation of forest resources, which are further exacerbated under climate change scenarios (Jandl et al., 2007; Rosenzweig, 1995).
2.2. Data sets
2.2.1. Remote sensing images
Multiple cloud-free PlanetScope surface reflectance multispectral images were downloaded for different dates in November 2019 for the entire study area from Planet Explorer (Planet Team, 2019). Altogether 346 non-overlapping scenes collected from 8 to 30 November 2019 were downloaded (Table 1). The PlanetScope constellation has approximately 130 satellites, enabling daily image collection of a given area. These images are available at 3 metres resolution in four spectral bands, which are blue, green, red and near infrared (Figure 2a). Unlike Landsat and Sentinel-2 data, bigger study areas such as the Sundarbans are covered in multiple scenes.
| Date | Number of scenes | Resolution (metres) | Data type | |
|---|---|---|---|---|
| 1. | 08-November-2019 | 12 | 3 | Surface reflectance |
| 2. | 09-November-2019 | 12 | 3 | Surface reflectance |
| 3. | 11-November-2019 | 22 | 3 | Surface reflectance |
| 4. | 14-November-2019 | 84 | 3 | Surface reflectance |
| 5. | 15-November-2019 | 135 | 3 | Surface reflectance |
| 6. | 16-November-2019 | 22 | 3 | Surface reflectance |
| 7. | 17-November-2019 | 32 | 3 | Surface reflectance |
| 8. | 30-November-2019 | 27 | 3 | Surface reflectance |
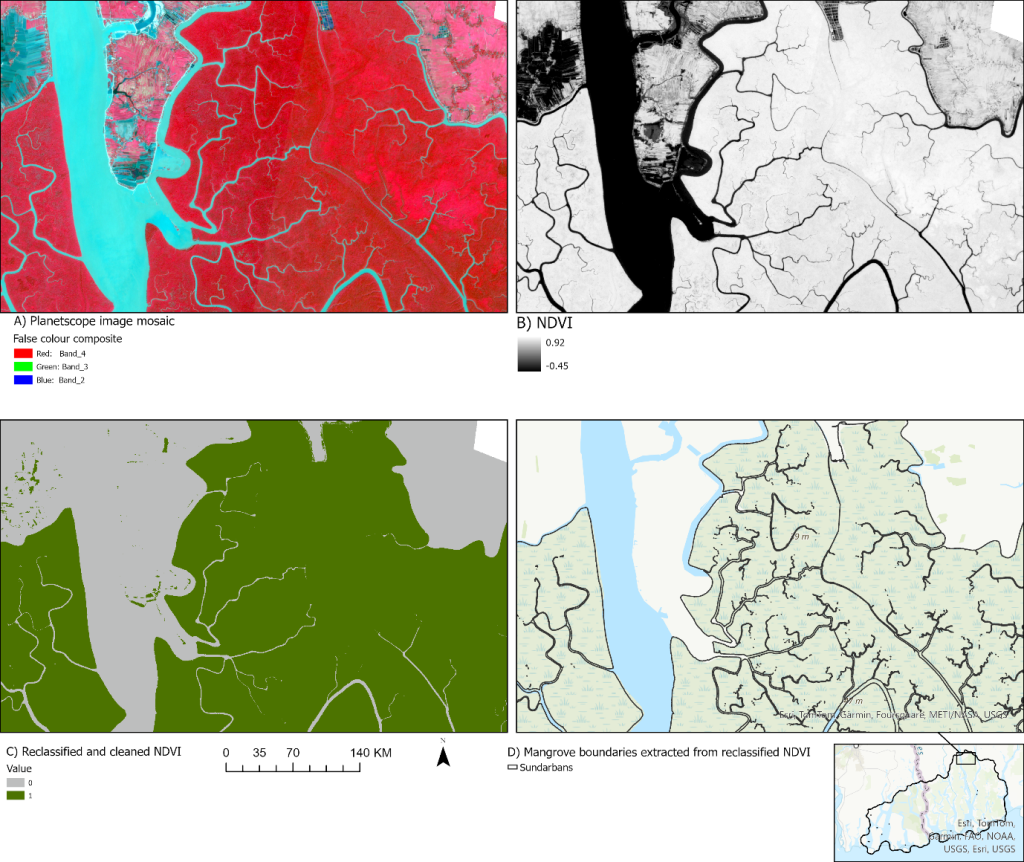
A single mosaiced image was created for all Sundarbans from the 346 scenes, and a normalised difference vegetation index (NDVI) was calculated using the ENVI software package (Figure 2b).
\(NDVI = \frac{NIR – R}{NIR + R}
\)
NIR is the near-infrared band, and R is the red band. The NDVI image was reclassified using the Reclass tool available in ArcGIS Pro software to create a binary image to isolate all the terrestrial mangrove areas. The NDVI value ranges between −1 and +1, and in the first step, all the pixels of the NDVI image with values over 0.1 were classified as terrestrial areas. The mangrove vegetation mostly had NDVI values over 0.5, but agricultural lands were included in the reclassified image on the northern side of the Sundarbans. Such pixels were cleaned using the Pixel Editor functionality available in ArcGIS Pro. Raster cleaning was easier since canals separate the mangrove areas (Figure 2c). Thereafter, the reclassified image data was converted to vector data. The other GIS data, such as global mangrove boundaries, were used for the cleaning process because these data sets identified vector polygons located outside the mangrove areas. Such polygons were deleted while editing vector data in ArcGIS Pro (Figure 2d). This provided a detailed map of the Sundarbans.
2.2.2. GIS data sets
Apart from the PlanetScope imagery, some more basic and secondary data sets were used, which include the Global mangrove database (Bunting et al., 2022), elevation data (USGS, 2018), aboveground and belowground biomass (Spawn & Gibbs, 2020), Sentinel-2 global land use map (ESRI, 2024b), and Landsat images (USGS, 2024) (Table 2).
| No. | Data set | Map-scale | Format | Source | Data currency |
|---|---|---|---|---|---|
| 1. | PlanetScope image | 1:6,000 (3 m resolution) | Raster data (tif) | (Planet Team, 2019) | 2019 |
| 2. | Global mangrove database | 1:60,000 | Vector data (shapefile) | (Bunting et al., 2022) | 2016 |
| 3. | Elevation model | 1:60,000 (1 s resolution) | Raster data (tif) | (USGS, 2018) | 2000 |
| 4. | Aboveground biomass | 1:600,000 (10 s resolution) | Raster data (tif) | (Spawn & Gibbs, 2020) | 2010 |
| 5. | Belowground biomass | 1:600,000 (10 s resolution) | Raster data (tif) | (Spawn & Gibbs, 2020) | 2010 |
| 6. | Bangladesh salinity map | Analogue map (PDF) | (Tamang, 1993) |
A standard procedure was followed for the present geospatial study to organise and analyse all data sets in File Geodatabase format. It was transformed into the universal transverse Mercator (UTM) coordinate system of zone 45N with WGS84 datum (Srivastava, 2015). For elevation, we used SRTM data (USGS, 2018), which provides elevation values of the Earth’s surface. The accuracy of this elevation model is affected by the interaction of C-band microwave with vegetation (Kellndorfer et al., 2004). The elevation model represents a mix of ground and surface elevation, including vegetation. For ground elevation models, studies have used interpolated ground elevation data (Ghosh et al., 2019). While there are several data sources available that provide ground elevation information, these sources are either too coarse (GTOPO30 and GEDI) (Danielson & Gesch, 2011; NASA, 2025) or inaccessible and inconsistent for the study area (Ghosh et al., 2019). To have an accurate digital elevation model of the study area, an aerial laser survey to collect LiDAR data is recommended for all Sundarbans (India and Bangladesh).
2.2.3. Existing zonation maps
Most of the zonation maps are available in generic image formats. The following existing zonation maps were used for this study:
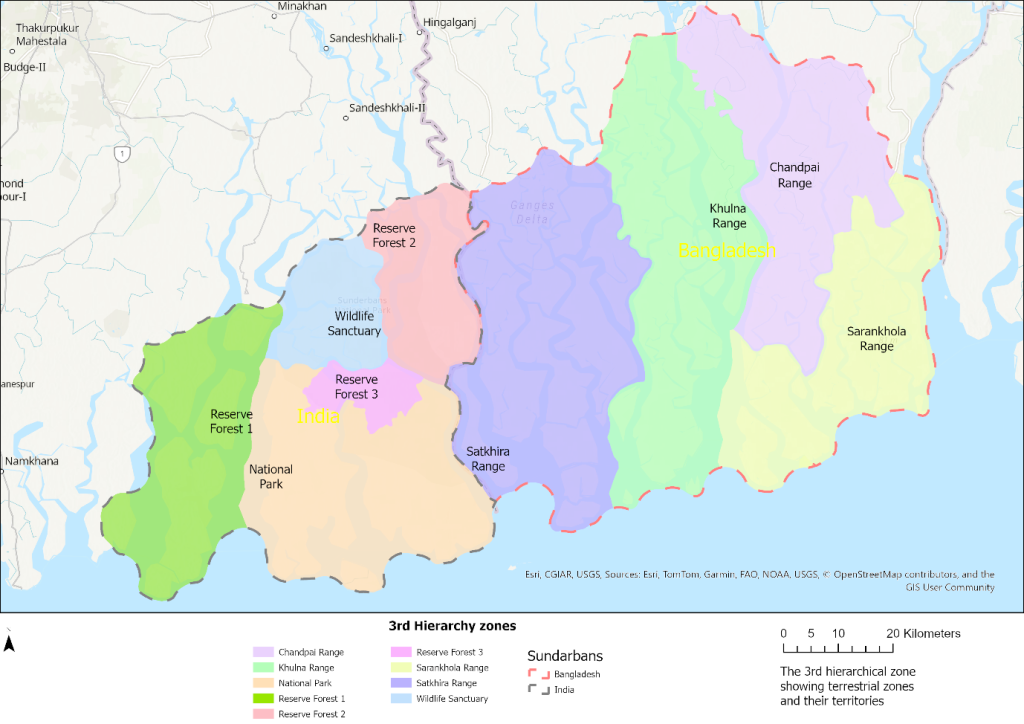
- Broad administrative ranges of India and Bangladesh (Figure 1). This data set divides the Sundarbans into:
- (a) Bangladesh
- i. Chandpai Range
- ii. Khulna Range
- iii. Sarankhola Range
- iv. Satkhira Range
- (b) India
- i. National Park
- ii. Reserve Forest 1
- iii. Reserve Forest 2
- iv. Reserve Forest 3
- v. Wildlife Sanctuary
- (a) Bangladesh
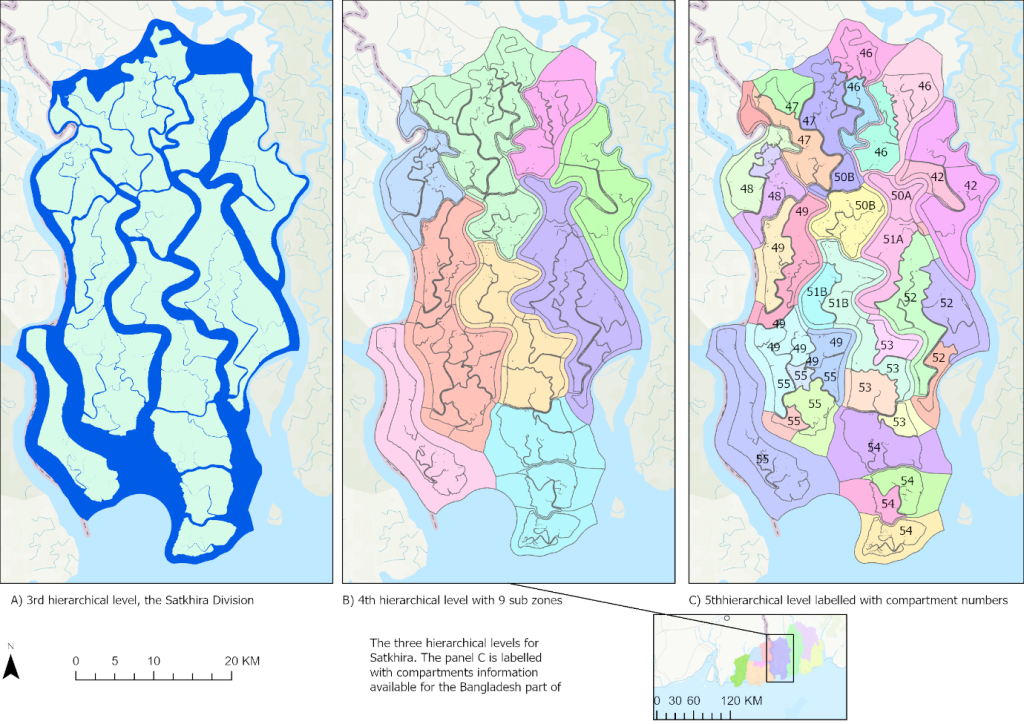
- The compartment map available for the Bangladesh Sundarbans is from the Bangladesh Forest Department. This map divides the Bangladesh Sundarbans into 55 compartments (Tamang, 1993). These compartments were created in 1930 and were digitised under an FAO/UNDP project (BFD, 2016). All such zonation maps were brought into the ArcGIS Pro software (ESRI, 2024a) and were georeferenced for further use. We used at least 20 ground control points and the 2nd order polynomial for all georeferencing. With the addition and exclusion of control points, the root mean square (RMS) error was maintained to be better than 25 m.
2.2.4. Hierarchical zonation
For the hierarchical zonation of the entire Sundarbans, the following approach was taken:
- At the highest level, the mangrove area within Sundarbans was identified.
- The Sundarbans ecosystem was divided into the Indian and Bangladeshi regions.
- The nine existing zonation information were applied (Figure 1 and Figure 3).
- Geospatial analysis was performed to identify individual mangrove islands at a map scale of 1:6000. This map scale was derived using a 3 m resolution of the Planet data. Using islands as geographic units worked well for the Indian part, but for the Bangladesh part, the islands were much bigger. Therefore, for the Bangladesh part, the information from the compartment map was used to create individual geographic units.
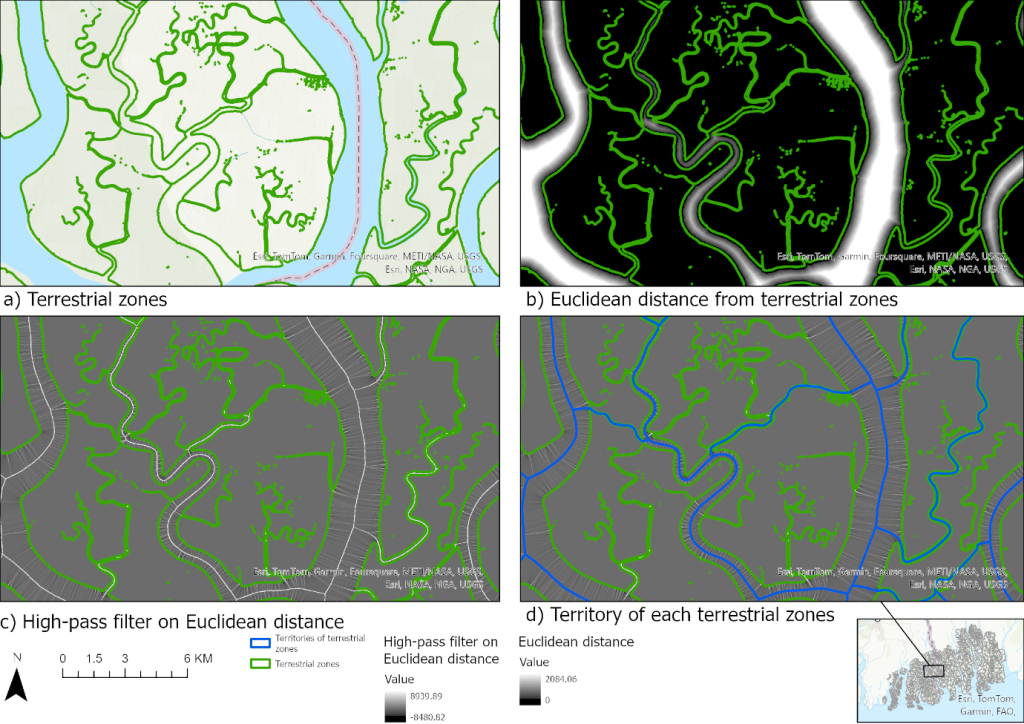
2.2.5. Territory for each geographic unit
When the zonation of all Sundarbans was completed, it was realised that several mangrove islands are dynamic, especially those on the southern coastal part of the mangrove. This is due to continuous erosion and deposition over the years. Also, the width of water bodies, which are referred to as canals between the islands, varied from a few metres to up to 15 km. Therefore, a territory was created around each geographic unit to ensure the entire terrestrial and aquatic regions were covered for the Sundarbans.
Geospatial tools, including Euclidean distance, high-pass filters and reclassification, were used to identify the dividing line between two geographic units (Figure 4).
2.2.6. Analysis
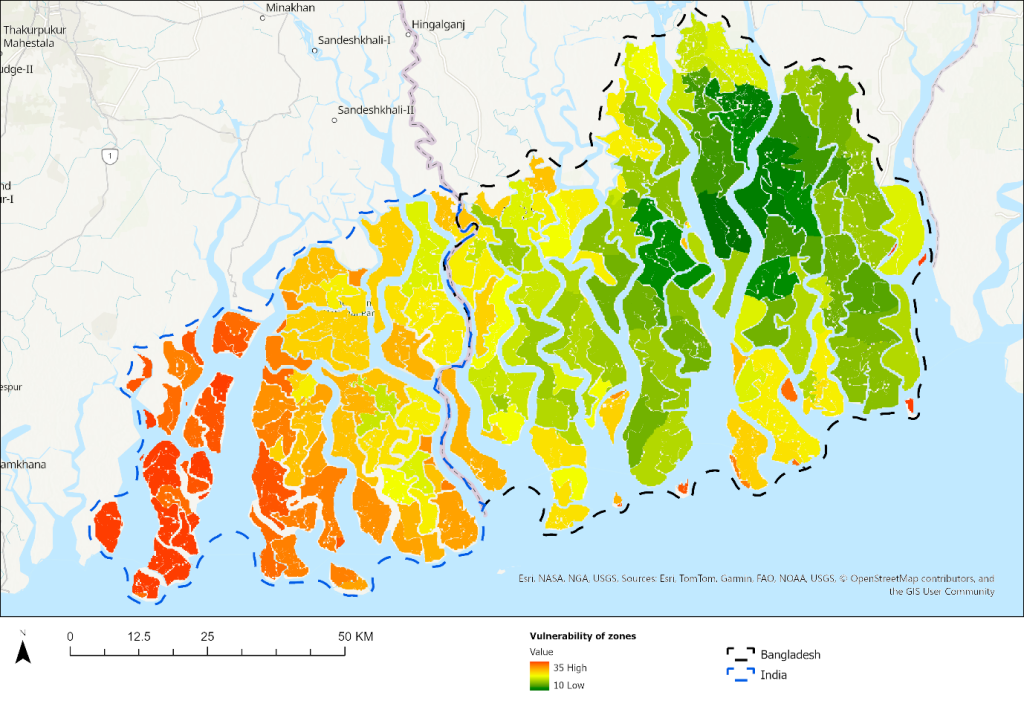
The vulnerability of Sundarban mangrove areas to climate change was analysed using a multicriteria decision-making method. For this study, we used an equally weighted sum of all seven variables that are reclassified on a standard scale with a rating of 1–5. The key outcome of this analysis is the vulnerability map. The following criteria were applied for the climate change vulnerability analysis (Figure 6):
- Nearness to the human impact zone is less vulnerable.
- Nearness to the ocean makes the units more vulnerable to cyclones.
- The lower elevation area is more vulnerable. During high tide, mangroves in the lower elevation areas submerge in the seawater, and plants cannot do photosynthesis properly. Rising sea levels due to global warming submerge mangroves permanently in the lower elevation area. The 1-second global SRTM elevation data (height in metres from EGM96 geoid) was used for this study (USGS, 2018).
- If the aboveground biomass is higher, the vulnerability is lower. The aboveground biomass dataset was used from (Spawn & Gibbs, 2020).
- If the belowground biomass is higher, the vulnerability is lower. The belowground biomass dataset was used from (Spawn & Gibbs, 2020). Both aboveground biomass and belowground biomass data are available as Megagrams (tons) of carbon per hectare (MgC/Ha).
- The mangrove areas with more vegetation cover changes are more vulnerable. Annual vegetation cover change from 2014 to 2020 was used for the analysis. This was derived from changes in NDVI values of annual median Landsat images using existing scripts on the Google Earth Engine platform (Karsch et al., 2023).
- The ratio between terrestrial mangrove area and other areas (canals, ocean and impact zone on the northern part). If the ratio is high, the vulnerability is lower.
2.2.7. Field data
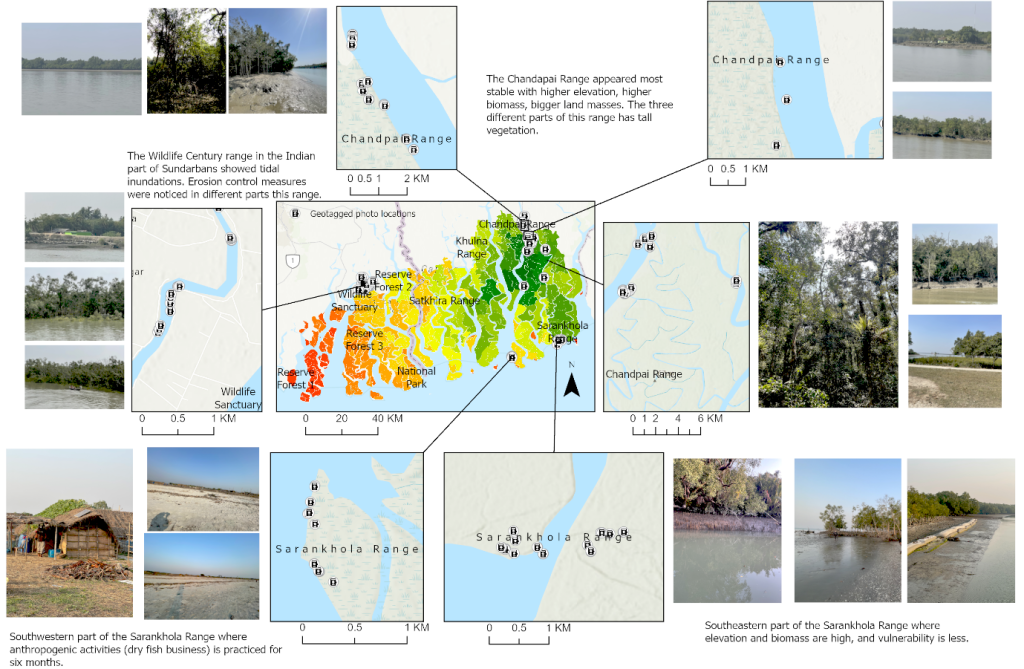
Field survey data validated the analysis. The field survey was carried out in February 2023, both in Bangladesh and the Indian parts of the mangrove areas, with the help of the local administration. Field data, such as questionnaires, forest survey data, photographs and eye estimations, were used to validate remote sensing products and GIS analysis. The key area included Reserve Forest 1 of the Indian Sundarbans, Chandpai and Sarankhola ranges of the Bangladesh Sundarbans. Around 500 photographs were collected with metadata (EXIF) information. All the photographs were geotagged using ArcGIS Pro software. The photographs were taken with Apple’s iPhone 12 Pro Max camera (12 megapixel camera with f/2.2 aperture) that has a built-in digital compass, iBeacon micro-location, and GNSS receiver (GPS, GLONASS, Galileo, QZSS and BeiDou) (Apple, 2024).
3. RESULTS AND DISCUSSION
A GIS data set of the entire Sundarbans mangrove ecosystem was created with the following hierarchical levels:
- Hierarchical levels
- Zones and their territories.
- – For all the zones, territorial boundaries were created (Figure 4).
- Names of the canals and places from archived topographic maps.
The hierarchical zonation of the Sundarbans will enable future investigation of the region across multiple map scales. This multi-scale framework is particularly valuable for examining how spatial scale influences landscape patterns (Turner et al., 1989), species richness and diversity (Rahbek, 2005), and various ecological processes (Levin, 1992). In a seminal work on the relationship between ecological processes and map scale, Levin (1992) proposed a hierarchical theory in ecology where multiple scale patterns were recognised in a given ecosystem. This led to increased interdisciplinary thinking by ecologists to link ecosystem patterns with scale (Chave, 2013). The hierarchical zonation of the Sundarbans provides a structured framework of geographic units across multiple cartographic scales. This multi-scale framework enables systematic analysis within individual scales. It facilitates integrating and comparing studies conducted at different spatial resolutions. Geographic units are defined as areas or regions that can be used for geospatial analysis to identify patterns, and these could be physical, cultural or political (Crovello, 1981; Jax, 2006). The hierarchical zonation map is also used on the ArcGIS Online Dashboard for a wider visualisation (Srivastava et al., 2024).
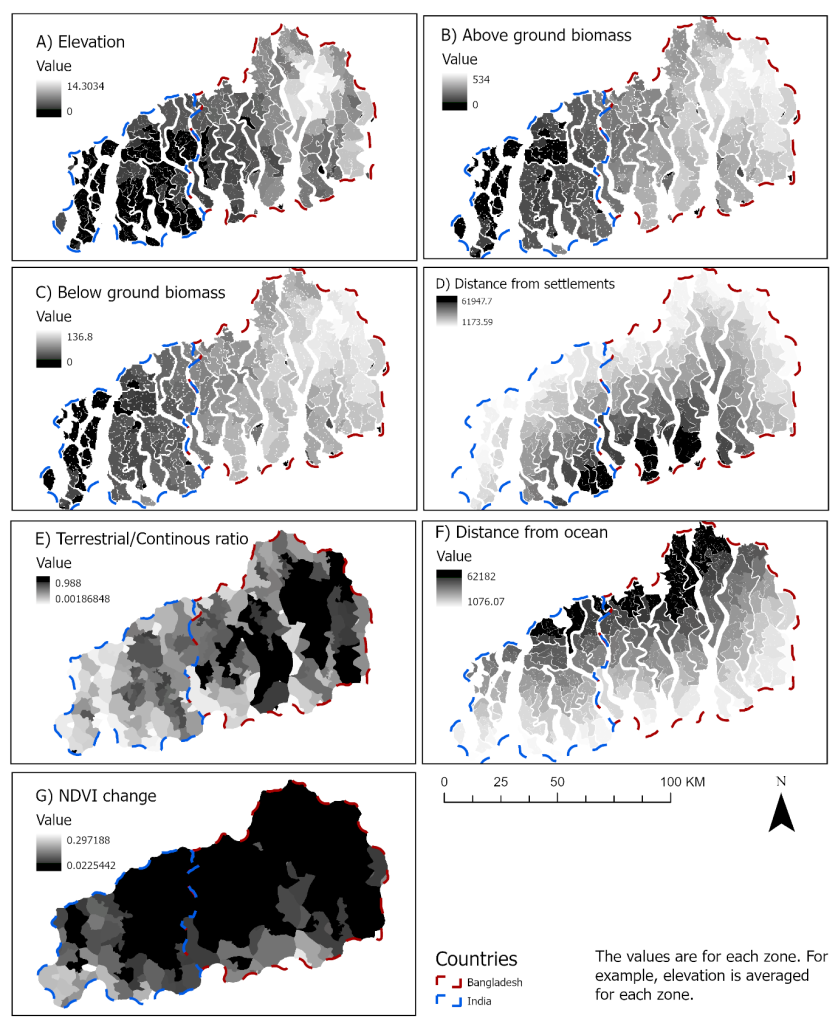
The availability of such a data set enabled geospatial analysis of each hierarchical zone (Figure 6). Accordingly, the seven data sets identified to estimate the vulnerability of the different geographic units were reclassified on a scale of 1 to 5, with 1 indicating the least vulnerable area and 5 indicating the most vulnerable area (Figure 7).
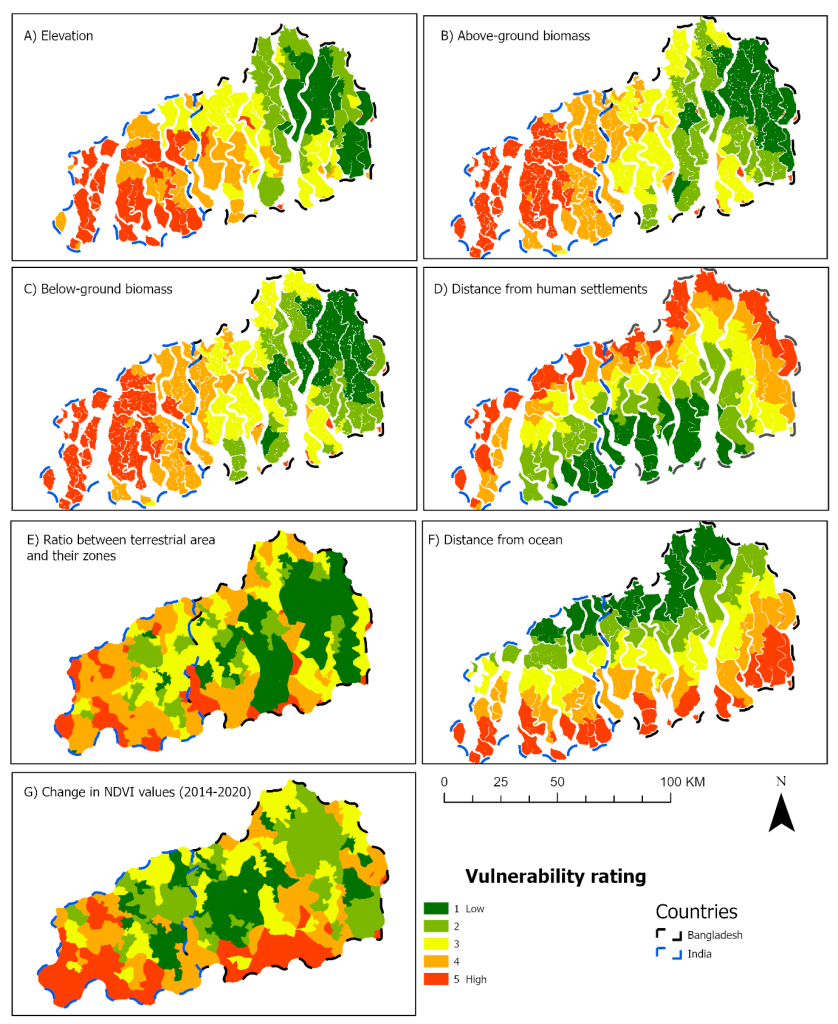
The following criteria were applied to seven selected data sets (Figure 7):
- Nearness to the human impact zone on the northern side. Areas near the human impact zones were the most vulnerable.
- Nearness to the ocean makes the units vulnerable to cyclones.
- Areas with high elevation were considered least vulnerable, and low-lying areas were prone to tidal inundations and cyclones.
- Areas with higher surface elevation and aboveground and belowground biomass were considered more stable.
- Areas showing more changes in NDVI (representing vegetation) were considered unstable.
- The higher ratio between terrestrial mangrove area and other areas (canals, ocean and impact zone on the northern part) was indicative of higher vulnerability.
Details of the criteria for creating vulnerability ratings are presented in Table 3.
| Variables used | Variable values | Vulnerability rating | Justification of the rating |
|---|---|---|---|
| Elevation (metres) | 0–8.4 | 5 | The adaptive capacity of the low-lying areas will be low because of exposure to hazards such as periodic tidal inundation and post-cyclone flooding. Such areas will be vulnerable to erosion. |
| 8.4–9.3 | 4 | ||
| 9.3–10.4 | 3 | ||
| 10.4–11.4 | 2 | ||
| 11.4–14.3 | 1 | ||
| Distance from ocean (kilometres) | 1.076—10.422 | 5 | The adaptive capacity of areas new to the ocean will be low because of exposure to hazards such as periodic tidal inundation and post-cyclone flooding. Areas near the ocean will be vulnerable to erosion. |
| 10.422–20.966 | 4 | ||
| 20.966–31.509 | 3 | ||
| 31.509–43.730 | 2 | ||
| 43.730–62.182 | 1 | ||
| Distance from core area (kilometres) | 1.174-8.324 | 5 | Areas near human settlements are affected by anthropogenic encroachments and other activities. Once encroached, the area may never recover. |
| 8.324–14.758 | 4 | ||
| 14.758–23.577 | 3 | ||
| 23.577–34.540 | 2 | ||
| 34.540–61.948 | 1 | ||
| NDVI change | 0.024–0.045 | 1 | NDVI change represents changes in vegetation cover. No change in vegetation cover indicates stability, and such areas are less vulnerable to hazards such as erosion. |
| 0.046–0.053 | 2 | ||
| 0.053–0.066 | 3 | ||
| 0.066–0.098 | 4 | ||
| 0.098–0.297 | 5 | ||
| Ratio of terrestrial area and zones | <0.412 | 5 | A high ratio of terrestrial area and zones indicates that fewer areas are exposed to water bodies, and such areas are less exposed to bank erosion. Areas with a higher ratio will have better adaptive capacity because of less exposure to natural hazards. |
| 0.412–0.647 | 4 | ||
| 0.647–0.776 | 3 | ||
| 0.776–0.88 | 2 | ||
| 0.88–1 | 1 | ||
| Aboveground biomass (AGB) values (MgC/Ha) | 0–182.2 | 5 | High ABG indicates more vegetation, less sensitivity to hazards such as cyclones, and better adaptive capability. Such areas can easily recover from the deleterious effects of high wind velocities during a cyclone. |
| 182.2–282.7 | 4 | ||
| 282.7–362.3 | 3 | ||
| 362.3–425.1 | 2 | ||
| 425.1–534 | 1 | ||
| Belowground biomass (BGB) values (MgC/Ha) | 0-61.7 | 5 | High BGB indicates more vegetation, less sensitivity to hazards such as cyclones, and better adaptive capability. Such areas can easily recover from the deleterious effects of high wind velocities during a cyclone. |
| 61.7–85.8 | 4 | ||
| 85.8–100.9 | 3 | ||
| 100.9–113.2 | 2 | ||
| 113.2–136.8 | 1 | ||
| Overall rating | 7–35 | 7–35 | The overall rating is calculated after summing all the vulnerability ratings, with each rating assigned an equal weight. The rating was qualitatively assessed with field observations. For example, the low-lying coastal area with lower biomass is more vulnerable. |
Once all the data sets were reclassified based on a vulnerability scale of 1–5, a simple addition of all seven raster layers was performed to get a relative vulnerability rating for each geographic unit of the ecosystem (Figure 8). The final vulnerability map indicated that the western part of the ecosystem, the Reserve Forests 1, is the most vulnerable region. This could be attributed to low elevation, leading to exposure to hazards such as tidal inundations and high salinity. A lower biomass in this region can potentially be attributed to higher sensitivity to extreme weather conditions and lower adaptive capacity after extreme weather events. The western part is also vulnerable to anthropogenic activities, and historical records indicate the loss of a larger part of the mangroves due to human encroachment and the establishment of new settlements. The Chandpai, Sarankhola and Khulna Ranges of Bangladesh have the most stable geographic units because of higher elevation, which makes the area less exposed to hazards such as tidal inundations. Less exposure to hazards means this part of the ecosystem has better adaptive capacity and higher biomass. However, the southern part of these ranges (i.e. Satkhira) has vulnerable geographic units, and islands are at relatively lower altitudes (i.e., close to sea level). Again, compared to the Bangladesh Sundarbans, the Indian Sundarbans show relatively higher vulnerability.
The geotagged photographs were used to validate the vulnerability map (Figure 9). The Chandapai range was found to be the most stable zone with tall vegetation, low evidence of tidal inundations and stabilised islands. The southeastern part of the Sarankhola range appeared stable, with some inundations in the coastal regions. The effects of past tropical cyclones were also noticed in this range, e.g., fallen trees. The southwestern part of this range was a village that fishermen inhabited for six months, and thereafter, the entire village was abandoned. The fishermen sundry the catch, and such food items are iconic to Bangladesh. The effect of tropical cyclones and anthropogenic activities was noticed in this part of the ecosystem. The Wildlife Sanctuary range in the Indian part of Sundarbans appeared highly vulnerable to tidal inundations. At many locations, erosion control measures and structures were noticed on the river’s banks, often called canals. All these observations of the field visit matched well with the desktop vulnerability analysis of the ecosystem.
4. CONCLUSION
The Sundarbans mangrove forest areas, the world heritage site of Bangladesh and India, are rich in biodiversity but are subject to ecological degradation. The hierarchical zonation approach proposed in the present study will be beneficial for better management of the mangrove ecosystem, even in its non-accessible areas, because this technique ensembles remote sensing and GIS data layers for ecosystem information and the administrative boundary layers. This study demonstrates the utility of hierarchical zones or geographic units to monitor mangrove ecosystems on a short- or long-term temporal scale using a variety of geospatial databases. The information, such as above- and belowground biomass, can be estimated and linked to other indices such as species-richness, biodiversity, vulnerability to erosion, and change in vegetation species composition. Additionally, such data sets can be used to plan fieldwork and collect biophysical and socioeconomic data. This data set can be improved further by incorporating more and more zonation information used in the past for the study area. This will enable the consistent collection and organisation of data for the vast regions of Sundarbans. This will also help identify information gaps in the ecosystem where inaccessible and remote regions exist.
The multicriteria decision-making analysis in the GIS platform generated the vulnerability map of the Sundarbans mangrove ecosystem. This will be useful in prioritising the selection of the more vulnerable areas of the ecosystem for management purposes. The Sundarbans ecosystem is vast, and many parts are highly inaccessible because of swampy conditions as well as dangers from wildlife. In this context, desktop-based analyses are valuable for identifying vulnerable areas; however, conducting a systematic assessment with a robust sampling design remains a significant challenge. The availability of hierarchical zone maps will enable the designing of good experiments where field data can be statistically matched with the outputs of desktop analysis. With the advancements in remote sensing technologies, it has become easier to estimate tree heights from satellite and drone-based data (Olive et al., 2020; Srivastava et al., 2022). Such data can be collected for selected geographic units for future long-term monitoring, especially for vulnerable areas. Studies recommend planting wind-resistant mangrove species to enhance the adaptive capability of areas vulnerable to cyclones (Mohammed et al., 2024).
5. ACKNOWLEDGEMENT
The authors gratefully acknowledge PlanetScope Education and Research Program for providing free access to PlanetScope imagery, the Oak Ridge National Laboratory Distributed Active Archive Centre (ORNL DAAC) for above- and belowground biomass, and Global Mangrove Watch for providing a database on mangroves. The University of the Sunshine Coast provided high-performance computing systems for data analysis. This research was partly funded by the Asia-Pacific Network for Global Change Research (CRRP2020-08MY-Srivastava; https://doi.org/10.30852/p.13609). The authors duly acknowledge the Bangladesh and Indian governments for their necessary permissions for this study. Finally, the authors acknowledge the three reviewers whose comments and suggestions improved this manuscript.