Measuring forest ecosystem services in Aceh Province for inclusion to local forest resource management plans
Keywords
Ecosystem services · Forest carbon · Forest management unit · Social forestry · Sustainable forest management · Tree biodiversity
Highlights
- Forest ecosystem services can be measured by local forestry staff and communities.
- Ecosystem services measurement tools enable improved forest management practices.
- Co-benefit of 18 students trained in ecosystem services tools and data collection.
1. Introduction
Indonesia has experienced the devolution of forest management through government policy and regulation in the past 20 years. Two mechanisms, in particular, are noteworthy. First, the creation of Forest Management Units (FMU or in Bahasa Indonesia, KPH, Kesatuan Pengelolaan Hutan) for watershed-scale sustainable forest management. Second, the promotion of Social Forestry under the Indonesian Ministry of Environment and Forestry (MoEF). KPH units were introduced to enhance state forest management goals and the units act as “intermediaries between local stakeholders and local and national government agencies [sic], which retain responsibilities for forest administration” (Lestari, 2020). According to the MoEF official KPH online database (http://kph.menlhk.go.id/ accessed Dec 1, 2021), there are a total of 688 KPH units in Indonesia, though some of these are planned only and not currently under active management. In addition to KPH local forest management system is a Social Forestry program in Indonesia, which include five different management schemes: village forests (hutan desa), community forests (hutan kemasyarakatan), community plantation forests (hutan tanaman rakyat), forestry partnerships (kemitraan kehutanan), and customary forests (hutan adat) (MoEF, 2016). According to Rakatama and Pandit (2020), social forestry schemes cover 1.8 million ha of forest land in Indonesia, with plans by the government to increase the area to 12.7 million ha by 2021 (MoEF, 2018).
Along with an emphasis on decentralized forest management, the Indonesian government identified the importance of environmental services in forest ecosystems as early as 2007. Government Regulation No. 6/2007 references the “utilization of environmental services” for KPHL (protection) and KPHP (production) forest units and identifies specifically biodiversity protection and carbon sequestration and storage (Government of Indonesia [GoI], 2007). KPHL and KPHP units are also required to develop 10-year long-term and 1-year short-term forest management plans that include management of environmental services. Social Forestry schemes in Indonesia are also required to develop similar forest management plans. The MoEF Directorate General of Social Forestry (PSKL) regulations give guidelines for preparing village forest management plans (GoI, 2016). Activities specified in the regulations include utilizing Non-Timber Forest Products (NTFPs) such as medicinal plants, the utilization of environmental services through ecotourism activities, and carbon storage and sequestration.
Challenges exist for KPH staff and Social Forestry community members in accurately collecting and reporting information specific to forest ecosystem services such as forest carbon, biodiversity, and the various forest resources that provide provisioning and cultural benefits to local people. Thung (2019) notes that while progress has been made by the Ministry of National Development Planning (BAPPANAS Badan Perencanaan Pembangunan Nasional), the agency responsible for developing KPHs in Indonesia, progress is slow due to several factors, including “lack of technical expertise and experienced staff”. Wulandari, Budiono, and Ekayani (2019), in an assessment of the Impacts of the Decentralization Law 23/2014 on implementing community-based forest management in Lampung Province, Indonesia, analyzed qualitative data for several community forests (hutan kemasyarakatan) areas in four districts. One of the study’s conclusions regarding a decrease in community accountability and participation prior to and after the changes in regulations was an “inadequate number of trained and professional staff”. In a literature meta-analysis of social forestry opportunities and challenges in social forestry implementation in Indonesia, Rakatama and Pandit (2020) note several studies that recognize social forestry creates “environmental opportunities and positive impacts on the environment, as well as contribute to sustainable development”, “improves community awareness of opportunities to protect forest areas from illegal logging and forest encroachment”, help in “educing deforestation, maintaining biodiversity and conservation values, aiding biodiversity conservation and conserving and sustaining forests”. They also found, however, that technical assistance provided by the government for managing forests “is limited and insufficient”.
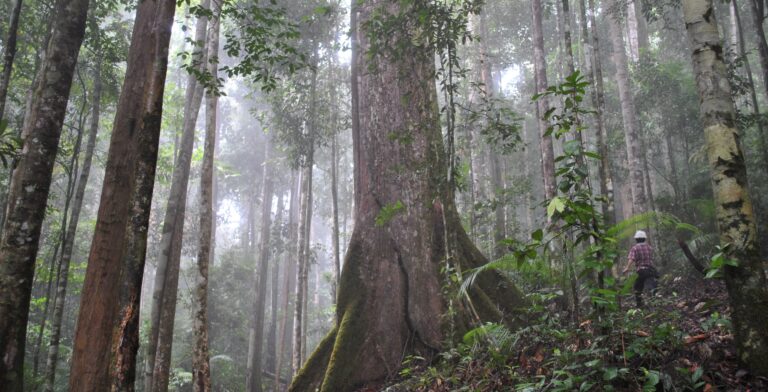
To support overcoming the deficiencies in training and skills required to measure forest ecosystem services and utilize this information in sustainable forest management plans, our team from Michigan State University, Universitas Syiah Kuala and Instiper (Institut Pertanian STIPER) developed a training program in three phases for KPH staff and local Social Forestry community members. The training program was implemented in Aceh Province, Indonesia (February to September 2021). This paper presents the results from field data collected in nine forest areas in Aceh. The data were analyzed using three Excel-based forest ecosystem services tools to compute forest carbon, tree biodiversity, forest integrity and health, and forest resources used as cultural and provisioning benefits by local people.
2. Methodology
2.1 Three Excel-based forest ecosystem services (ES measuring and monitoring tools)
Three Excel-based tools were developed under the USAID LESTARI project (2015–2020) by Michigan State University: a Forest Carbon (FC) tool, a Tree Biodiversity (TB) tool and a Forest Integrity Assessment (FIA+) tool that includes functions for assessing forest resources used for cultural and provisioning benefits by local people. The tools store and manage field-based measurement and observation data. The tools also automatically compute data based on the field data inputs.
2.1.1 FC tool
The FC tool consists of several tabs and includes tabs with user guidance, example data, a user-defined tree species inventory list of local and scientific names, plot data tabs and a synthesis reporting tab. Tree diameter-at-breast-height (dbh; 1.3 m above the ground) measurement data from nested fixed-area plots are input to the tool and are used to compute plot-level biomass carbon using allometric equations specific to the forest type and region (Table 1a). The FC tool includes seven different allometric equations that represent most of the forest types in Aceh Province. Tree height data are computed from three measurements recorded in the field: distance of the observer from the tree, height of the observer’s eyes from the ground, and the protractor angle from the clinometer tool as the observer identifies the top of the tree. Tree height and dbh data are used to estimate the biomass volume (m3) of trees in the plot (Table 1b). The number of trees recorded is used to compute the stem density (number of trees ha-1) of the plot (Table 1c). The tool computes the average tons of carbon per hectare (Mg C ha-1) for all plots where data are collected and estimates the total carbon stock of the forest area (Table 1d). The tool also reports error and confidence accuracies based on the variation of carbon in the plots, the size of the forest area, and the sample size.
|
a): allometric equations for estimating tree biomass (kg) in different Aceh forest types for all trees greater than or equal to 5cm dbh |
||||
|
|
Forest ecosystem |
Allometric equation |
Biomass component |
|
|
|
Tropical Dipterocarp (primary)1 |
AGB = 0.125*D^2.533 |
Above-ground live biomass |
|
|
|
Tropical Dipterocarp (secondary)2 |
AGB = -2.75 + 2.591 *lnD |
Above-ground live biomass |
|
|
|
Peat Forest (primary)2 |
AGB = 0.0145*D^3 – 0.47*D^2 + 30.64*D – 263.32 |
Above-ground live biomass |
|
|
|
Peat Forest (secondary)2 |
AGB = 0.153108*D^2.40 |
Above-ground live biomass |
|
|
|
Mangrove (Rhriz. apiculata)2 |
AGB-BGB = 0.75*D^2.23 |
Above- and below-ground live biomass |
|
|
|
Mangove (Rhriz. mucronata)2 |
AGB-BGB = 0.5*D^2.32 |
Above- and below-ground live biomass |
|
|
|
Pinus2 |
AGB-BGB = 0.103*D^2.459 |
Above- and below-ground live biomass |
|
|
Where |
D = diameter-at-breast-height, 1.3 m above the ground (cm) |
|
||
|
|
AGB = above-ground live biomass (kg) |
|
||
|
|
AGB-BGB = above- and below-ground live biomass or total tree (kg) |
|
||
|
Citations |
|
|
|
|
|
|
|
|
|
|
|
b): biomass volume (m 3 ) equations for all trees greater than or equal to 5cm dbh |
|
|||
|
|
Biomass volumetree |
Vtree = ((1/4)*((PI*((D/100)^2))*H)*0.6) |
|
|
|
Where |
Vtree = biomass volume (m3) |
|
|
|
|
|
D = diameter-at-breast-height, 1.3 m above the ground (cm) |
|
|
|
|
|
H = Height of tree (m) |
|
|
|
|
|
Biomass volumeplot |
Vplot = ΣVtree / Pha |
|
|
|
Where |
Vplot = biomass of the plot (m3 ha-1) |
|
|
|
|
|
Pha = Size of the plot in terms of hectares |
|
|
|
|
c): stem density (number of trees ha -1 ) for all trees greater than or equal to 5cm dbh |
|
|||
|
|
Stem density (trees ha-1) |
S = Σtreecount / Pha |
|
|
|
Where |
Tree count = total number of trees (stems) above 5cm dbh within the plot |
|
||
|
|
Pha = Size of the plot in terms of hectares |
|
|
|
|
d): biomass carbon (tC ha -1 ) and (tC) for all trees greater than or equal to 5cm dbh |
|
|||
|
|
Biomass carbon (Mg C) |
Ctree = (Biomasstree * CF) / 1000 |
|
|
|
Where |
Biomasstree = the tree dry-weight biomass in kg as estimated from an allometric equation (see part a of this table) |
|||
|
|
CF = equals the carbon fraction estimated at 0.50 * Biomasstree (IPCC default value in Penman et al., 2003 ) |
|||
|
|
Biomass carbon (Mg C ha-1) |
tCha-1 = ΣCtree / Pha |
|
|
|
Where |
Ctree = the carbon (Mg C) value of trees within the plot |
|
|
|
|
|
Pha = Size of the plot in terms of hectares |
|
|
|
2.1.2 TB tool
The TB tool has a similar set of tabs as the FC tool. Plot inventory data are recorded for the number of each tree species greater than 5 cm dbh present in the largest of the nested fixed-area plots and seedlings species (less than 5 cm dbh) in the 2 x 2m subplots. Biodiversity indices are then computed that include species richness, Shannon index of species diversity, Simpson index of diversity, evenness, and abundance (Table 2). The same plot area used for the carbon tool data collection is also used for the biodiversity tool.
|
Indices |
Equation |
|
Species richness |
S = total number of species observed |
|
Menhinick’s Richness Index |
D = S/(SQRT N) |
|
Margalef’s Richness Index |
(S-1)/ln(N) |
|
Shannon Index of Species Diversity |
H’ = ∑[(pi) * log(pi)] |
|
Simpson Index of Diversity |
1 – D |
|
Evenness Index |
E = H’/lnS |
|
Where |
|
|
S = total number of species observed |
|
|
N = the total number of individual organisms in the sample |
|
|
pi = Proportion of individuals of i-th species in a whole community |
|
2.1.3 FIA+ tool
The FIA+ tool is a modified and adapted version of The Forest Integrity Assessment Tool (FIAT) developed by the High Conservation Value Resource Network (HCVRN). FIAT is a checklist and scoring tool used for assessing and monitoring biodiversity conditions in forests and forest remnants (Lindhe & Drakenberg, 2019). The modified encoded FIA+ data sheets in Excel include automatic computations and reporting. This tool is an essential complement to the TB tool, which tends toward a more scientific assessment. The FIA+ tool includes four sections for data observations: (1) forest structure and composition, (2) impacts and threats to the forest, (3) the forest’s focal habitats, and (4) the forest’s focal species. We also include data collection tabs in the tool to document the forest resources used by local communities and households that are provisioning cultural services.
The FIA+ tool scores the presence or absence of 20 forest structure characteristics and evidence or absence of 20 observed impacts or threats to the forest ecosystem. The observations are recorded in each of the same plots where data are collected for the FC and TB tools. An average score is computed from the multiple plot FIA+ scores. Scores between 0–10 indicate the forest ecosystem is in poor condition; between 11–20, it is in fair health; between 21–30, it is mostly healthy; and between 31–40, it is very healthy. Focal habitats and species are also identified when present in a plot. Also noted is the presence of any forest resource species (flora or fauna) identified by local people as being utilized for provisioning or cultural needs.
2.2 Phased training program for KPH staff and Social Forestry community members
A three-phase training program was implemented to build the capacity of KPH staff and Social Forestry community members. Phase 1 training focused on: introducing participants to the fundamental concepts of ecosystems and ecosystem services, review of several scientific phenomena (carbon cycle, greenhouse effect, climate change), explanation of the five pools of measurable forest carbon, the use of allometric equations for measuring biomass, field measurements and sample plot designs for forest inventory, and a preview of the three ES tools.
Phase 2 was a field-based practicum where participants were given hands-on training in demarking fixed-area nested plots and collecting plot-level data for use in the three tools. Data collected included: tree dbh, measurements to compute tree height (distance from tree, angle of clinometer, height above ground to observer’s eye level), tree species counts, seedling counts in 2×2 m plots, and FIA+ checklist observations.
After participant teams collected field inventory data, a Phase 3 training was convened and focused on understanding the results of the Tool analyses and how best to use each of the ES Tool’s information for developing improved forest management plans.
2.3 Field data collection protocol
KPH and Social Forestry community teams collected field data for use in each of the three ES tools using a systematic protocol for plot sample locations, plot design and data collection procedures. Data collection teams ranged from 3 to 10 members.
Field plot locations were established on a regular grid pattern. Each plot was located at a minimum distance of 100 m from any forest edge and 50 m from rivers or streams. The plots were located at a minimum distance of 50m from each other. No plots were located in non-tree areas.
Field plots for the FC tool were three square nested plots in which specific diameter class trees were measured: 20 x 20 m plot for trees greater than 20 cm dbh, 10 x 10 m plot for trees less than 20 cm and greater than or equal to 10 cm dbh, and 5 x 5 m plot for trees less than 10 cm and greater than or equal to 5 cm dbh. Seedling counts by species were recorded from two 2 x 2 m plots located outside the 20 x 20 m plot. Within the three nested plots, tree species, dbh, and data for calculating tree height were recorded for all trees ≥ 5 cm dbh.
The same plot was used to also record data for use in the TB and FIA+ tools. Total tree species counts for all trees ≥ 5 cm dbh within the 20 x 20 m plot were recorded for the TB tool. Observations of forest structure, impacts, focal habitats, focal species as well as forest resources noted as used by local people for provisioning and cultural uses were recorded while standing inside the 20 x 20 m plot. All noted observances of these indicators and species within the plot or seen outside the plot while observing from inside the plot were noted.
Field data were recorded on paper field sheets and then input to the appropriate ES tool following data collection.
3. Results and discussion
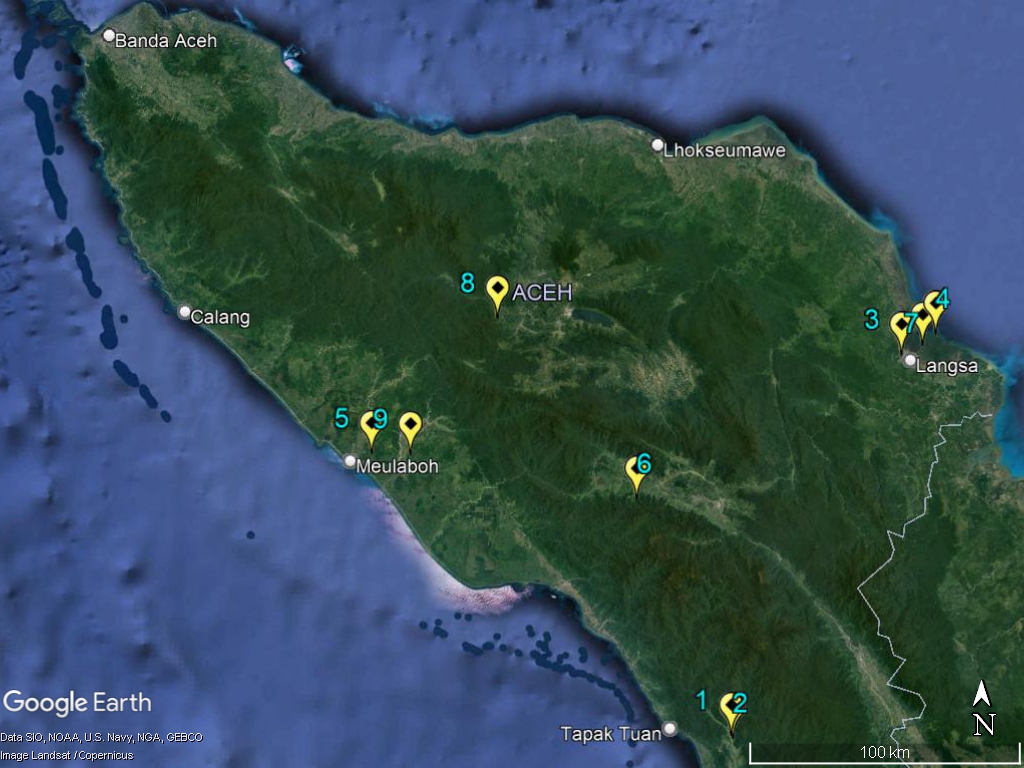
KPH staff and Social Forestry community members collected data in nine forest areas in Aceh Province. The locations and extents of the nine forest areas are specific forest areas each training group manages as part of a KPH or social forest area. Table 3 is a summary table of the nine forest areas and Figure 1 shows their location with a centre point pin. The teams established a total of 83 field plots. The number of plots ranged from four in one of the mangrove areas to twelve in each of the two urban forest areas. The sampling area percent ranged from 0.10% in the largest forest area, Desa Agusen LPHD Gembuluh berkah, to 20.17% in the smallest forest area, Mangrove Telaga Tujuh.
|
No |
KPH / Social Forest / National Park |
Forest Type |
Area (ha) |
Plots |
Sample area % |
|
1 |
HKm. Rumah Rungkoh |
Primary tropical |
105 |
10 |
0.38% |
|
2 |
Desa Agusen LPHD Gembuluh berkah |
Coffee agroforestry |
382 |
10 |
0.10% |
|
3 |
Hutan Kota Langsa |
Trop. evergreen (Urban) |
2.38 |
12 |
20.17% |
|
4 |
Mangrove Telaga Tujuh |
Mangrove |
40 |
10 |
1.00% |
|
5 |
Swamp Group |
Swamp |
1 |
5 |
20.00% |
|
6 |
Pinus Group Reje Pudung/Terangun Gayo Lues |
Pine |
10 |
10 |
4.00% |
|
7 |
Mangrove Group |
Mangrove |
72 |
4 |
0.22% |
|
8 |
Coffee group KPH II |
Coffee agroforestry |
10 |
10 |
4.00% |
|
9 |
Hutan Kota Nagan Raya |
Secondary Trop. (Urban) |
5 |
12 |
9.60% |
3.1 Forest carbon and tree biodiversity in nine forest areas in Aceh Province
We summarize the forest carbon average (Mg C ha-1) and total carbon stock (Mg C) listing the allometric equation used and the tree biodiversity species richness, evenness and dominant species for the nine forest areas in Table 4. The results from the FC and TB tools are what we would expect. Higher average carbon per hectare values in the tropical evergreen and mangrove forest types than in the coffee agroforestry or pine forest types. The range is from a high of 446.93 Mg C ha-1 in the tropical evergreen social forestry of HKm Rumah Rungkoh to a low of only 27.14 Mg C ha-1 in the young coffee agroforestry area. Also, low biodiversity in the mangrove and pine forests than what is measured in the tropical evergreen forests. HKm Rumah Rungkoh and the two urban forest areas, Kota Langsa and Kota Nagan Raya, are considered secondary tropical evergreen forest (35, 33 and 33 species richness, respectively, with evenness values close to 1: 0.86, 0.79 and 0.84). The evenness values close to 1 indicate that the forest is not dominated by just one or two species. The two mangrove areas and the pine forest area have very low species richness values, 1, 2 and 3 species only, and their evenness values are closer to zero, with the pine forest evenness the lowest at 0.06.
|
Forest Area & Allometric Equation Used |
Mg C ha -1 |
Total Carbon (Mg C) |
Species Richness |
Evenness |
Dominant Species |
|
HKm. Rumah Rungkoh / Tropical Dipterocarp (primary) |
446.93 |
46,928 |
35 |
0.86 |
Sangkotan (Buchanania auriculata) |
|
Desa Agusen LPHD Gembuluh berkah / Tropical Dipterocarp (secondary) |
99.52 |
38,095 |
10 |
0.63 |
Kopi (Coffee arabica) |
|
Hutan Kota Langsa / Tropical Dipterocarp (secondary) |
119.07 |
238.39 |
33 |
0.79 |
Meranti seraya (Shorea platyclados) |
|
Mangrove Telaga Tujuh / Mangrove (Rhriz. apiculata) |
269.86 |
10,794 |
2 |
0.14 |
Bangka minyak (Rhizophora apiculata) |
|
Swamp Group / Peat Forest (secondary) |
121.53 |
121 |
10 |
0.59 |
Simpur (Dillenia spp) |
|
Pinus Group Reje Pudung/Terangun Gayo Lues / Pinus |
76.65 |
767 |
1 |
0.06 |
Pine (Pinus merkusil) |
|
Mangrove Group / Mangrove (Rhriz. apiculata)1 |
240.91 |
17,345 |
3 |
0.43 |
Lindur (Bruguiera gymnorrhiza) |
|
Coffee group KPH II / Tropical Dipterocarp (secondary) |
27.14 |
271 |
12 |
0.78 |
Gamal (Gliricidia sepium) |
|
Hutan Kota Nagan Raya / Tropical Dipterocarp (secondary) |
70.74 |
353 |
33 |
0.84 |
Mane (Vitex pubescens) |
|
1 Bruguiera gymnorrhiza and Rhriz. apiculate are of the same botanical order and family. |
|||||
The overall forest carbon stock and tree diversity are important in general for a forest area, but perhaps equally important is the spatial variation of the forest carbon and tree diversity which is information that can be useful for forest resource management activities. Understanding the variation of carbon and tree biodiversity across the plots can assist in developing management plans and actions not just in general for the forest area as a whole but to specific areas within the forest itself.
Table 5 shows the range of carbon and species diversity for the nine forest areas. Again, as expected, the mangrove forest areas and also the pine forest areas have low species richness values and, therefore, the maximum-minimum range between plots is small (mangrove 1–3 species and pine 1 species). Noteworthy from these plot level species richness data in comparison to species richness of the forest areas as a whole are the tropical evergreen forests. While HKm Rumah Rungkoh and the two urban forests have species richness values greater than 30, none of the plots in any of these forest areas include 20 or more species. Some of the tree species, therefore, are present only in some of the plots. Furthermore, in the two urban forest areas, there is at least one plot in each forest area with only three species present and in HKm Rumah Rungkoh, only eleven species present. These forest areas, while overall having a high evenness value, are not uniform in their diversity across the landscape. This is true also for forest carbon. The range in plot-level carbon is greatest in one of the mangrove forest areas with a maximum-minimum value of 667.00 Mg C ha-1. The forest area with the smallest range is the coffee agroforestry area, with a maximum-minimum range of only 36.78 Mg C ha-1 between plots.
|
Forest Area |
Forest Carbon (Mg C ha-1) |
Tree Diversity (species richness) |
||
|
Min |
Max |
Min |
Max |
|
|
HKm. Rumah Rungkoh |
275.11 |
702.86 |
11 |
19 |
|
Desa Agusen LPHD Gembuluh berkah |
45.66 |
82.44 |
2 |
7 |
|
Hutan Kota Langsa |
28.69 |
340.37 |
3 |
9 |
|
Mangrove Telaga Tujuh |
156.20 |
418.60 |
1 |
1 |
|
Swamp Group |
81.59 |
188.41 |
3 |
4 |
|
Pinus Group Reje Pudung/Terangun Gayo Lues |
22.22 |
210.27 |
1 |
1 |
|
Mangrove Group |
15.94 |
682.94 |
1 |
3 |
|
Coffee group KPH II |
5.00 |
93.02 |
1 |
4 |
|
Hutan Kota Nagan Raya |
18.59 |
120.85 |
3 |
11 |
3.2 Forest integrity and health in nine forest areas in Aceh Province
The FIA+ tool provides a more qualitative assessment of the health and integrity of the forest ecosystem scoring a forest by the presence or absence of specific attributes. These include attributes such as the presence of large trees or the absence of stumps which indicate impacts from logging. Teams from seven of the nine forest areas were able to collect field data for the FIA+ tool. The presence or absence of focal species in the forest area is also an indicator of a forest ecosystem’s health. It is presumed that in highly degraded, poor forest ecosystems, there are few focal species. Since many faunae focal species can be difficult to observe directly, data collectors record the presence of a focal species through other means as well, such as a species nest, their call or song in the case of a bird, their marks as in the case of a sun bear, or their faeces. Table 6 includes the average, minimum and maximum FIA+scores at the plot level, the number of focal species observed and the number of observations for the focal species list.
The mangrove forest in Telaga Tujah has the highest average FIA+ score, followed closely by HKm Rumah Rungkoh, 32.7 and 30.8, respectively, out of a total of 40 points possible. Desa Agusen LPHD Gembuluh Berkah, a coffee agroforestry area, had the lowest score of 8.2, indicating a highly degraded forest, which is supported by the low number of focal species and observations of focal species, four and nine, respectively. HKm Rumah Rungkoh has 11 focal species present with 42 observations and the mangrove forest in Telaga Tujah has seven species with 62 observations. Hutan Kota Langsa also has 11 focal species present with 27 observations; however, this urban forest is also a zoo. Table 7 lists the focal species observed for each forest area.
|
Forest Area |
FIA+ Score |
Min |
Max |
Focal Species |
Total Observances |
|---|---|---|---|---|---|
|
HKm. Rumah Rungkoh |
30.8 |
28 |
33 |
11 |
42 |
|
Desa Agusen LPHD Gembuluh berkah |
8.2 |
5 |
10 |
4 |
9 |
|
Hutan Kota Langsa |
25.5 |
20 |
32 |
11 |
27 |
|
Mangrove Telaga Tujuh |
32.7 |
31 |
35 |
7 |
62 |
|
Mangrove Group |
20.25 |
19 |
22 |
6 |
24 |
|
Coffee group KPH II |
18.5 |
13 |
25 |
4 |
16 |
|
Hutan Kota Nagan Raya |
24.92 |
18 |
29 |
4 |
10 |
|
Forest Area |
Local Name |
English Name |
Scientific Name |
|---|---|---|---|
|
HKm. Rumah Rungkoh |
Cuca hijau |
Bornean leaf bird |
Chloropsis kinabaluensis |
|
Serindit |
Blue crowned hanging parrot |
Loriculus galgulus |
|
|
Dolar Bet |
White chested babbler |
Trichastoma rostratum |
|
|
Takur tohtor |
Red crowned barbet |
Psilopogon rafflesii |
|
|
Merbah Cerucuk |
Yellow vented bulbul |
Pynonotus goiavier |
|
|
Orangutan |
Orang utan |
Pongo abelli |
|
|
Kambing hutan |
Wild goat |
Capra aegagrus hircus |
|
|
Siamang |
Sumatra lar Gibbon |
Hylobates lar vestitus |
|
|
Cinenen |
Ashy tailorbird |
Orthotomus ruficeps |
|
|
Julang Emas |
Wrinkled Hornbill |
Aceros corrugatus |
|
|
Olva Sumatera |
Sumatra lar Gibbon type 2 |
Hylobates lar vestitus |
|
|
Desa Agusen LPHD Gembuluh Berkah |
Elang |
Eagle |
Haliastur indus |
|
Burung kedi |
Great knot bird |
Calidris tenuirostris |
|
|
Monyet ekor panjang |
Crab eating macaque |
Macaca fascicularis |
|
|
Burung Elang |
Eagle type 2 |
Haliastur indus |
|
|
Hutan Kota Langsa (Includes a zoo) |
Damar |
Resin tree |
Agathis borneensis Warb |
|
Burung bujuk/jalak |
Starling |
Sturnus contra |
|
|
Burung raja udang |
Alcedo meninting |
Blue eared kingfisher |
|
|
Burung perkutut |
Western Spotted dove |
Spilopelia suratensis |
|
|
Meranti Merah |
Red meranti |
Shorea leprosula |
|
|
Beringin |
Fig tree |
Ficus benyamina |
|
|
Biawak |
Monitor lizard, Goanna |
Varanus salvator |
|
|
Rusa |
Deer |
Cervus unicolor |
|
|
Kuda |
Horse |
Equus ferus caballus |
|
|
Kura-Kura |
Freshwater tortoises / terrapins |
Batagur baska |
|
|
Buaya |
Saltwater Crocodile |
Crocodylus porosus |
|
|
Mangrove Telaga Tujuh |
Monyet ekor panjang |
Crab eating macaque |
Macaca fascicularis |
|
Kelelawar |
Bat |
Craseonycteris thonglonglay |
|
|
Kepiting |
Crab |
Ocypode quadrata |
|
|
Kerang |
Shellfish |
Anadara granosa |
|
|
Siput |
Snail |
Cornu aspersum |
|
|
Cicak terbang |
Flying lizards, flying dragons or gliding lizards |
Draco volans |
|
|
Bangka minyak |
Mangrove tree A |
Rhizopora apiculata |
|
|
Bangka kurap |
Mangrove tree B |
Rhizopora mucronata |
|
|
Mangrove Group |
Monyet ekor panjang |
Crab eating macaque |
Macaca fascicularis |
|
Elang |
Eagle |
Haliastur indus |
|
|
Burung raja udang |
Alcedo meninting |
Blue eared kingfisher |
|
|
Kepiting |
Crab |
Ocypode quadrata |
|
|
Kerang |
Shellfish |
Anadara granosa |
|
|
Siput |
Snail |
Cornu aspersum |
|
|
Belangkas |
Horseshoe Crab |
Carcinuscorpius rotundicauda |
|
|
Coffee group KPH II |
Burung kuning |
Hairy backed bulbul |
Tricholestes criniger |
|
Tupai |
Squirrel/treeshrew |
Tupaia glis |
|
|
Burung ekor putih/kutilang |
Sooty headed bulbul |
Pycnonotus aurigaster |
|
|
Luwak |
Mongoose/Asian palm civet |
Paradoxurus hermaphroditus |
|
|
Hutan Kota Nagan Raya |
Burung prenjak |
Bar winged prinia |
Prinia familiaris |
|
Burung duit |
White chested babbler |
Trichastoma rostratum |
|
|
Burung tekukur |
Spotted dove |
Spilopelia chinensis |
|
|
Burung gereja |
Sparrow |
Passer montanus |
3.3 Carbon stock estimate accuracy and error
The limited number of plots in some of the forest areas and the wide variation in carbon values among these plots do impact the statistical accuracy for reporting carbon stock in the full forest area. The FC tool includes several metrics to understand the accuracy of the forest carbon stock estimates. Both the standard error and sample error are reported in the FC tool for the field plot inventory data. The FC tool also reports the lower and upper bound average Mg C ha-1 at the 95% confidence interval. These values are used to compute a lower and upper total carbon (Mg C) stock value along with the estimate computed from the average Mg C ha-1 for all plots. The tool also reports, based on the plot data input (given the standard and sampling errors, the mean, and standard deviation of the plot carbon (Mg C ha-1)), an estimated total number of plots to meet an accuracy of 95% confidence interval (CI) at 10%, 15%, and 20% error. Table 8 shows the two error values, mean plot carbon, upper and lower bound plot carbon, and the number of field plots together with the estimated number needed to meet an accuracy of 95% CI at 10%, 15% and 20% error for each of the nine forest areas.
The range of carbon values at the plot level is an obviously important factor. For any set of plots where the standard deviation is close to the mean carbon value, this, too, is an important factor. Only two forest area carbon estimates have a sufficient number of plots with low enough sampling and standard errors for accuracy at 95% CI and better than 15% error. These are Desa Agusen LPHD Gembuluh berkah and Pinus Group Reje Pudung/Terangun Gayo Lues. Two areas have an accuracy right at 95% CI and 20% error: HKm. Rumah Rungkoh and Mangrove Telaga Tujuh. The rest of the forest areas estimate carbon stock values with an accuracy of greater than 20% error at 95% CI. In the case of the mangrove forest with only four plots, there is such high variation in the plot carbon values that another 144 plots would be needed for an accuracy at 20% error, 95% CI (assuming no change to the mean carbon and standard deviation with the inclusion of the additional plots).
In the forest areas with fewer plots than required for significant accuracy, the lower bound estimate of carbon stock should be reported. It may also be prudent to stratify the forest area to help lower the variation of carbon at the plot level when estimating the forest carbon.
|
|
|
|
Mg C ha-1 |
||
|
Forest Area |
Standard Error |
Sampling Error |
Mean |
95% CI Lower Bound |
95% CI Upper Bound |
|
HKm. Rumah Rungkoh |
43.88 |
3.35 |
446.93 |
431.95 |
461.92 |
|
Desa Agusen LPHD Gembuluh berkah |
5.51 |
5.34 |
99.52 |
94.21 |
104.83 |
|
Hutan Kota Langsa |
16.86 |
7.59 |
119.07 |
110.03 |
128.11 |
|
Mangrove Telaga Tujuh |
26.54 |
4.32 |
269.86 |
258.2 |
281.51 |
|
Swamp Group |
16.56 |
9.3 |
121.53 |
110.23 |
132.83 |
|
Pinus Group Reje Pudung/Terangun Gayo Lues |
3.52 |
5.54 |
76.65 |
72.41 |
80.89 |
|
Mangrove Group |
153.1 |
16.35 |
240.91 |
201.53 |
280.29 |
|
Coffee group KPH II |
8.75 |
24.65 |
27.14 |
20.45 |
33.84 |
|
Hutan Kota Nagan Raya |
8.38 |
9.01 |
70.74 |
64.37 |
77.12 |
|
|
|
|
|
|
|
|
|
|
Plots for 95% CI at #% Error |
|
||
|
Forest Area |
No. of Plots |
10% |
15% |
20% |
|
|
HKm. Rumah Rungkoh |
10 |
38 |
17 |
10 |
|
|
Desa Agusen LPHD Gembuluh berkah |
10 |
12 |
5 |
3 |
|
|
Hutan Kota Langsa |
12 |
40 |
28 |
20 |
|
|
Mangrove Telaga Tujuh |
10 |
38 |
17 |
10 |
|
|
Swamp Group |
5 |
16 |
11 |
7 |
|
|
Pinus Group Reje Pudung/Terangun Gayo Lues |
10 |
8 |
3 |
2 |
|
|
Mangrove Group |
4 |
476 |
248 |
148 |
|
|
Coffee group KPH II |
10 |
158 |
108 |
75 |
|
|
Hutan Kota Nagan Raya |
12 |
46 |
26 |
16 |
|
4. Conclusion
The results of data collection by KPH staff and Social Forestry community members and their training on the use of the three ecosystem services tools is a proof of concept that several aspects of locally managed forest ecosystems can be measured. Forest carbon, tree biodiversity, forest integrity and health can develop forest management plans and actions that sustain and protect these services. Repeat measurements every two to five years can be used to monitor the effectiveness of forest resource management activities and provide necessary data for updating management plans and actions. This utilization of forest ecosystem services information is beneficial to forest managers responsible for balancing resource preservation, ecosystem health and resource use and in developing management plans that consider explicitly ecosystem services.
Two key factors impact the utility of measuring forest ecosystem services at the local level by KPH staff and Social Forestry community members. The first factor is allocating resources required to support field data collection. Data collection in forest ecosystems does not require expensive equipment, but it does take time and requires some specialized skilled labour for laying out nested plots, collecting tree biometric data, knowledge of local tree species and expert forest resource observation abilities. Teams of trained data collectors in certain forest conditions may only be able to complete data collection for one or two plots in a single day. Data allocation within large forest tracts may also require teams to hike several kilometres in adverse conditions (thick vegetation, heat, rain, steep topography, etc.). Funding data collection is a necessity to ensure enough plots are established to compute ecosystem services with some level of accuracy.
The second factor important for measuring forest ecosystem services is continued and expanded training for KPH staff and local people. This APN project was able to train 40 individuals from several KPH units and Social Forestry areas in Aceh Province. However, the need for these skills is national in Indonesia, with more than 600 KPH units planned and a goal of 12.7 million ha of lands under Social Forestry permits. Skills exist at several universities in Indonesia and through collaboration with non-national researchers and scientists outside of Indonesia that is sufficient to develop and implement a national training program for local forest managers at the KPH and community level. A training program scaled to the national level, however, will also require resources.
One final note of the value for this APN project beyond the forest ecosystem services results detailed in this technical report is one important and unexpected co-benefit. The implementation of the project through project collaborators at Universitas Syiah Kuala (USK) meant the opportunity also to train students at the undergraduate and graduate levels. Eighteen students from USK participated in data collection and training to use the tools and have included this in their academic education and research.
Acknowledgement
This technical report is based on work supported by the Asia-Pacific Network for Global Change Research (APN) under Grant No. CBA2020-10SY-Samek. We acknowledge the support of faculty, staff and students as well from Universitas Syiah Kuala, who gave their time to make the training workshops possible. We also thank the project participants from the KPH and Social Forestry areas who accepted the modifications to training due to the COVID-19 pandemic.