
Mass distribution of PET and PC microplastics in the atmosphere of Tianjin, China
Keywords
ATMOSPHERIC MICROPLASTICS · ATMOSPHERIC TRANSPORT · DISTRIBUTION CHARACTERISTICS · MASS SPECTROMETRY DETECTION · POLYETHYLENE AND POLYCARBONATE
HIGHLIGHTS
- The concentrations of polyethene terephthalate and polycarbonate microplastics in Tianjin’s atmosphere were significantly higher during the dry season (176.3 ± 22.3 ng/m3 and 41.0 ± 12.6 ng/m3) than in the wet season (49.6 ± 12.0 ng/m3 and 14.7 ± 6.5 ng/m3).
- The seasonal reversal of the East Asian monsoon, characterised by prevailing offshore winds during dry seasons and onshore winds during wet seasons, significantly influences atmospheric microplastic distribution in coastal regions.
- MPs in the downtown area may serve as a significant source of MPs in suburban regions.
1. INTRODUCTION
The environmental emissions and stable chemical structure of plastic waste lead to the accumulation of microplastics (MPs) on the Earth’s surface (Thompson et al., 2004). Due to the small size and low density, MPs from aquatic and terrestrial environments (Horton et al., 2017; Marcus et al., 2014; Rillig, 2012) can be entrained into the air (Allen et al., 2019; Bergmann et al., 2019; Brahney et al., 2020; Chen et al., 2023). Since the transport of MPs in the atmosphere is not limited by environmental boundaries, atmospheric transport may lead to broad diffusion of MPs (Mu et al., 2019). The hazards posed by MPs pollution to both ecosystems and human health have provoked widespread concerns (Pan et al., 2021, 2022). Given the risk of atmospheric MPs (AMPs) exposure through inhalation and the likelihood of concentration threshold adverse effects (Tanjil et al., 2025), it is crucial to describe the distribution of AMPs based on long-term observations.
Human activities can lead to a large number of MPs entering the environment; therefore, regions with more frequent human activities are one of the significant sources of atmospheric MPs (Liu, Li, et al., 2019; Liu, Wang, et al., 2019). Total suspended particle (TSP) contains suspended particles ranging from 0.1–100 µm that remain airborne for extended periods (measured in µg/m3), making them superior tracers for regional transport such as monsoon-driven microplastic dispersion (Wang et al., 2021). However, in China, most AMPs research only focuses on MPs in dust fall rather than MPs in suspended particulates (Liu, Wang, et al., 2019; Liu, Huang, et al., 2022; Yuan et al., 2023). China is affected by monsoons, which lead to different meteorological conditions between the dry and wet seasons (Yuan et al., 2023). Currently, only researchers in Guangzhou have conducted long-term observations of AMPs and compared the distributions of AMPs in dry and wet seasons (Yuan et al., 2023). However, Guangzhou is located in South China and is influenced by the South Asian monsoon (Yuan et al., 2023). In contrast, in North China, which is controlled by the East Asian monsoon (Xu et al., 2020), the distribution characteristics of AMPs have been rarely reported.
Current analytical methods for MPs primarily focus on morphological and physical characterisation using microscopy and spectroscopy techniques. While infrared and Raman spectroscopy provide chemical identification, atmospheric MP distributions in urban environments are still predominantly reported as quantitative particle concentrations (Chang et al., 2023; Dris et al., 2017; Levermore et al., 2020; Liu, Li, et al., 2019; Liu, Wang, et al., 2019). However, MPs quantification based on counting methods requires prior separation of MPs from environmental samples (Liu, Wang, et al., 2019), a process that may introduce significant systematic errors (Wang et al., 2017). Thus, research on the mass concentration of AMPs is urgently needed.
In this study, TSP samples from Tianjin were collected in both the wet season (June to August, 2022) and the dry season, December to February, 2021–2022). Atmospheric concentrations of polyethylene terephthalate (PET) and polycarbonate (PC) were quantified using the mass spectrometry method developed by Wang et al. (2017). This method involves depolymerising PET to purified terephthalic acid (PTA) and PC to bisphenol A (BPA), followed by LC-MS/MS analysis of these monomeric markers. The influence of meteorological factors on the distribution of PET and PC was explored. In addition, the backward trajectories of air masses at the sampling site were described. This study provides an enhanced understanding of the distribution of AMPs in areas influenced by the East Asian monsoon.
2. METHODOLOGY
2.1. Research area and sample collection
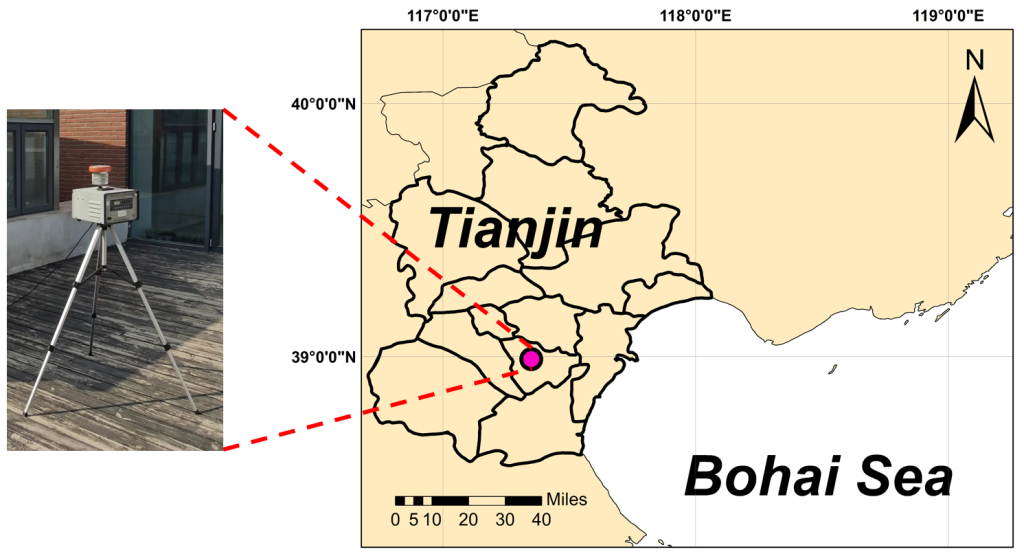
One of the largest cities in Northern China, Tianjin, was selected as the sampling city. The sampling site was located in the Jinnan District, a suburban area of Tianjin, with a population density of ∼1.5 × 10³/km2, compared to the urban core density of 23 × 103/km2. TSPs were collected every 10 days during two seasonal periods: the dry season (December 2021 to February 2022) and the wet season (June to August, 2022). A total of 18 samples were collected on the rooftop (10 m above ground level) of a building located more than 300 m from major traffic arteries (Figure 1). Samples were collected by an active sampler (TH-150 AII, Tianhong, Wuhan) with glass microfibre filters (Whatman GF/A, 90MM, 1.6 µm) for 24 hours at an intake flow rate of 100 L/min.
The sampling site is situated in a suburban area with low population density, characterised by fewer MP emission sources compared to densely populated urban regions. This suggests that the observed PET and PC concentrations likely reflect regional pollution levels rather than local contaminations. Meteorological data for Tianjin during the sampling periods, including rainfall, relative humidity, wind speed, and wind direction (Table 1), were obtained from the European Centre for Medium-Range Weather Forecasts (https://www.ecmwf.int/). Statistical analyses, including Spearman’s correlation and Mann-Whitney U test, were conducted in SPSS software (25.0, IBM, U.S.A.). Statistical significance was considered at α = 0.05. All figures were generated in Origin 2023b software (OriginLab Corporation, MA, U.S.A.).
| Month | Rainfall (mm) | Wind speed (m/s) | Relative humidity (%) | Northeast wind frequency (%) | Southeast wind frequency (%) | Southwest wind frequency (%) | Northwest wind frequency (%) |
|---|---|---|---|---|---|---|---|
| Dec | 0.65 | 3.19 | 45 | 17 | 11 | 40 | 31 |
| Jan | 5.95 | 2.62 | 50 | 24 | 26 | 22 | 29 |
| Feb | 5.98 | 3.09 | 37 | 21 | 11 | 33 | 35 |
| Jun | 63.01 | 3.43 | 60 | 31 | 45 | 15 | 10 |
| Jul | 164.72 | 3.4 | 69 | 18 | 40 | 32 | 11 |
| Aug | 175.03 | 2.73 | 65 | 14 | 26 | 40 | 20 |
| a Monthly wind speed, wind frequency, and relative humidity represent averages from sampling periods, while precipitation data reflect monthly averages since sampling was conducted on non-precipitation days. | |||||||
2.2. Depolymerisation of PC and PET in TSP
The degradation of PC and PET into their respective monomers, BPA and PTA, was achieved without prior separation, following a methodology developed by our team (Wang et al., 2017). In brief, a quarter of the filter membrane and 0.1 g of potassium hydroxide (KOH) were combined with 20 mL of 1-pentanol in a 100 mL round-bottom flask. This mixture was then heated at 135 °C under reflux conditions with condensation for 30 minutes. The depolymerised solutions were extracted using 20 mL of ultrapure water. The mixture was subjected to shaking at 180 rpm for 5 minutes before being centrifuged at 1570 × g for an additional 5 minutes. Following centrifugation, supernatants were combined and brought to 50 mL with ultrapure water. A 1 mL portion of this solution was then amended with 50 ng spikes of both 13C12-BPA and D4-PTA internal standards. The resulting mixture was passed through solid-phase extraction (SPE) cartridges to extract the target compounds, which were then redissolved in 1 mL of methanol for subsequent LC-MS/MS analysis.
2.3. Microplastics detected by LC-MS/MS
For analytical determination, we employed LC-MS/MS using an Agilent 1260 HPLC system interfaced with a G6460C triple quadrupole mass detector (Agilent Technologies, U.S.A.). Chromatographic separation was performed using two distinct C18 columns: PTA was analysed on an Ultra AQ C18 column (100 × 2.1 mm, 3.0 µm; Restek, U.S.A.), while BPA separation utilised a Boltimate C18 column (100 × 3 mm, 2.7 µm; Welch Materials, China), following established methodologies (Wang et al., 2017). Quantitation was performed using isotope dilution mass spectrometry with D4-PTA and 13C12-BPA as internal standards for PTA and BPA, respectively. The polymer mass concentrations were derived from monomer concentrations using the following conversion equations:
\[
\mathrm{PET}_{\text{amount}}
=
\frac{
\mathrm{PTA}_{\text{depolym}}
\cdot
\left(
\mathrm{MW}_{\mathrm{PTA-H_2O_2}}
/
\mathrm{MW}_{\mathrm{PTA}}
\right)
}
{f_{(\mathrm{PTA-H_2O_2})}}
\]
\[
\mathrm{PC}_{\text{amount}}
=
\frac{
\mathrm{BPA}_{\text{depolym}}
\cdot
\left(
\mathrm{MW}_{\mathrm{BPA\text{-}2H}}
/
\mathrm{MW}_{\mathrm{BPA}}
\right)
}
{f_{(\mathrm{BPA\text{-}2H})}}
\]
where PTAdepolym and BPAdepolym are the masses of PTA and BPA from the depolymerisation of polymer, MW is the molecular weight, and f is the mass percentage of PTA-H2O2 and BPA-2H in the polymer (77.4% for fPTA-H2O2, 89.5% for fBPA-2H).
2.4. Atmospheric load of PET and PC
Based on the method of Liu et al., the total amount of PET and PC in the atmosphere of Tianjin can be calculated as follows (Liu, Li, et al., 2019):
\[
\begin{array}{l r}
\text{Total weight of PET or PC} = C \cdot S_r \cdot h & (1) \\
S_r = S_{\text{Tianjin}} – S_{\text{land occupation}} & (2)
\end{array}
\]
Where C¯ is the average concentration of atmospheric PET/PC; h is the height of the atmospheric column, Sr, STianjin and Sland occupation represent the area without residence occupation, the total area of Tianjin (11966 km2), and the area occupied by buildings (133 km2) in 2023 (Tianjin Municipal Planning and Natural Resources Bureau, 2023). Given the poorly characterised vertical distribution of atmospheric microplastics, only the atmospheric column at the sampling height (10 m) was used to estimate the atmospheric PET and PC load.
2.5. Quality assurance and quality control
The chemical reagents used in this study were obtained from commercial suppliers with the following specifications: Deuterium-labelled D4-PTA (99% purity) was sourced from Sigma-Aldrich in the United States. The isotopic standard 13C12-BPA, certified at 99% purity, was acquired from Cambridge Isotope Laboratories (U.S.A.). For mobile phase preparation, HPLC-grade methanol and 1-pentanol were supplied by Meryer Chemical Technology Co., Ltd. (Shanghai), while ultrapure water was generated in-house using a Milli-Q purification system. Solid-phase extraction was performed using Oasis HLB cartridges (200 mg sorbent, 6 mL volume) manufactured by ANPEL Laboratory Technologies (Shanghai).
Glass microfiber filters, stainless tweezers and round-bottom flasks were wrapped in aluminium and then baked at 500 °C in a muffle furnace for four hours. The process of depolymerisation was conducted in the fume hood. Plastic products were avoided, except for polypropylene pipette tips and 50 mL centrifuge tubes, which were all rinsed with ultrapure water before use. The procedure blanks were subjected to the same treatment as the TSP samples. The procedure blank was analysed after every set of three samples during mass spectrometry detection, with the average concentration of 2.5 ± 0.4 ng/m3. The final concentrations of BPA and PTA were calculated by subtracting the results from the mass spectrometry detection from those of the process blank.
2.6. Air masses trajectory clustering
The Hybrid Single-Particle Lagrangian Integrated Trajectory (HYSPLIT) model (Hee et al., 2023; Huang et al., 2021) was used to calculate 24-hour backward trajectories for each sampling hour. The mid-boundary layer height was automatically determined by the model, which extracts the mixing layer height from the datasets and sets the starting height at half of this value. Backward trajectories were clustered by MeteoinfoMap 2.2.4 (China) (Wang, 2014) to explore the potential sources of MPs in wet and dry seasons, respectively.
The number of clusters is determined by the Trajectory Sector Variability (TSV). A steeper ascending TSV curve indicates more significant spatial differentiation among trajectories. The point of maximum TSV increase reveals where trajectories begin to show clear clustering patterns. The cluster number corresponding to this point most effectively distinguishes air masses from different source regions.
3. RESULTS AND DISCUSSION
3.1. The concentration of PET and PC in the atmosphere of Tianjin
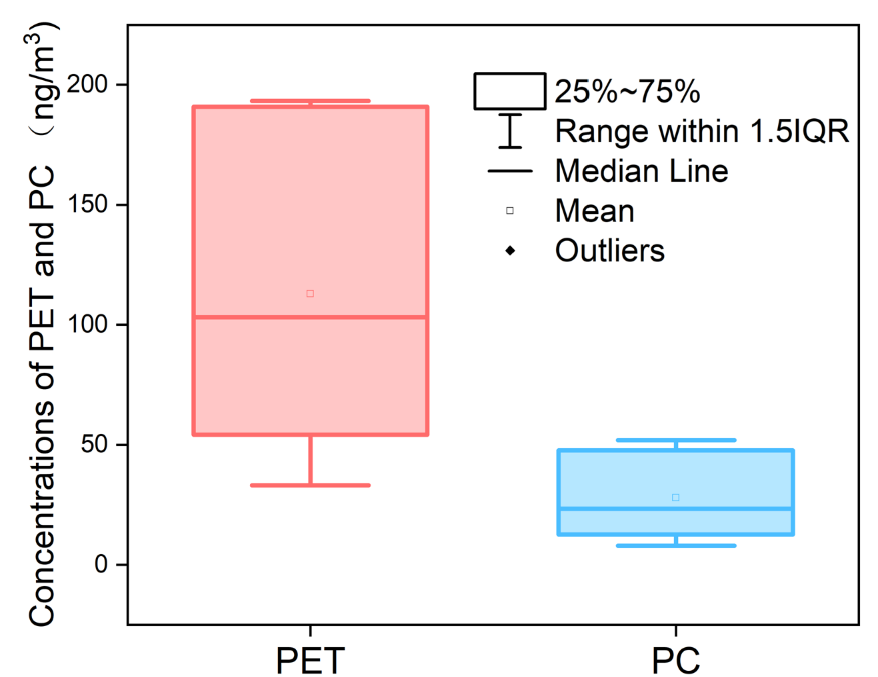
During the observation period, the concentration of PET in the atmosphere of Tianjin ranged from 33.1 to 193.3 ng/m3 with an average of 112.9 ng/m3. The concentration of PC ranged from 7.9 to 51.9 ng/m3 with an average of 27.8 ng/m3 (Figure 2). The significantly lower (p < 0.05) concentration of atmospheric PC is consistent with the global production of PC plastic. PET is primarily used for producing polyester fibres and plastic bottles and is currently one of the most widely produced polymers globally (Kuczenski & Geyer, 2010). In contrast to PET, PC is an engineering plastic (Liu, Li, et al., 2019), and its global production (4.4 million tons) is significantly lower than that of PET (53.3 million tons) (Kausar, 2018). This lower production may explain the significantly lower atmospheric concentrations of PC compared to PET.
Our results suggest that at least 13.4 kg of PET and 3.3 kg of PC are suspended in Tianjin’s atmosphere near the ground (10 m). By contrast, a study in Shanghai, a city with higher population density than Tianjin, reported only 8.91 kg of total MPs in the near-surface air (33 m height), with PET accounting for ∼30% and PC remaining undetected (Liu, Li, et al., 2019). The PET load in Tianjin significantly exceeds that in Shanghai, even after accounting for Tianjin’s twofold larger area. In the study of Shanghai, the smallest detected MP was 23 µm (Liu, Li, et al., 2019), as the counting methods were unable to precisely identify smaller than this size. These methodological constraints may lead to substantial underestimation of atmospheric MPs loads.
3.2. Influences of meteorological factors
Concentrations of atmospheric PET (176.3 ± 22.3 ng/m3) and PC (41.0 ± 12.6 ng/m3) were significantly higher (p < 0.05) in the dry season than in the wet season (49.6 ± 12.0 ng/m3 and 14.7 ± 6.5 ng/m3) (Figure 3A). This result contrasts with findings in Guangzhou, where higher atmospheric MPs concentrations occurred in the wet season, primarily due to lower wind speeds limiting dispersion (Yuan et al., 2023). Previous studies have shown that wind from the ocean may dilute the AMP concentration over land (Liu, Wang, et al., 2019; Szewc et al., 2020). Thus, in Tianjin, a coastal city, the concentrations of PET and PC may be influenced by distinct seasonal wind directions (Szewc et al., 2020). The relative humidity is higher during the wet season, and the moisture film between particles and the soil surface can inhibit the transport of surface particles into the atmosphere (Yuan et al., 2023). Additionally, particles adsorbing water in the atmosphere may increase in density, which can accelerate the deposition of atmospheric microplastics (Yuan et al., 2023). As a type of dust, AMPs theoretically follow a settling and re-suspension pattern similar to other soil minerals, so high humidity may lead to a decrease in the concentration of PET and PC in the atmosphere.
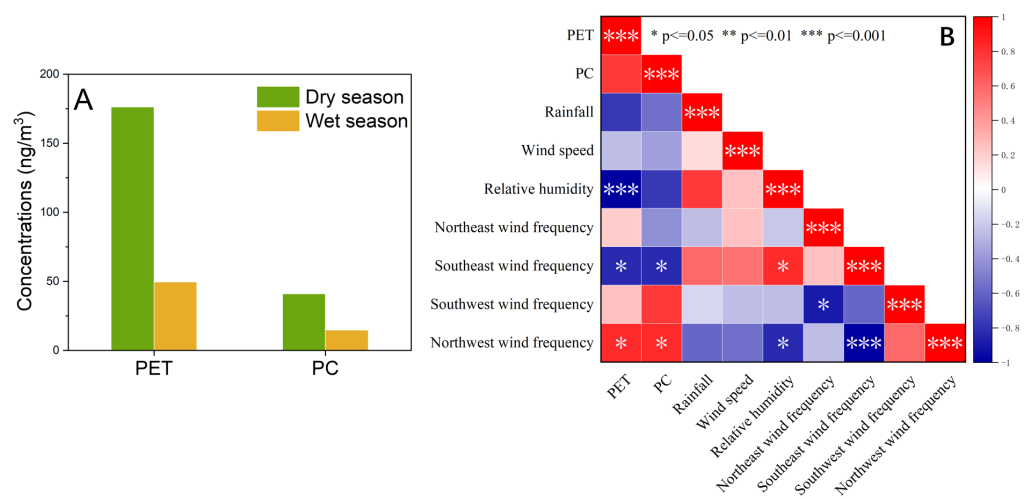
The correlation plot was used to explore the influence of meteorological factors on the distribution of atmospheric PET and PC (Figure 3B). Wind directions showed a significant influence on the distribution of atmospheric PET and PC, as the concentrations of both polymers negatively correlated with the frequency of southeast winds (p < 0.05 and r = −0.88 for PET, p < 0.05 and r = −0.96 for PC) while positively correlated with the frequency of northwest winds (p < 0.05 and r = 0.94 for PET, p < 0.05 and r = 0.89 for PC) (Figure 3B). This phenomenon may be attributed to the transport of higher MP loads by winds from northwestern downtown areas. In contrast, southeasterly marine winds tend to dilute MP concentrations at the sampling site. Fibrous atmospheric MPs have a larger surface area, thus, are more likely to absorb the water in the atmosphere. This can result in an increased density of fibrous MPs, which in turn accelerates their deposition (Yuan et al., 2023). Although this study did not characterise AMP morphology, atmospheric PET likely contains a higher proportion of fibres than PC because PET is the primary material in polyester fibre production (Dris et al., 2017; Peng et al., 2023). Consequently, a significant negative correlation was observed only between PET concentrations and relative humidity (p < 0.001 and r = −0.97) (Figure 3B). Several studies suggest that MPs entering water environments are unlikely to be resuspended in the atmosphere for a short period, which could result in a decrease in AMPs concentration (Baatar et al., 2017; Speirs et al., 2023). However, no significant correlation was observed between precipitation and the distribution of PET and PC. This discrepancy may originate from our dry-day sampling protocol, which utilised monthly averaged rainfall data rather than event-based measurements.
3.3. Potential sources of atmospheric PET and PC
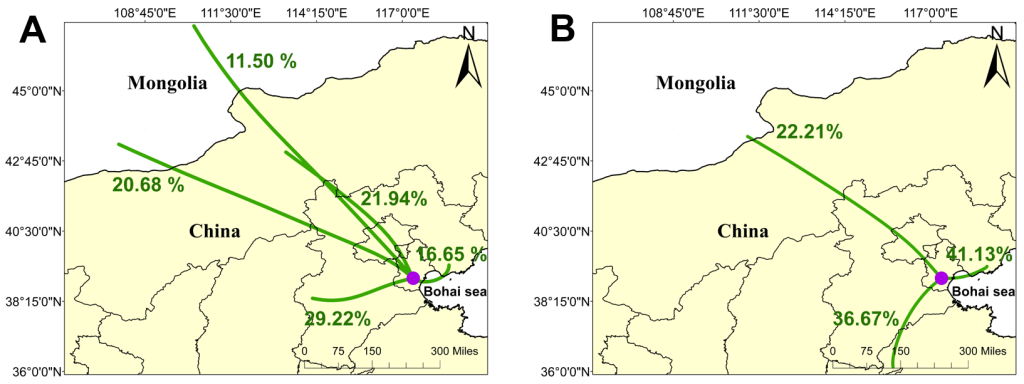
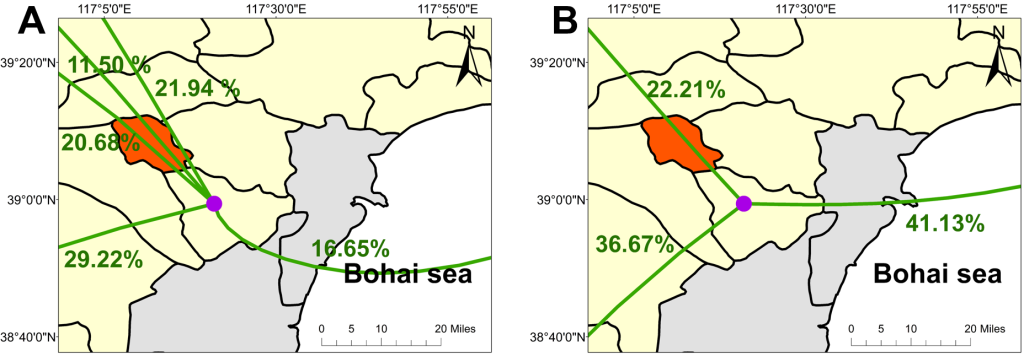
The East Asian monsoon influences Tianjin. In summer (wet season), winds blow from the ocean towards the land, while in winter (dry season), the prevailing wind directions are completely reversed. The HYSPLIT model has been widely used to trace the source of AMPs (Huang et al., 2021; Wang et al., 2021). Using this model to explore the origination of air masses in the sampling point, it was found that only 17% of the air mass came from the sea, while 83% came from densely populated inland regions of North China during the dry season (Figure 4A). In contrast, a higher proportion of air masses (41%) passed over the ocean during the wet season (Fig 4B). Human activities, such as the improper disposal of industrial waste and the wear and tear of automobile tyres (Borthakur et al., 2022; Cui et al., 2023; Wang et al., 2021), can all result in large amounts of MPs entering the environment. Then, wind (Tian et al., 2023), turbulence generated during vehicle driving (Brahney et al., 2020), and mechanical force generated by soil turning (Isari et al., 2021; Yang et al., 2022) will provide the power for MPs in the environment to enter the atmosphere. Therefore, AMP concentration is often higher in areas with higher population density (Liu, Wang, et al., 2019; Levermore et al., 2020). In comparison, AMP levels over the ocean are typically much lower than those over land (Liu, Li, et al., 2019, Liu, Wang, et al., 2019). Consequently, the sampling site exhibited significantly lower PET and PC concentrations during the wet season. Furthermore, trajectory analysis indicated that 53% of air masses passed through Tianjin’s downtown during the dry season, compared to 22% during the wet season (Figure S1). This observation, combined with higher PET and PC concentrations found at the sampling site when northwest winds prevail (Figure 3B), provides further evidence that MPs in the urban centre may serve as a significant source of MPs in suburban regions.
4. CONCLUSION
In North China, which is influenced by the East Asian monsoon, the distribution characteristics of AMPs are rarely reported. This study quantified atmospheric PET and PC using liquid chromatography-tandem mass spectrometry (LC-MS/MS). The results suggest that at least 13.4 kg of PET and 3.3 kg of PC are suspended in the near-ground atmosphere of Tianjin.
Higher PET and PC concentrations were observed during the dry season. Wind direction significantly influenced the distribution of MPs. During the wet season, prevailing southeasterly winds from the ocean diluted PET and PC concentrations in suburban air. In contrast, the dominant northwesterly winds in the dry season likely transported airborne pollutants from inland regions. Both wind direction and backward trajectory analyses suggest that airborne PET and PC in the downtown area may constitute a significant source of PET and PC in the suburban atmosphere.
5. ACKNOWLEDGEMENTS
This work was supported by the Asia-Pacific Network for Global Change Research (CRRP2020-01MY-Wang), the National Natural Science Foundation of China (42077336 & 42177373), the 111 Program of the Ministry of Education, China (T2017002), and the Fundamental Research Funds for the Central Universities of China. This work was also partly supported by the National Natural Science Foundation of China (42177373).