Integrating geospatial technologies in climate-smart agriculture planning and management: A review focused on South Asia
Keywords
Climate-smart agriculture · Remote sensing · Spatial data infrastructure · Volunteered geographic information
HIGHLIGHTS
- Geospatial technologies are vital for data-driven precision agriculture practices
- CSA strategies can leverage geospatial technologies to mitigate climate change
- Need to address challenges and opportunities for emerging technologies adoption
1. INTRODUCTION
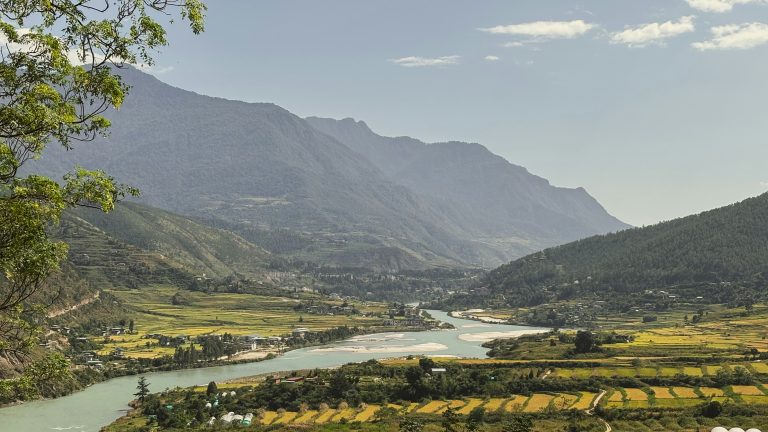
Climate change has emerged as a paramount global challenge, significantly impacting agriculture and food security in recent decades (Shiferaw et al., 2013). South Asia, including Nepal, Bhutan and Pakistan, is particularly vulnerable to the adverse effects of climate change due to its agrarian economies and geographical susceptibilities (Miyan, 2015). Agricultural planning is complicated in mountainous regions like Nepal, Bhutan and Pakistan due to common issues like melting glaciers, shifting water tables, irregular rainfall patterns, and degraded soil (Bhusal et al., 2016; Molden et al., 2022; Tariq et al., 2021). Therefore, developing strategies that are successful requires an understanding of these local difficulties.
Insights from Nepal, Bhutan and Pakistan offer valuable lessons for the entire region, emphasising a collaborative approach to address global climate change impacts on agriculture. By exploring geospatial technologies in smart agriculture, the report discusses how lessons learned can benefit South Asia and contribute to global efforts in sustainable and climate-resilient agriculture (CRA). In the challenging landscapes of Nepal, Bhutan and Pakistan, understanding local intricacies is crucial for effective agricultural planning. Climate Smart Agriculture (CSA) is a comprehensive approach addressing climate change challenges in the agricultural sector (Chandra et al., 2018). This study focuses on integrating geospatial technologies into CSA planning in South Asian countries, highlighting its transformative potential. Geospatial technologies, including Geographic Information Systems (GIS), Remote Sensing (RS), and Global Navigation Satellite System (GNSS), play a vital role in assessing and managing agricultural systems (Senanayake et al., 2020). Their integration in CSA planning offers a revolutionary perspective for CRA in South Asia.
The global disruption of traditional agriculture due to climate change and its resulting impact on food security underscores the essential role of geospatial technologies like RS and GIS in addressing these challenges (Altieri & Nicholls, 2017; Thakur et al., 2017). These technologies significantly transform decision-making and resource optimisation by enabling informed choices through precise mapping and monitoring, thereby fostering sustainable agricultural practices (Erskine et al., 2013; Shafi et al., 2019).
On the contrary, geospatial tools offer the ability to gather, examine and display spatial data that are essential for understanding agricultural systems under changing climatic conditions. Within the framework of CSA, these technologies play a significant important role in supporting its three pillars: improving productivity through precision farming and crop monitoring; strengthening adaptation by enabling early warning systems, land-use mapping and water resource management; and contributing to mitigation through carbon monitoring and sustainable land-use planning (Altieri & Nicholls, 2017; Malinas et al., 2025; Shafi et al., 2019).
Spatial Data Infrastructures (SDIs) are essential for facilitating data sharing in agriculture, requiring active participation from organisations and governments to establish them for information exchange and emergency planning (Rahman & Szabó, 2020; Vancauwenberghe et al., 2014). A cooperative approach to agricultural decision-making is encouraged by involving farmers through the Volunteered Geographic Information (VGI) applications (Corbett, 2013; Haworth et al., 2018).
The study presents regional studies from South Asian countries, demonstrating successful applications of geospatial data in climate risk assessment and enhancing decision-making in precision agriculture (PA). Real-time monitoring and Early Warning Systems (EWSs), facilitated by geospatial technologies, enhance resilience to climate-related challenges, contributing to sustainable agriculture (Agbehadji et al., 2023; Girotto et al., 2023).
While the significance of geospatial technologies is widely acknowledged, a comprehensive understanding of their applications is lacking in South Asian countries (Herold & Sawada, 2012). This research aims to fill this gap by exploring geospatial technology integration in CSA in Nepal, Bhutan and Pakistan, providing insights for policymakers, practitioners and researchers. The study provides region-specific perspectives into the global discourse on sustainable agriculture, underscoring the complex interconnections among climate change, agricultural practices and geospatial technologies.
2. METHODOLOGY
Literature was reviewed on the available geospatial applications, RS, agriculture and climate change in South Asia. The review specifically concentrated on Nepal, Bhutan and Pakistan, taking into account data and information available across various spatial scales, including regional and national levels.
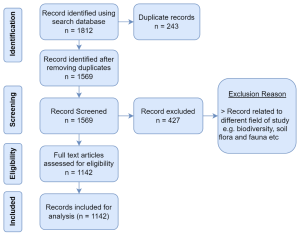
A systematic literature review approach (Dewey & Drahota, 2016) was used following the PRISMA protocol (Page et al., 2021) for this study. The review process comprised two phases. The initial phase encompassed several steps: (a) delineating the analysis scope to establish study boundaries; (b) identifying studies based on keywords, timeframes, document types and languages; and (c) scrutinising and appraising pertinent papers. Subsequently, the second phase entailed extracting and presenting pertinent information from the studies identified and chosen in the first phase (Thakuri et al., 2022). The study’s conceptual framework is illustrated in Figure 1.
Data utilised in this study were gathered from the Web of Science database, employing the specified keywords: agriculture and geospatial applications, climate-smart agriculture in South Asia (including Nepal, Bhutan, Pakistan), and agriculture and remote sensing.
3. RESULTS AND DISCUSSION
3.1. Geospatial technologies in agriculture
Climate change poses a significant threat to agriculture, affecting crop yields, water availability and overall food security (Misra, 2014). South Asian countries, including Nepal, Pakistan and Bhutan, are particularly vulnerable to these changes due to their dependence on agriculture (Lal, 2011). In response to these challenges, there is a growing interest in integrating geospatial technologies into CSA planning and management (Barasa et al., 2021).
To improve agricultural practices and boost productivity, geospatial technologies are essential (Pandey & Pandey, 2023). This technique utilises remotely sensed data and imagery acquired by GPS-tagged drones, satellites and aerial platforms. This technique makes it simple to map and track crop and soil conditions (Pandey & Pandey, 2023).
3.1.1. Remote sensing and GIS applications
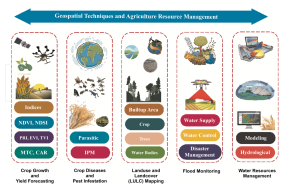
Remote sensing technology has been widely used in agriculture, from the allocation of area for cultivation, yield estimation, spatial distribution of crops, agricultural insurance, monitoring agricultural disasters, and safeguarding the agricultural environment. Several edited books have compiled the potential application of RS in agriculture (Ahamed, 2022; Li et al., 2022; Liu & Jiao, 2016; Kerry & Escolà, 2021; Vadrevu et al., 2022). Previous studies (Atzberger, 2013; Weiss et al., 2020) demonstrated the utility of RS data for monitoring crop health, assessing land use changes and predicting agricultural productivity. GIS, as highlighted by Castella et al. (2007) and Zysk et al. (2020), aids in spatial analysis, helping farmers and policymakers make informed decisions regarding land allocation and resource management (Figure 2).
3.1.2. Climate data integration
The comprehensive integration of geospatial technologies in the agricultural landscapes of Nepal, Bhutan and Pakistan yields transformative results, offering valuable insights and advancements in CSA. The synthesis of RS, GIS and GNSS emerges as a powerful strategy for planning and managing agriculture in the face of climate change challenges. Equally important is the incorporation of climate data, which helps identify location-specific CSA practices and supports for the development of strategies for their broader dissemination. Research (Challinor et al., 2018; Ruane et al., 2015) emphasises the significance of incorporating historical climate data to develop predictive models for crop performance under changing climate conditions. Understanding the region-specific climatic patterns in these countries is imperative for tailoring agricultural strategies.
3.2. CSA practices
3.2.1. Sustainable water management
Effective water management is paramount for CSA in South Asia. Ahansal et al. (2022) proposed a geospatially informed water management strategy, optimising irrigation practices based on soil moisture content and weather patterns. This approach contributes to water conservation, addressing the increasing water scarcity challenges faced by these countries.
3.2.2. Precision agriculture (PA)
Using geospatial technologies, PA adapts farming methods to specific microenvironments within a field (Singh et al., 2023). To improve resource efficiency, reduce environmental impact and maximise yields, PA uses data-driven technologies to detect, quantify, and react to temporal and spatial variability in crops. It is worthwhile investigating the applicability of PA concepts in this domain further.
3.3. Regional perspectives: Nepal, Pakistan, and Bhutan
In Nepal, where agriculture sustains a significant portion of the population, geospatial technologies have been widely applied to soil erosion monitoring, watershed management and climate adaptation. Studies highlight the value of participatory mapping in engaging local communities for sustainable land practices (Aksha, 2018; Bhandari et al., 2015; Murthy et al., 2014; Thapa et al., 2019). Similarly, Bhatta et al. (2017) explored the use of geospatial tools for assessing crop vulnerability across diverse agroecological regions of Nepal, offering insights for targeted adaptation strategies.
Nepal’s topographical diversity poses unique challenges, and geospatial technologies have been essential in mapping and managing these varied landscapes (Uddin et al., 2015). Thapa et al. (2023) applied satellite imagery and GIS to map landslide susceptibility, supporting disaster preparedness in hilly farming communities. Additionally, Shrestha and Khanal (2020) examined the use of satellite-based data for crop production prediction, which provided insightful information about how to enhance Nepalese agricultural practices.
Pakistan, facing challenges such as water scarcity and changing weather patterns, has seen notable advancements in geospatial applications. Hassan and Goheer (2021) explored the use of satellite imagery for crop monitoring and yield prediction, highlighting the potential of real-time data to enhance agricultural decision-making. Likewise, Aslam et al. (2018) investigated the integration of GIS and climate modelling to assess climate change impacts on crop suitability across regions, offering valuable guidance for adaptation strategies that support sustainable agriculture.
Satellite imaging is used to address Pakistan’s water scarcity problems. Water management plans can be made more informed and effective by using this application to monitor and analyse water supplies and usage trends (Basharat, 2019; Butt et al., 2015). These applications assist in identifying areas prone to water scarcity and guiding targeted interventions for improved water governance.
Bhutan’s unique topography and reliance on subsistence farming make it a compelling case for geospatial interventions in agriculture. Wang et al. (2021) highlighted the use of GIS for mapping and managing high-altitude agricultural landscapes, considering the nuances of a country’s agroecological zones. Similarly, Dorji et al. (2022) and Gilani et al. (2015) explored the application of RS and GIS in assessing land-use changes and their implications for agriculture, contributing to a better understanding of the dynamic nature of land use and guiding informed land management decisions. Meanwhile, in Bhutan, GIS technology also supports high-altitude farming by analysing terrain and environmental conditions, helping farmers make better decisions on crop selection, cultivation methods and resource management (Chhogyel et al., 2020; Tashi, 2018).
When combined, these case studies demonstrate how geospatial technologies can help South Asia’s climate-smart agricultural progress. Pakistan highlights the use of crop adaptability and water scarcity, Bhutan exhibits their worth in high-altitude farming, and Nepal demonstrates their importance in addressing topographical problems and disaster risks. The growing integration of RS and GIS for farm and policy decision-making is a shared strength among these nations. When taken as a whole, these examples show how geospatial technologies are gradually forming a regional route toward more robust and adaptable agricultural systems, even while national settings vary.
3.4. Geospatial technologies: South Asia’s multifaceted transformation
Geospatial technologies play an important part in shaping various sectors in South Asian countries, with relevance in the distinctive contexts of Nepal, Pakistan and Bhutan. These nations have harnessed the power of geospatial applications for diverse purposes, showcasing the multifaceted impact of technology on their development.
Nepal extends the application of GIS technology beyond agriculture by employing it in urban planning initiatives, ensuring a comprehensive and well-informed approach to the development of urban areas. In Pakistan, GIS plays a pivotal role in optimising transportation systems, providing a sophisticated tool for monitoring and enhancing the efficiency of the country’s transportation infrastructure. Similarly, Bhutan relies on GIS to guide urban development, ensuring that the growth and planning of urban spaces are strategically aligned with geographic data and spatial analysis (Bhattarai & Conway, 2010; Dorji et al., 2022; Hina et al., 2020; Kazmi & Zubair, 2014).
The healthcare sector also benefits from geospatial technologies and tools in South Asian countries. Nepal uses GIS for tracking disease spread and planning vaccination campaigns (Dhimal et al., 2015). Pakistan applies it to optimise healthcare facility locations based on population density and accessibility (Ahmed et al., 2019). Bhutan integrates geospatial tools for disease mapping and health infrastructure planning, contributing to effective public health management (Ebener et al., 2018; Tsheten et al., 2021). Together, these cases illustrate how geospatial technologies serve as versatile tools that adapt to national priorities while collectively advancing sustainable development in South Asia.
Satellite-based weather prediction is increasingly supporting CSA in South Asia, providing real-time data for rainfall, temperature, humidity and cloud cover, which are widely used for monsoon forecasting, early warning and agro-advisory services. These predictions enable farmers to make informed decisions on planting schedules, irrigation planning and risk reduction strategies. For instance, satellite-derived rainfall estimation and monsoon monitoring have been applied in the South Asian region to improve seasonal forecasts and enhance resilience to extreme weather events. Integrating such systems within CSA practices ensures better preparedness against climate variability and supports long-term sustainability of agriculture in the region (Das, 2022; Li et al., 2022a; Nadeem et al., 2022).
3.4.1. Regional geospatial farming and disaster management
In Nepal, precision farming uses geospatial technologies to provide real-time data on soil health, moisture and crops, helping farmers enhance efficiency (Shrestha & Khanal, 2020). Similarly, Pakistan uses RS for crop health monitoring and GIS for informed decision-making, while Bhutan applies geospatial tools to improve farming practices (Hassan et al., 2022; Mayer et al., 2023).
In disaster management, Nepal relies on geospatial technologies for early warnings, Pakistan uses satellite imagery and GIS for post-disaster assessment, and Bhutan employs geospatial tools for both warnings and assessments (Gurung et al., 2014; Murthy et al., 2014). Across the region, GIS also supports urban planning, including land-use mapping, traffic management and strategic urban development (Chu, 2020; Khan et al., 2021).
EWSs play a particularly important role in this context, as they provide timely information on droughts, floods and heavy precipitation events. Geospatial technologies, including RS and GIS, enhance these systems by enabling real-time monitoring of rainfall, soil moisture and vegetation stress, while integration with weather forecasting models strengthens predictive capacity (Van Ginkel & Biradar, 2021). Mobile and web-based dissemination platforms further ensure that location-specific agro-advisories reach farming communities on time, helping them take proactive measures. Strengthening EWSs within CSA frameworks thus not only reduces crop losses but also supports farmers in making proactive decisions that build long-term resilience (Thapa, 2021).
For instance, in Nepal, the Department of Hydrology and Meteorology (DHM), in collaboration with the Nepal Agricultural Research Council (NARC), has piloted agro-advisory services that deliver weather-based crop recommendations to farmers through mobile platforms and local extension channels. Such initiatives demonstrate the practical potential of integrating remote sensing, meteorological data and geospatial analysis into operational early warning and advisory systems (Chapagain et al., 2023). Expanding these efforts across the region could play a vital role in reducing climate risks, minimising crop losses and enhancing the resilience of smallholder farmers.
3.4.2. Healthcare geospatial empowerment
GIS is frequently utilised in South Asia to help with disease management and healthcare planning. In Nepal, it enables disease mapping, allowing authorities to track and analyse the spread of diseases (Bhunia & Shit, 2019). To ensure effective resource allocation based on population density and accessibility, geospatial data is used to strategically design and site healthcare facilities in Pakistan, where optimising healthcare infrastructure is a top priority (Hussain et al., 2008).
Geospatial technology is also being used in Bhutan’s healthcare plans. Bhutan is able to make well-informed judgments for efficient public health management using GIS in disease mapping and health infrastructure design. Bhutan seeks to improve the entire healthcare system by comprehending the regional trends of illnesses and optimising medical facilities using spatial data (Jamtsho et al., 2015). As a result, a geospatial tool facilitates the planning and execution of focused treatments, which are especially important for managing vector-borne illnesses.
3.4.3. Environment, forest, and biodiversity conservation
Advanced mapping and spatial analytics technologies, adapted to the distinct ecosystems of Nepal, Pakistan and Bhutan, are crucial to environmental conservation efforts in these nations. GIS and satellite photography provide for thorough environmental monitoring in Nepal, assisting authorities in tracking changes over time in vegetation, land cover and other ecological variables. This approach supports the identification of potential threats and the design of targeted conservation strategies (Adhikari et al., 2018; Chettri et al., 2013).
Nepal employs satellite imagery and GIS for comprehensive ecosystem monitoring, enhancing its ability to observe changes in land cover, vegetation and other ecological features over time, thereby enabling authorities to track environmental changes, identify potential threats and formulate targeted conservation strategies (Adhikari et al., 2018; Chettri et al., 2013). Pakistan relies on geospatial technologies for crucial roles in water body and forest management, utilising satellite imagery to monitor water resources, assess water quality, detect pollution sources and implement sustainable water management measures. GIS further supports effective forest management, enabling the monitoring of forest cover, tracking deforestation trends and planning conservation efforts to preserve the country’s rich biodiversity (Khan et al., 2018; Shafi et al., 2020).
In keeping with its commitment to sustainable environmental practices and guaranteeing the long-term health and resilience of its diverse ecosystems, Bhutan places strong emphasis on biodiversity monitoring and sustainable environmental practices through GIS, which aids in the analysis of spatial data to identify and protect critical habitats (Penjor et al., 2021; Tshewang et al., 2021).
When taken as a whole, the research and methods used in these three nations show that, although geospatial technologies are used for a similar goal, they are not implemented consistently but rather are tailored to the unique priorities and context of each nation. These technologies serve as adaptable instruments that promote sustainable resource management, strengthen environmental resilience and protect biodiversity across South Asia in all these contexts.
3.4.4. Potential GIS layers, tools, and technologies for CSA practice
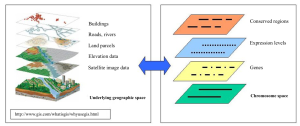
Potential GIS layers relevant to CSA include climate variables, soil properties, biodiversity and conservation data. These layers serve as a foundation for informed decision-making, risk assessment, vulnerability analysis and the strategic planning of CSA interventions (Table 1) e.g., Figure 3.
| SN | Layer | Source | Characteristics | Reference |
|---|---|---|---|---|
| 1 | Climate Data | Meteorological stations, satellite data, climate models | Temperature maps, precipitation maps, climate anomaly maps, climate zoning maps | (Feidas et al., 2014; Funk et al., 2012; Lelovics et al., 2014) |
| 2 | Soil Information | Soil surveys, RS, ground-based sensors | Soil type maps, soil moisture maps, soil erosion maps, soil fertility maps | (Fathololoumi et al., 2021; McBratney et al., 2003; Senanayake et al., 2020) |
| 3 | Topography and Landform | Digital Elevation Models (DEMs), satellite data | Elevation maps, slope maps, aspect maps | (Isioye & Jobin, 2012; Saadat et al., 2008) |
| 4 | Land Use and Land Cover | Satellite imagery, land use surveys | Land use maps, land cover change maps, cropland maps | (Horvat, 2013; Yang & Liu, 2005) |
| 5 | Water Resources | Hydrological models, satellite data, ground-based sensors | River and stream maps, water quality maps, aquifer maps | (Baffaut et al., 2015; Pisinaras et al., 2010) |
| 6 | Vegetation and Crop Health | RS, satellite data | NDVI maps, crop health maps, crop yield prediction maps | (Moussa Kourouma et al., 2021; Panda et al., 2010; Petersen, 2018) |
| 7 | Infrastructure and Access | GIS databases, government records | Road and transportation maps, market access maps, infrastructure maps | (Gutiérrez et al., 2010; Lei & Church, 2010; Vulevic et al., 2018) |
| 8 | Socioeconomic | Census data, socioeconomic surveys | Population density maps, income level maps, education and health facility maps | (Dulin et al., 2010; Stevens et al., 2015) |
| 9 | Biodiversity and Conservation | Biodiversity databases, conservation records | Biodiversity hotspot maps, protected area maps, habitat maps | (Huang et al., 2020; Signorello et al., 2018) |
| 10 | Risk and Vulnerability | Disaster records, disease surveillance | Natural disaster risk maps, disease risk maps, climate vulnerability maps | (Dickin et al., 2013; Petersen, 2018; Van Westen, 2013) |
| 11 | Land Surface Temperature | Satellite thermal imagery (e.g., Landsat, MODIS) | Monitoring land surface temperature variations, aiding in assessing heat stress on crops | (Feizizadeh et al., 2013; Li et al., 2013) |
| 12 | Adaptation and Mitigation Potential Maps | Climate change adaptation and mitigation models | Mapping areas with high potential for climate-smart practices, guiding policy decisions | (Andrieu et al., 2021; Scherr et al., 2012) |
| 13 | Historical Crop Performance | Historical crop yield data, satellite imagery | Assessing past crop performance to inform future planning and adaptation strategies | (Challinor et al., 2018; Peng et al., 2020) |
| 14 | Satellite-Based Irrigation Monitoring | Satellite data, RS | Monitoring and optimising irrigation practices for water-use efficiency | (Foster et al., 2020; Tan et al., 2018) |
| 15 | Agro-Ecological Zone Maps | Agro-ecological studies, climate data | Defining zones with similar ecological conditions for tailored agricultural practices | (Liu et al., 2017; Mugandani et al., 2012; Van Wart et al., 2013) |
| 16 | Groundwater Depth Maps | Groundwater monitoring stations, hydrological models | Mapping the depth of groundwater tables to inform irrigation strategies | (Condon & Maxwell, 2015; Devia et al., 2015; Maxwell et al., 2015) |
In the South Asian context, the most practical layers are those derived from freely available datasets such as Landsat, Sentinel and MODIS, which provide adequate spatial and temporal coverage for agricultural monitoring. While high-resolution commercial datasets offer greater precision, their cost often limits accessibility. Considering institutional and technical capacity, countries in the region tend to rely more on open-source and globally accessible data products, which can be effectively used for crop mapping, drought monitoring and land use assessments.
A range of geospatial tools and technologies are relevant to CSA planning and management, spanning industry-standard software such as ArcGIS and QGIS to open-source platforms like Leaflet and Mapbox (Table 2). This diversity enhances both accessibility and adaptability, while also highlighting the role of APIs, programming languages, and coding in geospatial data processing, visualisation and analysis (Kilsedar & Brovelli, 2020; Ledur et al., 2015).
| SN | Tool/Technologies | Description | Reference |
|---|---|---|---|
| 1 | ArcGIS | Developed by Esri, ArcGIS is a comprehensive suite of mapping and spatial analytics tools. It includes desktop, web, and mobile applications for creating, analysing and sharing maps | (Bajjali, 2017; Ormsby et al., 2010) |
| 2 | QGIS (Quantum GIS) | An open-source GIS software that offers a user-friendly interface for creating, editing, visualising and analysing geospatial data | (Flenniken et al., 2020; Moyroud & Portet, 2018; Thiede et al., 2014) |
| 3 | Google Earth | A web-based mapping tool that enables users to explore the Earth in 3D, view satellite imagery and access various layers of GIS | (Tooth, 2015; Wang et al., 2013; Yu & Gong, 2012) |
| 4 | Leaflet | A JavaScript library available as open-source for generating interactive maps on the web. It is lightweight and customizable, making it suitable for web and mobile applications. | (Edler & Vetter, 2019; Farkas, 2017) |
| 5 | Mapbox | A mapping platform that provides customizable maps, geocoding and navigation services. It offers APIs and SDKs for developers to integrate maps into their applications. | (Airlangga & Rachman, 2022; Hidayatulloh & Airlangga, 2022; Rzeszewski, 2023) |
| 6 | OpenLayers | An open-source JavaScript library for presenting map data within web browsers. It supports various map providers and allows for the creation of interactive maps. | (Farkas, 2017; Hazzard, 2011) |
| 7 | Carto | Formerly known as CartoDB, Carto is a cloud-based mapping and visualisation platform. It enables users to create and share interactive maps without the need for extensive coding. | (Jansen & Seraj, 2020; Netek et al., 2023) |
| 8 | GRASS GIS (Geographic Resources Analysis Support System) | An open-source GIS software that provides powerful tools for spatial modelling, geostatistics and image processing. It is particularly useful for advanced geospatial analysis. | (Neteler et al., 2012; Nguyen & Pearce, 2010; Zambelli et al., 2013) |
| 9 | GDAL (Geospatial Data Abstraction Library) | A library for reading and writing raster and vector geospatial data formats. It provides a set of tools for data transformation and supports various GIS formats. | (Qin et al., 2014; Zhan & Qin, 2012) |
| 10 | PostGIS | A spatial database extension for PostgreSQL, enabling the storage and analysis of geographic data within a relational database management system (RDBMS). | (Lizardo & Davis, 2017; Shukla et al., 2016) |
| 11 | GPS (Global Positioning System) | A satellite-based navigation system that provides real-time location information. GPS technology is widely used for mapping, navigation and geotagging. | (Hegarty, 2017; Hofmann-Wellenhof et al., 2012; Krenn et al., 2011) |
| 12 | ENVI (Environment for Visualising Images) | An RS software used for processing and analysing satellite and aerial imagery. It includes tools for image classification, change detection and spectral analysis. | (Ferrán et al., 2012; Wang et al., 2021) |
| 13 | ERDAS IMAGINE | An RS application for processing, analysing and visualising raster data. It is widely used for image interpretation and geospatial modelling. | (Wondrade et al., 2014; Razafinimaro et al., 2021) |
| 14 | CesiumJS | An open-source JavaScript library for creating 3D globes and maps on the web. CesiumJS is particularly suited for visualising geospatial data in a 3D context. | (Mete et al., 2018; Prandi et al., 2015) |
| 15 | GeoServer | An open-source server software that allows users to share and edit geospatial data. It supports standard geospatial web services and is often used for serving maps over the web. | (Kulawiak et al., 2019; Varol & Şanlioğlu, 2017) |
| 16 | ArcGIS Online | A cloud-based platform by Esri that provides online mapping and analysis tools. It allows users to create and share maps, apps and data. | (Hu et al., 2015; Kholoshyn et al., 2019) |
| 17 | NASA Worldview | An interactive mapping tool that allows users to explore global satellite imagery of Earth. It provides real-time data for monitoring environmental changes. | (Cechini et al., 2018; Plato, 2019) |
| 18 | TerraSAR-X | A satellite mission for radar RS, providing high-resolution radar images for applications such as terrain mapping, agriculture monitoring and disaster management. | (Janoth et al., 2012; Pitz & Miller, 2010) |
| 19 | Microsoft Power BI | While primarily a business analytics tool, Power BI includes geospatial capabilities for mapping and visualising location-based data. It allows users to create interactive maps within their dashboards. | (Becker & Gould, 2019) |
| 20 | Sentinel Hub | A platform for accessing and analysing satellite data, including the Sentinel series from the European Space Agency. It provides easy access to a wide range of Earth observation data for mapping applications. | (Gomes et al., 2020; Potin et al., 2018) |
| 21 | FME (Feature Manipulation Engine) | A data integration platform that supports the extraction, transformation and loading (ETL) of geospatial data. FME is used for data conversion and interoperability. | (Colucci et al., 2020; Jusuf et al., 2017) |
| 22 | ER Mapper | A powerful image processing and GIS software for working with raster data. It provides tools for image compression, mosaicking and visualisation. | (Al-Awadhi, 2010; Sugandi & Somantri, 2018) |
| 23 | GEE (Google Earth Engine) | A cloud-based platform for analysing and visualising satellite imagery and geospatial datasets. It is particularly useful for large-scale Earth observation data analysis. | (Ghosh et al., 2022; Tamiminia et al., 2020) |
| 24 | PostgreSQL with PostGIS Extension | Combining PostgreSQL, a relational database system, with the PostGIS extension enables the storage and manipulation of geospatial data within a database. | (Agarwal & Rajan, 2016; Makris et al., 2021) |
| 25 | Geospatial Python Libraries | Libraries such as GeoPandas, Fiona, and Shapely provide geospatial capabilities in Python. They are used for working with spatial data, performing analyses and creating maps. | (Rajamani & Iyer, 2023; Upton, 2017; Westra, 2015) |
| 26 | Mapillary | A collaborative platform for street-level imagery. Users can contribute geotagged images, and the platform uses computer vision to extract information for mapping and navigation. | (Alvarez Leon & Quinn, 2019; Zheng & Amemiya, 2023) |
| 27 | PRIO-GRID | It is a spatio-temporal grid system designed to facilitate the organisation, administration, and examination of spatial data within a consistent temporal framework. It is comprised of quadratic grid cells that collectively encompass all land areas worldwide. | (Suzuki, 2023; Tollefsen et al., 2012) |
| 28 | GeoDa | A free and open-source software tool that serves as an introduction to spatial data analysis. It provides visualisation and analysis of spatial patterns and relationships. | (Anselin et al., 2022; Mariani & Fauzi, 2017) |
The most popular technologies in South Asia are open-source platforms, such as Google Earth Engine and QGIS, due to their accessibility and affordability. Although sophisticated proprietary software offers strong features, its broader use is restricted by institutional budget constraints and licensing concerns. Thus, the most practical option to incorporate geospatial technologies into CSA in the area is to use open-source tools in conjunction with capacity building and regional data-sharing programmes.
3.5. Web-based data-sharing systems: Enhancing collaboration
VGI emerges as a crucial component, facilitating collaborative approaches in disaster management (Haworth, 2018; Moghadas et al., 2022). Existing and emerging geospatial technologies, including mobile mapping, drones and airborne photogrammetry, play pivotal roles in disaster response (Mitsova, 2019; Tomaszewski et al., 2015; Yu et al., 2018). The significance of web-based data-sharing platforms is emphasised, along with the necessity of governments and organisations taking an active role in creating SDIs for information sharing and emergency preparedness.
3.6. Use of geospatial tools in agriculture
The diverse applications of geospatial tools in agriculture are elucidated, addressing critical aspects such as crop monitoring, precision agriculture, land use change analysis, drought monitoring, forest monitoring, and more (Tables 3 and 4). The intersection of ML, RS and GIS in crop yield prediction exemplifies the multifaceted approach in optimising agricultural practices (Drogkoula et al., 2023; Sun & Scanlon, 2019).
| SN | Geospatial Technology | Reference |
|---|---|---|
| 1 | Mobile mapping | (Puente et al., 2013) |
| 2 | Drone and UAV | (Colomina & Molina, 2014) |
| 3 | Airborne photogrammetry | (Nex & Remondino, 2014) |
| 4 | Geospatial data | (Řezník et al., 2017) |
| 5 | Free and open-source software for geospatial applications (FOSS4G) | (Brovelli et al., 2017) |
| 6 | Airborne and ground-based Laser scanning | (Disney et al., 2019) |
| 7 | Geospatial web services (Google Earth Engine) | (Mananze et al., 2020) |
| 8 | APIs, coding and language | (Embarak, 2018) |
| 9 | Spatial modelling and analysis | (Radmehr et al., 2021) |
| 10 | Big data | (Deibe et al., 2020) |
| 11 | Machine learning (ML) | (Benos et al., 2021) |
| 12 | Artificial intelligence (AI) | (Bauer et al., 2021) |
| SN | Use | Description | Type | Reference |
|---|---|---|---|---|
| 1 | Crop Monitoring | Monitor crop health (NDVI) and growth over a large area, cropping pattern type classification, yield estimation, disease and pest detection. | Sentinel-1 and Sentinel-2 | (Aduvukha et al., 2021) |
| 2 | Precision Agriculture | Provide information about phonotyping, soil health, moisture levels, and crop performance, weeds. | Computer vision and deep learning | (Bauer et al., 2021; Sharma et al., 2023; Thorp & Tian, 2004) |
| 3 | Land Use and Land Cover Change Analysis | Identify the patterns and trends of LULC change over time. | GIS Software, RS | (Hinz et al., 2020) |
| 4 | Drought Monitoring | Monitoring drought so that farmers can make decisions. | RS, GIS Software | (Kulkarni et al., 2020) |
| 5 | Forest Monitoring | Provide information about forest health and ecosystem health. | Satellite Imagery, GIS Software, RS | (Sharma et al., 2022) |
| 6 | Spatial Data Visualisation | Utilising tools like GIS and data visualisation software for the representation of spatial data, enabling better understanding and analysis of geographic patterns. | GIS Software, Data Visualisation Tools | (Kamal et al., 2021) |
| 7 | Urban Planning and Management | Applying geospatial technologies such as GIS, urban modelling tools and satellite imagery for city planning, infrastructure development and efficient urban management. | GIS Software, Urban Modelling Tools, Satellite Imagery | (Iamtrakul et al., 2022) |
| 8 | Disaster Response and Management | Employing geospatial tools such as GIS, satellite imagery and spatial analysis software for assessing and responding to natural disasters, aiding in disaster management and recovery efforts. | GIS Software, Satellite Imagery, Spatial Analysis Software | (Kemper & Kemper, 2020) |
| 9 | Environmental Monitoring | Monitoring and analysing environmental changes using tools such as RS, GIS and environmental sensors to assess the impact of human activities on ecosystems. | RS, GIS Software, Environmental Sensors | (Tsatsaris et al., 2021) |
| 10 | Soil Health Assessment | Applying geospatial tools such as soil sensors and GIS to assess soil health parameters. This includes mapping soil properties, moisture levels and nutrient distribution for precision soil management. | Soil Sensors, GIS Software | (Roberts et al., 2021) |
| 11 | Smart Farming | Integrating Internet of Things (IoT) devices with GIS for smart farming applications. This involves real-time monitoring of farm equipment, weather conditions and crop status to enhance overall farm efficiency. | IoT Devices, GIS Software | (Miloudi et al., 2020) |
| 12 | Crop Yield Prediction | Utilising ML algorithms integrated with GIS and RS data for accurate crop yield prediction. Geospatial technologies enable the analysis of multiple factors influencing crop productivity. | ML, RS, GIS Software | (Abbas et al., 2020) |
| 13 | Pest and Disease Monitoring | Employing geospatial tools such as satellite imagery and GIS for monitoring and predicting pest and disease outbreaks. This aids in timely interventions and targeted application of pesticides. | Satellite Imagery, GIS Software | (Balasundram et al., 2020) |
| 14 | Water Management | Utilising geospatial technologies for efficient water management in agriculture. This involves mapping water resources, monitoring irrigation efficiency and implementing precision irrigation practices. | GIS Software, RS | (Kafy et al., 2021) |
Concrete examples of how geospatial technology is assisting CSA goals can be seen in recent South Asian experiences. The Nepal Agricultural Research Council (NARC) and the Department of Hydrology and Meteorology (DHM) have collaborated to provide agro-advisory services in Nepal that combine crop-specific recommendations for farmers with satellite-based weather forecasts (Chapagain et al., 2023). In Pakistan, precision agriculture initiatives employing RS and GIS have improved irrigation scheduling and crop monitoring, reducing resource use while enhancing yields (Aslam et al., 2018). Similarly, Bhutan is using geospatial platforms more often for climate-informed land-use planning, which aims to balance the conservation of forests and ecosystems with agricultural productivity targets (Parker et al., 2017). These case studies show how geospatial tools are increasingly helping to close the gap between scientific advancements and real-world applications of CSA at the field level.
3.7. Smart farming and beyond
The integration of IoT devices with GIS for smart farming applications signifies a shift towards real-time monitoring and data-driven decision-making in agriculture (Ayaz et al., 2019; Ferehan et al., 2022). Furthermore, the paper recognises the potential of ML and AI in agriculture, highlighting their roles in pest and disease monitoring, renewable energy consumption analysis, and spatial modelling (Balaska et al., 2023; Javaid et al., 2023; Shaikh et al., 2022).
While acknowledging the strides made in geospatial technology applications in CSA, the study emphasises existing gaps in understanding the comprehensive applications in South Asian countries. It underscores the necessity for future research to delve into these gaps, proposing areas for exploration and innovation. We observed the lack of wider use of geospatial techniques in the precision agriculture of South Asia. Furthermore, the study recommends that future research should explore knowledge gaps and propose areas for further exploration in geospatial technology applications for agriculture planning and management.
However, realising these opportunities also depends on overcoming several real-world constraints that influence practical adoption in the region. Effective implementation requires strong interagency coordination among agricultural, environmental and information technology sectors, yet such collaboration often remains fragmented. In addition, low levels of digital literacy among farmers, especially smallholders and marginalised groups, restrict the effective use of digital platforms and geospatial tools. These challenges are further compounded by limited rural internet connectivity and inconsistent access to ICT infrastructure, which constrain the reach of location-based advisory services. Addressing these issues will be essential to ensure that technological innovations are equitably accessible, sustainable, and capable of delivering measurable benefits for farmers and communities.
4. CONCLUSION
Geospatial technologies are increasingly central to advancing CSA in South Asia. Tools like RS, GIS, GNSS and AI/ML techniques provide precise, spatially informed insights that enhance productivity, support climate adaptation and aid mitigation efforts. They enable detailed analysis of climate, soil, land use, agricultural facilities and vulnerability patterns, supporting region-specific CSA strategies.
The integration of RS and GIS allows tailored vulnerability assessments, as shown in Nepal, Pakistan, Bhutan and other regional contexts, improving precision farming, agro-advisory services and climate-informed land-use planning. Adaptive applications remain valuable across diverse areas. With growing connectivity, GIS software, satellite imagery and GPS-based tools are increasingly accessible, while AI-driven approaches like machine learning and deep learning are expanding the analytical potential.
Advocating for SDIs for agriculture, supported by institutional stewardship and frequent data sharing, is vital. Political collaboration and cross-sector partnerships further enhance decision-making. Strengthening institutional capacity, enhancing digital literacy of farmers, fostering cross-sector collaboration and ensuring inclusive access to geospatial innovations will be essential for scaling CSA solutions. Integrating these technologies into agricultural planning and management can build more resilient, productive and sustainable farming systems.
5. ACKNOWLEDGEMENTS
We are grateful to the Asia-Pacific Network for Global Change Research for providing the financial support under Grant No. CBA2020-13MY-Thakuri. We also acknowledge the support received from the ICIMOD FA2 Action Research under the GRAPE and to Mid-West University for their support in implementing this project.