Influence of transboundary air pollution into the atmosphere of Kathmandu Valley
Keywords
AIR POLLUTION · KATHMANDU VALLEY · Nepal · PM2.5 · POTENTIAL SOURCE CONTRIBUTION FUNCTION · TRANSBOUNDARY SOURCES
HIGHLIGHTS
- Aerosol Optical Depth and ground-based PM2.5 showed a similar trend, which indicates that AOD can be used as a proxy for air pollution.
- Potential Source Contribution Function and Concentration Weight Trajectory value signifies higher transport of pollution in pre-monsoon seasons in Kathmandu, which is highly influenced by forest fire events in Nepal.
- High occurrence of stubble burning and forest fire in the entire Indo-Gangetic Plain region could be the major sources of transboundary air pollution.
- Necessity of Nepal-India cooperation to address transboundary pollution, emphasising the role of joint cross-border initiatives in improving air quality in Kathmandu.
1. INTRODUCTION
Air pollution poses a major global threat to sustainable development, with severe consequences for human health, climate stability, and ecosystems worldwide (Singh et al., 2021). The scale of this crisis is alarming. It is responsible for approximately seven million premature deaths annually, and a staggering nine out of ten people breathe unsafe air (Health Effects Institute, 2024). While natural sources such as soil dust and sea salt contribute to the problem, anthropogenic activities are the primary driver of harmful emissions, exacerbating these pre-existing sources (Gul & Das, 2023; Lamarque et al., 2010). This escalating burden has far-reaching implications for the well-being of communities across the globe.
South Asia is known to be recognised as a global air pollution hotspot (Ramachandran & Rupakheti, 2020) in terms of PM2.5, as the region has been revealing the highest rates of pollutant concentration (Shaddick et al., 2020). The Indo-Gangetic Plain (IGP) of South Asia, covering 13.5 million hectares across India, Pakistan, Nepal, and Bangladesh, is a hub for atmospheric pollutants (The Energy and Resources Institute [TERI], 2019). In Bangladesh, central urban areas, including Dhaka, Narayanganj and Gazipur Districts, emerged as high hotspot zones, with PM2.5 concentrations increasing by 47% from 2002–2019 (Hassan & Bhuiyan, 2023). Northeast China exhibits a stable PM2.5 pollution band from southwest to northeast, with hotspots concentrated in Liaoning province, exhibiting a south-hot–north-cool characteristics (Fang et al., 2021). Regional variations in PM2.5 concentrations range from 1–40 µg/m3, with the highest levels in China and India. While emission sources vary by region, agriculture and residential sectors dominate in Europe, whereas power generation and industry are primary contributors in Asia (Crippa et al., 2019). In the Banepa Valley of Nepal, commercial areas demonstrate the highest PM2.5 concentrations compared to industrial and residential zones (Majumder et al., 2012). Comparing trends from 1990 to 2017, Nepal and India showed a rise in mean annual PM2.5 exposure. Between 2018 and 2021, Bangladesh recorded the highest PM2.5 concentrations, followed by Pakistan and India (Jabbar et al., 2022). In 2020, the Environmental Performance Index of Nepal ranked 178th out of 180 countries in global air quality (Wendling et al., 2020). According to the World Air Quality Report 2023, 10 out of the reporting 134 countries and regions succeeded in achieving the World Health Organization [WHO] (2018) annual PM2.5 guideline value of 5 µg/m3 and Kathmandu, Nepal, was ranked as having one of the worst air qualities in the world (IQ Air, 2023).
The sources of emission are diverse and contribute to PM originating from a wide range of upwind sources, extending to hundreds of kilometres towards the receptor region (Hopke, 2016). Such emissions originating from various sources often cross boundaries, posing a complex challenge for governments in their efforts to improve air quality. This phenomenon of transboundary pollution is prevalent in South Asia. The maximum influence of increased dust in South Asia was most likely due to its source being dust storms that occurred in the Sahara, Jordan, and Iran. The air parcels travel thousands of miles from February to March, which is the seasonal occurrence of dust storms in the Middle East (Begum et al., 2011). Moreover, there is evidence of the transport of fine particulate matter pollution from the IGP into areas of higher elevation (Ojha et al., 2020; Tripathee et al., 2021). Agricultural burning in Northern India is a common occurrence during the post-monsoon season and the smoke generated from that incidence has been said to have been transported to Bangladesh along with fine soil blown over from the Middle East during the winter season (Begum et al., 2011). Dhaka’s air quality is significantly impacted by pollutants transported from India, Nepal, and surrounding areas, particularly during the dry season (Dihan et al., 2020).
Since the transport of pollutants in Nepal is episodic, it has been controlled by synoptic and mesoscale dynamics in the region under specific wind conditions (Khanal et al., 2022). The valley, where 3 million people reside, is affected by high air pollution levels exceeding WHO standards by a wide margin (Islam et al., 2020). According to the 2021 WHO Air Quality Guidelines, the recommended annual PM2.5 level is five µg/m3 and the recommended 24-hour level is 15 µg/m3 (WHO, 2022). The mean annual exposure to PM2.5 in Nepal was 88 µg/m3 in 1990 to 99.7 µg/m3 in 2017 due to the economic and industrial growth (Jabbar et al., 2022). Moreover, the daily average variation shows a significant increase in PM2.5 at 371 µg/m3 during the peak forest fire event in 2021 (Khadgi et al., 2024). The forest fires between March and April 2021 had a major impact on the air quality of the Kathmandu Valley.
The increase in ambient pollutant concentrations can be determined through the identification of source type, locations, and contributions by using receptor modelling, which includes a wide range of multivariate analysis methods using ambient air measurements (Watson & Chow, 1991). Remotely sensed satellite data have been extensively used to retrieve Aerosol Optical Depth (AOD) values (Sundström et al., 2015). AOD retrievals have been previously conducted from Moderate Resolution Imaging Spectroradiometer (MODIS) Aqua and Terra, Multi-angle imaging spectroradiometer (MISR) platform, Sea-viewing Wide Field-of-view Sensor, and Multi Angle Implementation of Atmospheric Correction (MAIAC) algorithm (Ali et al., 2017; Boiyo et al., 2018; De Leeuw et al., 2018; Hersey et al., 2015; Tang et al., 2016). AOD retrieved as such is considered the predictor of PM2.5. As it is not possible to have ground-based monitors in each region, satellite AOD has been previously used as a cost-effective proxy for predicting PM2.5 (Hoff & Christopher, 2009).
Despite well-documented evidence of transboundary pollution across South Asia, systematic receptor-based studies and AOD analysis specifically focused on Kathmandu remain limited. This study, therefore, addresses this gap by providing scientific evidence to better understand transboundary influences on Kathmandu’s air quality and to inform the need for effective air pollution management strategies. Moreover, this study examines the seasonal transport dynamics and potential source regions of PM2.5 in Kathmandu, based on daily average measurements from monitoring stations located in Kathmandu and India. A comparison of pollution concentrations in Kathmandu and major cities in India was conducted to identify transboundary patterns and assess the influence of cross-border air pollution on the atmosphere of the Kathmandu Valley. Furthermore, different receptor models, such as
Hybrid Single-Particle Lagrangian Integrated Trajectory (HYSPLIT),
Potential Source Contribution Function (PSCF) and
Concentration Weight Trajectory (CWT)
were employed to gain a comprehensive understanding of the transport behaviour of air pollution into the valley.
2. METHODOLOGY
2.1. Study area
Nepal has a varied topography, ranging from the highest peak at 8,848 m to the lowest point at 60 m. It has been divided into three regions according to its altitude: the Himalaya, the Mid-hill and the Terai. Moreover, Nepal’s climatic conditions vary substantially across its regions. The climate in the south is tropical, whereas the climate in the north is temperate and alpine. Nepal experiences four seasons: Winter (December, January, February); pre-monsoon (March, April, May); monsoon (June, July, August) and post-monsoon (September, October, November) (Adhikari et al., 2020). Furthermore, research in India also indicates similar seasonal patterns (Kumar et al., 2015; Misra et al., 2017).
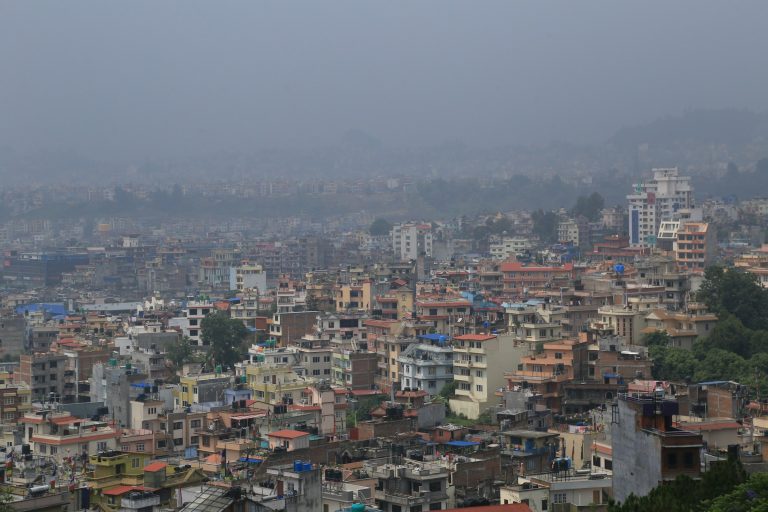
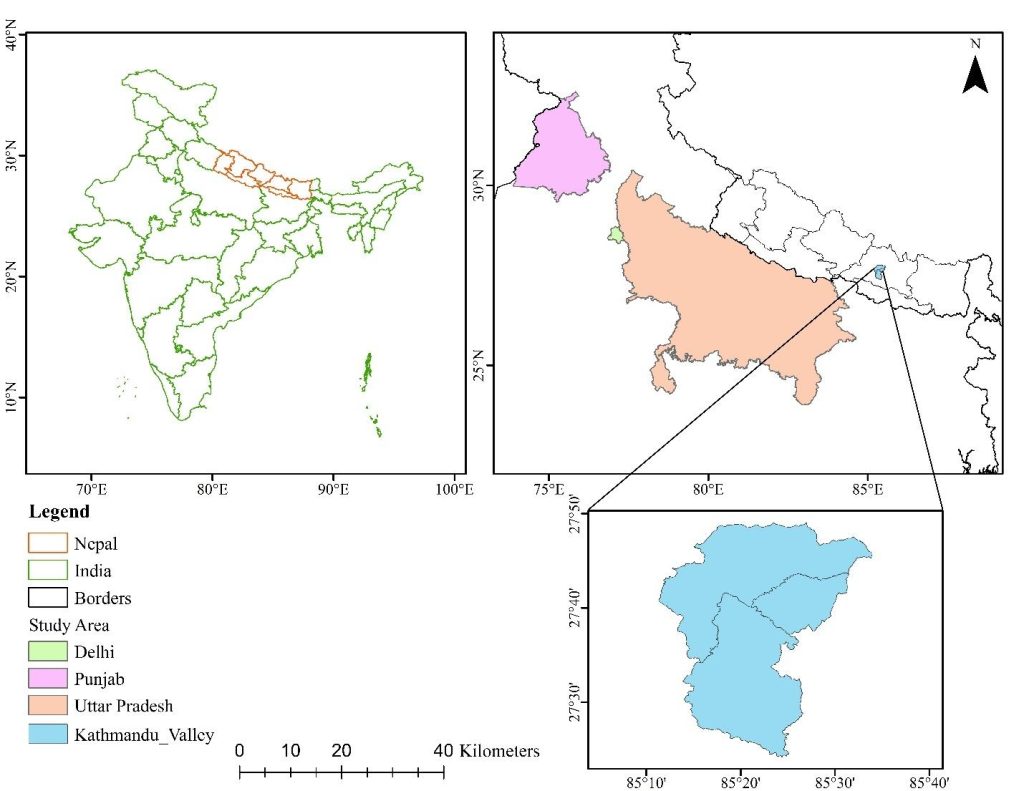
Kathmandu is a bowl-shaped valley situated in the lap of the Himalayas (Figure 1). It lies between 27°38′32″ and 27°45′7″ North latitudes and 85°16′5″ and 85°22′32″ East longitudes with elevations of 1100 m and around 2700 m in the surrounding hills (Regmi et al., 2003). The bowl-shaped structure is responsible for exacerbating air pollution within the city and throughout the valley. Cool valley wind intrusion from neighbouring valleys is also common during the daytime (Regmi et al., 2003). Hindman and Upadhyay (2002) stated that in the morning, an easterly wind in Kathmandu and on the eastern edge indicates that the mountain wind from the nearby Himalayas has reached the centre of the foothills. This wind was lifted vertically by midday convection and then carried into the valley by the strong afternoon valley wind. The cooler air flowing down from the mountains acts like a lid, trapping the hot air along with pollutants (Rives, 2022). It has a cool subtropical climate with average temperatures ranging from around 30 °C during summer to around 2 °C in winter. Southeast monsoon winds cause heavy precipitation during the summer months.
2.2. Ground-based measurements
Daily average PM2.5 data from 2017 to 2020 of Nepal and India have been used in this study. Nepal’s data were extracted from two different monitoring stations located at Phora Durbar and Maharajgunj operated by the United States (US) embassy https://www.airnow.gov/international/us-embassies-and-consulates. The Air Quality Monitoring Stations (AQMs) operating at these sites are Beta Attenuation Mass monitors (BAMs). Hourly data are reported by averaging every 15-minute readings (Edwards et al., 2021). India’s data were taken from the Central Pollution Control Board (CPCB) https://cpcb.nic.in/. The CPCB employs Continuous Ambient Air Quality Monitoring Systems (CAAQMS) across Delhi, Punjab, and Uttar Pradesh to provide real-time data as part of the National Ambient Air Quality Monitoring Programme (NAMP). The data was categorised into three different seasons: Winter, pre-monsoon, and post-monsoon. The 90th percentile for each season was calculated for the receptor model. The monsoon season was excluded in this study because the data for this period showed very low percentile values. The percentile value indicates the relative magnitude or frequency of data points within a dataset and low percentile values during the monsoon reflect that the observed quantities during that period were minimal or not significant compared to other seasons.
2.3. Air mass trajectory
For the period 2017–2020, 5-day backward trajectories were computed using the HYSPLIT model developed by the National Oceanic and Atmospheric Administration (NOAA). Trajectories were generated hourly, arriving in Kathmandu at 18 UTC at an altitude of 500 m above ground level, ensuring they terminated within the Atmospheric Boundary Layer (ABL). A height of 500 m above ground level (AGL) is commonly chosen as the starting height for atmospheric transport studies, as it represents the well-mixed convective boundary layer. This height serves as a practical midpoint that remains representative across varying seasonal and diurnal boundary layer conditions, making it optimal for multi-day trajectory calculations (Xu & Akhtar, 2010). HYSPLIT can be used in two ways: either run directly online to visualise short-term trajectories or download and install on a computer to analyse long-term trajectories through the link: https://www.ready.noaa.gov/HYSPLIT.php. Meteorological field data from the Global Data Assimilation System (GDAS), with a horizontal resolution of 1° × 1 °, were used as input for HYSPLIT, which was downloaded using FileZilla (FTP): https://filezilla-project.org/. The angular cluster analysis was performed on TrajStat, a GIS-based software (Wang et al., 2009), to determine the direction in which the air masses will be transported from the high fire radiative power (FRP) region. However, GDAS data with a 1° horizontal resolution is equivalent to ∼100 km × 100 km, and it should be noted that this resolution is too coarse to accurately represent the micro-scale meteorology of complex terrain, such as Nepal (Sundström et al., 2015).
2.4. Receptor models
Two receptor models have been used to evaluate the potential source areas and transport pathways of pollutants across three seasons. The receptor models are based on the trajectories obtained from the HYSPLIT model and calculated as a function of locations defined by i and j cells in a grid. For this analysis, an Igor-based program called Zefir was employed and computed. Zefir uses HYSPLIT back trajectory files, a widely adopted tool for trajectory analyses. It combines analyses from multiple sites, increasing trajectory density for comprehensive analysis (Biegalski & Hopke, 2004).
2.5. Potential Source Contribution Function
PSCF analyses the trajectory transport paths to determine the potential source areas. The conditional chance that an air parcel travelling through an ijth cell has a high concentration loading at the receptor area is known as the PSCF for that cell.
\[
PSCF_{ij} = \frac{m_{ij}}{n_{ij}}
\tag{1}
\]
Whereas mij represents the total number of trajectory endpoints in the same ijth grid cell for which the measured pollutant concentration is greater than a pollutant’s threshold value, nij represents the total number of trajectory endpoints in the ijth grid cell. The grid value close to 1 indicates a potential source. However, the small nij has an uncertainty in the PSCF value known as the “trailing effect,” hence, an arbitrary weight function (Wij) is multiplied into the PSCF value Equation (1) as:
\[
W_{ij} = \{ 1\,\, 3n_{avg} < n_{ij} \; 0.7\,\, 1.5n_{avg} < n_{ij} \leq 3n_{avg} \; 0.4\,\, n_{avg} < n_{ij} \leq 1.5n_{avg} \; 0.2\,\, n_{ij} \leq n_{avg} \}
\tag{2}
\]
where navg is the average number of endpoints in each grid cell, the weighing function reduces the PSCF value when the total number of endpoints in a specific cell is less than around three times the average value of endpoints per cell. For this study, the results from the 90th percentile of PM2.5 for each season were considered as the criterion value for calculating PSCF.
2.6. Concentration Weight Trajectory
The PSCF model employed has a constraint of computing the same PSCF value with slightly or extremely higher concentrations from the criterion value. This could result in significantly more difficulty in distinguishing moderate sources from strong ones. Hence, the CWT method was used to produce a geographical overview of emission source areas within the study region. The CWT model is applied to each grid cell, which is assigned a weighted concentration obtained by averaging the concentrations associated with trajectories that pass through the grid cell.
\[
C_{ij} = \frac{1}{\sum_{i=1}^{M} \tau_{ijl}} \sum_{i=1}^{M} C_i \tau_{ijl}
\tag{3}
\]
where Cij is the weighted average concentration in the ijth grid cell, Ci is the pollutant concentration associated with the arrival of trajectory l, M is the total number of trajectories, and τijl is the duration of trajectory spent in the ijth grid cell by trajectory.
It assesses the contribution of possible pollution sources to contaminant concentration at a specific study site, using the weighted concentration of the air mass trajectory (Ma et al., 2021). Like the PSCF model, to reduce the effect of the small values of nij, the arbitrary weighting function Equation (2) was also used in the CWT analyses.
2.7. Aerosol Optical Depth
The MAIAC processing algorithm is a MODIS product that integrates observations from Terra and Aqua to retrieve daily AOD at a one km spatial resolution. The MCD19A2 dataset represents the MAIAC algorithm Level-2 gridded (L2G) aerosol optical thickness product for land surfaces. For this study, AOD at 550 nm wavelength was used. To ensure the accurate retrieval of AOD, the QA bit 0000, representing “Best quality”, was retrieved, which corresponds to the best quality image without cloud interference (Lyapustin et al., 2018). The period of retrieved AOD data matched the PM2.5 monitoring period (2017–2020).
Retrieval of the AOD map was done using Google Earth Engine (GEE) (https://developers.google.com/earthengine/datasets/catalog/MODIS_061_MCD19A2_GRANULES). GEE is a cloud-based computing platform that allows for the convenient processing of large datasets with extensive temporal and spatial coverage (Amani et al., 2020). R Studio was used for the comprehensive visualisation. The codes used for AOD data extraction and visualisation are available at: https://github.com/sapboop/MAIAC-AOD-raster-extraction-using-GEE.git
2.8. Fire product
The MODIS Aqua/Terra Collection 6.1 active fire product is available from 11th November 2000 to the present. Forest fire incidents were analysed during this study and the data was retrieved from the Fire Information for Resource Management System (FIRMS) to analyse the location and frequency of the forest fire incidents in Nepal and India. Fire data from the years 2017, 2018, 2019, and 2020 were selected as representative years for this study. Only the pre-monsoon season has been considered for fire occurrence analysis. The detection confidence of the MODIS fire product ranges from 0 to 100%. However, data points with confidence levels above 30% are said to have higher accuracy, as they represent the nominal and high confidence values (Coskuner, 2022; Giglio et al., 2021). Therefore, 30% has been used as the cutoff point in this study.
3. RESULTS AND DISCUSSION
The concentration of pollution has been differentiated into major seasons, namely Winter, pre-monsoon, and post-monsoon seasons, which are based on synoptic winds and the different meteorological conditions prevailing over Kathmandu. The receptor models were also operated seasonally to identify the atmospheric circulation pathways influencing PM2.5 concentrations at the receptor region.
3.1. Variation in PM Concentration across different cities
The yearly variation of PM2.5 in four different cities of Nepal and India from 2017 to 2020 is shown in Table 1. The mean annual PM2.5 concentration in Kathmandu, Nepal, was 44 ± 28 µg/m3 in 2017, 53 ± 33 µg/m3 in 2018, 51 ± 33 µg/m3 in 2019, and 39 ± 32 µg/m3 in 2020. In the case of India, the mean annual concentrations recorded in Uttar Pradesh were 95 ± 66 µg/m3 in 2017, followed by 113 ± 74 µg/m3 in 2018, 103 ± 75 µg/m3 in 2019, and 90 ± 69 µg/m3 in 2020. Delhi was observed to have a mean annual concentration of 109 ± 74 µg/m3 in 2018, 122 ± 97 µg/m3 in 2019, and 108 ± 93 µg/m3 in 2020. The data for the year 2017 was not included as it was not available on the official governmental site. The absence likely reflects that the records for this specific year/area were not published or updated at the time of data collection. Punjab’s mean annual concentration was 68 ± 41 µg/m3 in 2017, 60 ± 38 µg/m3 in 2018, followed by 52 ± 28 µg/m3 in 2019, and 53 ± 29 µg/m3 in 2020. Research by Puri et al. (2022) found that PM2.5 levels in Punjab increased to 171 µg/m3 during the stubble burning period, specifically in October and November, which is considered hazardous to human health.
| Year | Conc ± Std (µg/m3) | |||
|---|---|---|---|---|
| Kathmandu | UP | Delhi | Punjab | |
| 2017 | 44 ± 28 | 95 ± 66 | – | 68 ± 41 |
| 2018 | 53 ± 33 | 113 ± 74 | 109 ± 74 | 60 ± 38 |
| 2019 | 51 ± 33 | 103 ± 75 | 122 ± 97 | 52 ± 28 |
| 2020 | 39 ± 32 | 90 ± 69 | 108 ± 93 | 53 ± 29 |
Among the three states of India, Delhi had higher annual PM2.5 concentrations in 2019 and 2020, as shown in Table 1. Various studies have also estimated that the annual PM2.5 concentrations in the National Capital Territory (NCT) of Delhi exceed India’s annual NAAQS of 40 µg/m3 (which is four times higher than the WHO annual air quality guideline) by more than 200%. The mean annual PM2.5 concentration over Delhi is estimated to be 133 µg/m3 (Chowdhury et al., 2019). Punjab area is found to be quite cleaner in comparison to UP and Delhi region. Kathmandu’s PM2.5 value was the lowest in all examined years.
3.2. Variation in PM Concentration and AOD
The occurrence of pollution from 2017 to 2020 has been illustrated in Figure 2. The figure shows the daily average PM2.5 concentration and AOD for Kathmandu, Delhi, Punjab and Uttar Pradesh. The vertical dotted lines represent the distinction between different seasons of the year, namely, pre-monsoon, monsoon, post-monsoon, and Winter. We can observe a large data gap during the monsoon season in all years due to the better air quality during the monsoon season compared to other seasons (Shakya et al., 2017), likely due to the clearing of pollution due to rain. Across all the locations, there is a significant increase in both PM2.5 and AOD during the post-monsoon and winter periods. It is more significantly visible in Delhi and Uttar Pradesh, where PM2.5 levels are at their peak during these seasons. Vehicular emissions, traffic congestion, waste and biomass burning, industries, road dust, construction and demolition, agricultural waste burning, brick kilns, and household cooking are the major sources of air pollution in Uttar Pradesh (Sharma et al., 2023). Overall, lower concentrations are visible in Punjab compared to the other Indian locations.
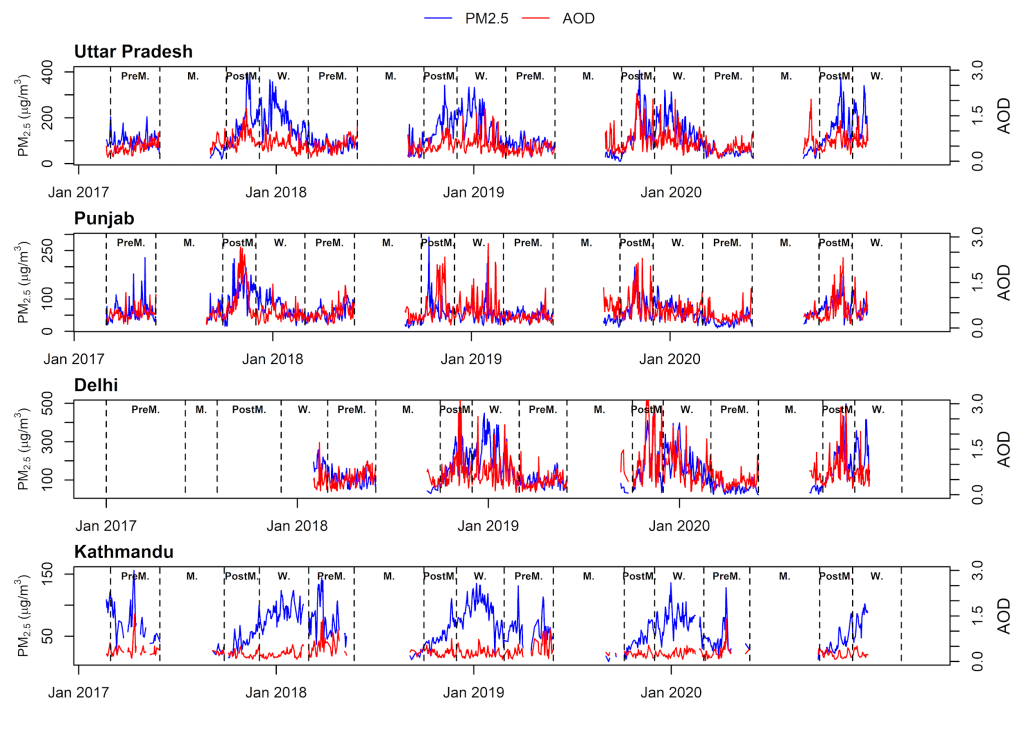
Punjab observed its maximum concentration at 292 µg/m3 in the post-monsoon season. Punjab often suffers from agricultural residue burning every year. The yearly contribution of PM2.5 due to paddy residue burning in the Punjab district of Patiala was calculated to be between 60 and 390 µg/m3 (Babu et al., 2021). On the other hand, Delhi has considerably higher values. Delhi experiences significant seasonal and annual variations with higher PM2.5 concentrations during Winter (Gorai et al., 2018; Tiwari et al., 2012). While the Kathmandu Valley has comparatively lower PM2.5 values compared to its Indian counterparts, the observed pattern is also quite similar, with values being high during the post-monsoon and winter seasons.
During the pre-monsoon season, the rise in average air temperature might be the cause of the valley’s ambient air ventilation due to the upward movement of air (Panday & Prinn, 2009). Some of the other contributing factors to air pollution in Kathmandu include vehicular and industrial emissions, as well as other trapped layers of pollution due to the topography (Shakya et al., 2017). Across all the years considered, despite some fluctuations, the general trend of AOD and PM2.5 is quite consistent throughout the timeline. Since both PM2.5 and AOD indicators rise similarly across all regions, this suggests a relationship between ground-level particulate matter and aerosol concentrations in the atmosphere. Regmi et al. (2023) have calculated the correlation between MODIS AOD at 550 nm and ground-level PM2.5. They found that these two parameters had correlation coefficients of 0.643, 0.653, and 0.288 during the Winter, pre-monsoon and post-monsoon seasons, respectively. These correlations between AOD and PM2.5 suggest that satellite-derived AOD data can be used as a proxy for ground-level particulate pollution monitoring. In general, the study also suggested the inclusion of meteorological parameters, such as relative humidity, for better representation. Similar to the study by Regmi et al. (2023), some discrepancies can be observed in Kathmandu between the values of PM2.5 and AOD in the present study as well. This might be because AOD is influenced by varying meteorological conditions and topography. The bowl-shaped valley experiences a shallow, stable boundary layer, especially during Winter and nighttime, leading to PM2.5 accumulation at an elevated level near the surface due to restricted airflow (Panday et al., 2009; Regmi et al., 2019). Meteorological conditions such as temperature inversions and katabatic winds also aid in the trapping of pollutants near the surface, which columnar AOD may not fully capture (Aryal et al., 2009; He et al., 2021; Regmi et al., 2019). MAIAC AOD has the potential to represent ground-level PM2.5 concentrations more accurately in lower terrains compared to higher terrains (He et al., 2021). Hence, AOD could be a more reliable proxy for PM2.5 in study areas within the IGP region, as it has a comparatively lower overall elevation (Rai et al., 2019). However, there is a requirement for the integration of localised influencing factors for AOD to be used as a proxy for PM2.5 in both regions, to obtain a more robust representation of pollution levels (Dey et al., 2020; Maheshwarkar & Sunder Raman, 2021).
3.3. Receptor models: PSCF and CWT
3.3.1. Winter
As shown in Figure 3, high PSCF values (>0.8) of PM2.5 loading in Winter was distributed in three pathways, which agreed with the air mass trajectories. The potential source areas identified by the CWT model were very similar to those indicated by the PSCF model. Both analyses showed that the regions contributing to PM2.5 concentrations in Kathmandu were distributed toward the east and southwest, with the highest contributions originating from the southern territories. The primary distinction between PSCF and CWT lies in the use of a concentration threshold in PSCF to identify potential PM2.5 source regions (Li et al., 2020). Because PSCF assigns the same value to concentrations that are only slightly above or far above the threshold, it cannot effectively differentiate between moderate and strong source contributions. In contrast, the CWT method overcomes this limitation by assigning a weighted concentration value—calculated as the average concentration of samples associated with trajectories passing through each grid cell—thereby offering a more refined representation of source strength (Li et al., 2020).
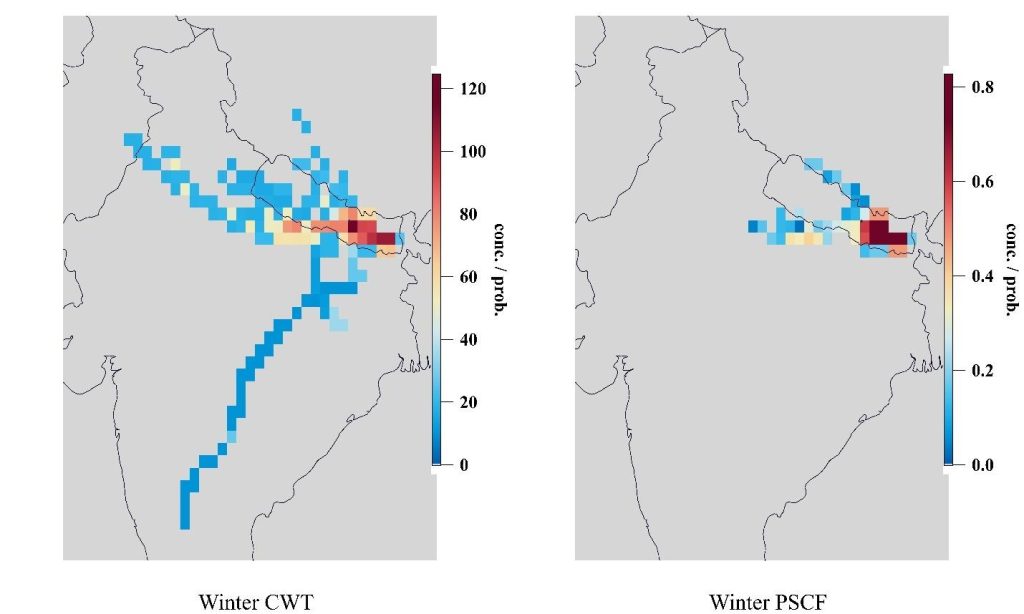
Both PSCF and CWT indicate that the higher potential source area was located on the eastern side, suggesting that the source of PM2.5 in Kathmandu was primarily due to regional transport of air pollution within Nepal. Energy consumption increases with decreasing air temperature, resulting in excessive emissions during winter months (Li et al., 2018). The Winter season carried a higher concentration of pollutants in the valley in 2020, which is consistent with Figure 3. As observed in the figure, long-range transport of pollution originates from the western side, where Uttar Pradesh, Delhi and Punjab are located. There, we can infer that some ranges of pollution entering the valley may originate from these specific places. According to Khanal et al. (2022), air pollution in the Kathmandu Valley was found to be primarily due to agricultural waste burning in Punjab and Haryana, India, during the Winter season, which is consistent with the prediction of this study. Despite Nepal’s limited industrialisation, accelerated industrial growth along the Indian side of the Nepal–India border since the 1990s, together with broader globalisation processes, has resulted in elevated pollution in southern Nepal, especially during the winter season (Bhattarai & Conway, 2020).
3.3.2. Pre-monsoon
During the pre-monsoon season, the PSCF and CWT analyses produced similar overall values, although the spatial distribution of potential source regions showed some differences. As illustrated in Figure 4, high PSCF values (>0.8) in the eastern, south-western, and border areas indicate strong potential source contributions to elevated PM2.5 concentrations in Kathmandu. Both PSCF and CWT results consistently identify the eastern region and nearby local areas as the major contributors to PM2.5 levels.
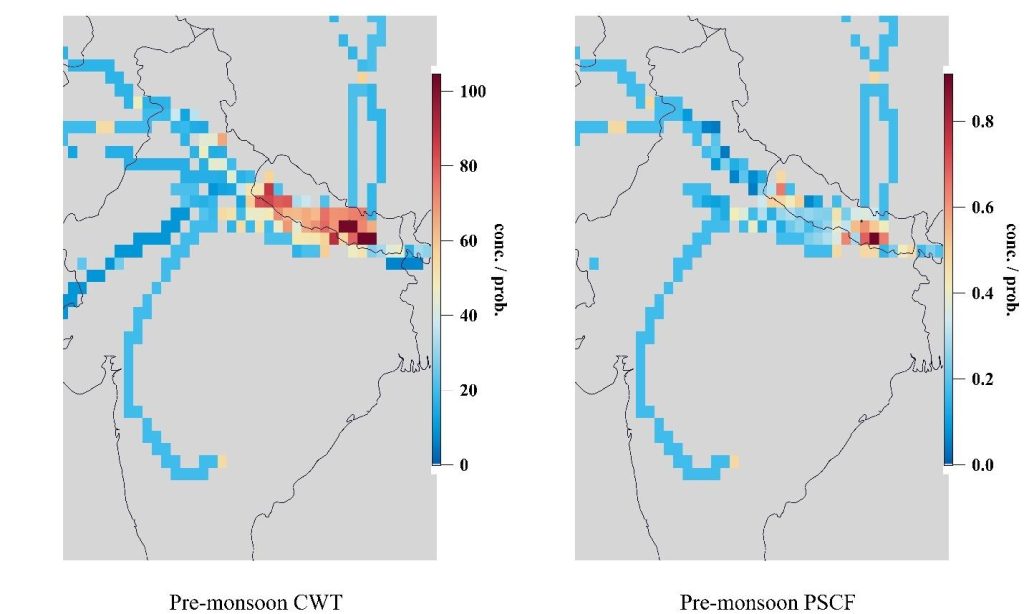
The findings suggest that regional pollution transport within Nepal is the dominant influence, followed by transboundary contributions, which appear to have a relatively smaller impact at the receptor site. However, because long-range transport from northern India is also observed, emissions from certain locations in that region can likewise be considered potential source areas.
Essentially, transboundary pollution often originates from neighbouring states in various ways. Comprehensive research by Kaskaoutis et al. (2014) demonstrated that crop residue burning incidents in northwestern India impact the air quality of adjoining countries. It is estimated that over 50% of PM2.5 in Nepal originates from sources outside the country. Similar trends have been observed across the Hindu Kush Himalayan (HKH) region, as noted by previous studies (Kurokawa et al., 2013). A study by Das et al. (2020) reported that crop residue burning contributes significantly to the rise in air pollution levels in Nepal, accounting for 86% of the total emissions from February to May. Wildfire emissions have significantly increased PM2.5 levels in Kathmandu, with concentrations exceeding 100 µg/m3 during the pre-monsoon season from 2018 to 2022, from both neighbouring and transboundary areas (Bar et al., 2022; Khadgi et al., 2024; Kuikel et al., 2024). These studies show similarities with the patterns observed in Figure 4, where pollutants are transported from neighbouring regions. This underscores the need for effective cooperation among HKH countries to jointly implement measures for mitigating PM2.5 pollution and reducing its impacts.
3.3.3. Post-monsoon
The largest potential source areas of pollutants during the post-monsoon season were located to the south, west, and east of Kathmandu (Figure 5). The PSCF value (>0.8) shows high potential source areas contributing to PM2.5 concentrations in Kathmandu. Based on the observation of Figure 5, the assumption can be made that the areas associated with the south, west and eastern parts are potential source areas contributing to the valley’s pollution. Both PSCF and CWT analyses showed the surrounding areas of Kathmandu as major potential source areas, reflecting local and regional transport of pollution within Nepal. The neighbouring country, India, with its respective cities in its northern part, can also be considered as the source area. On 5th November 2018, 22nd December 2018 and 22nd January 2019, exceptionally high mean PM2.5 concentrations exceeding 500 µg/m3 were recorded in Delhi (Chen et al., 2020; Ghude et al., 2020). Similar high-pollution days were selected for analysing transboundary pollution in Kathmandu during the post-monsoon season.
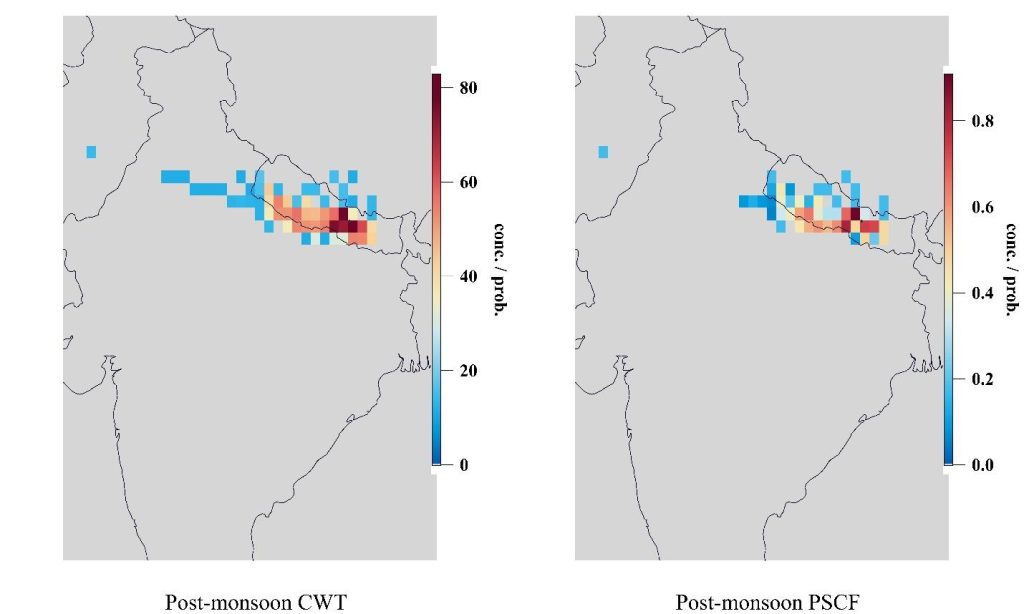
The distribution of strong potential source area for PM2.5 varies somewhat between the three seasons. The potential source regions with higher CWT values generally agreed with the results of the PSCF during all seasons. PSCF and CWT values indicate that pollution transport is higher during the pre-monsoon season (Figure 4) compared to other seasons, with major contributions originating from the western and eastern regions of Nepal, as well as the western and southern areas outside the country.
This highlights the significant impact of long-range and regional transport on air quality in the Kathmandu Valley. A study conducted by Lan et al. (2022) also found that the pre-monsoon and post-monsoon seasons account for 90% of PM2.5 exposure from residue burning, which is primarily contributed by Punjab, Haryana and Uttar Pradesh. This study supports the finding that pollutant levels in the Kathmandu Valley across the three seasons are primarily driven by regional transport within Nepal, followed by transboundary pollution. These pollution episodes within Nepal are largely attributed to agricultural activities, industrial emissions, and biomass burning, as well as contributions from similar sources in neighbouring countries.
3.4. Aerosol Optical Depth (AOD)
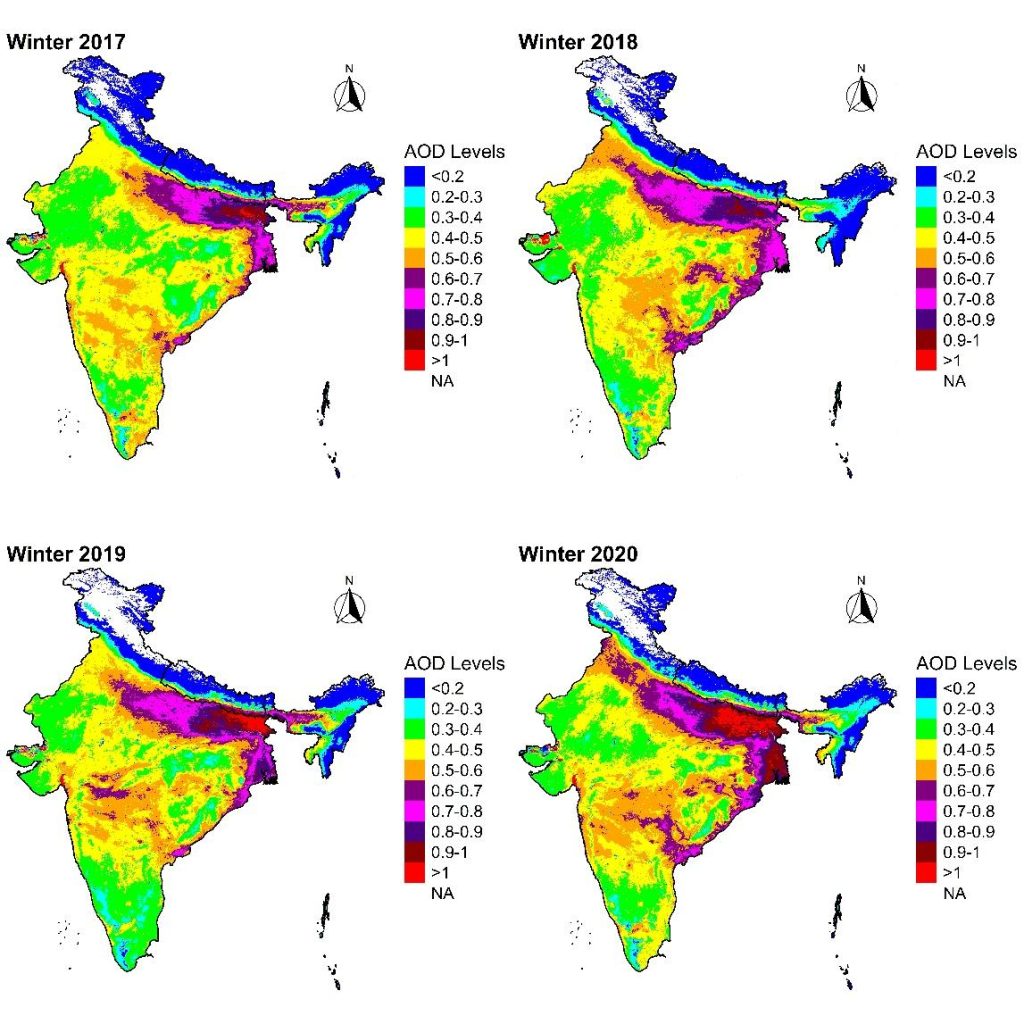
During the winter season, high AOD values were observed in the IGP region, especially in the areas closer to the Nepalese border, with a certain portion of Bihar recording (>0.9) values during 2018 and 2020, as shown in Figure 6. These higher air pollution levels have been linked to increased emissions and a lower Planetary Boundary Layer Height (PBLH) (Badarinath et al., 2009). Winter haze is a common occurrence in Bihar, primarily attributed to the region’s conductive geographical configuration and the widespread practice of open-field straw burning during the winter months. The occurrence of haze contributes to the high aerosol readings in AOD, which indicates the polluted state of the air.
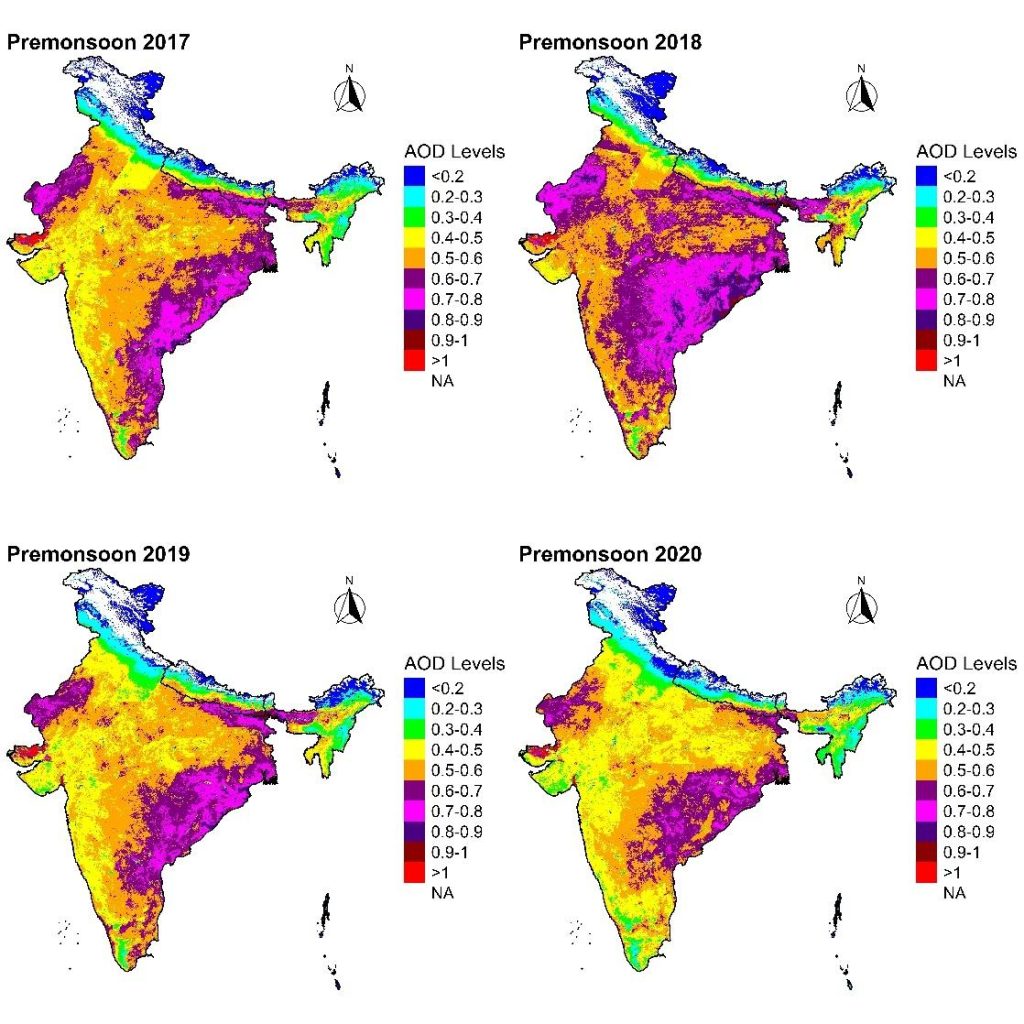
During the pre-monsoon season, AOD was observed to be in the higher range along the southeastern and southern borders of Nepal-India (Figure 7). Higher ranges of AOD might have been because of forest fire occurrences in these areas during the pre-monsoon season. Becker et al. (2021) also reported the highest values of MODIS AOD during the pre-monsoon months of April and May, which align with our results shown in Figure 7. While comparing the pre-monsoon AOD of other years to 2020, we can observe visibly lower AOD values. This could be due to a total lockdown during the COVID-19 pandemic, which has restricted various anthropogenic activities, as also the case in India (Singh & Chauhan, 2020). During the pre-monsoon season of 2020, the PM2.5 concentration in Indian cities was found to be comparatively lower than the concentration during the same period in 2019; Delhi experienced a 28% decrease in concentration. Overall, the IGP region experienced a decrease of approximately 50 to 60% in particulate matter during the COVID-19 lockdown period (Singh et al., 2020).
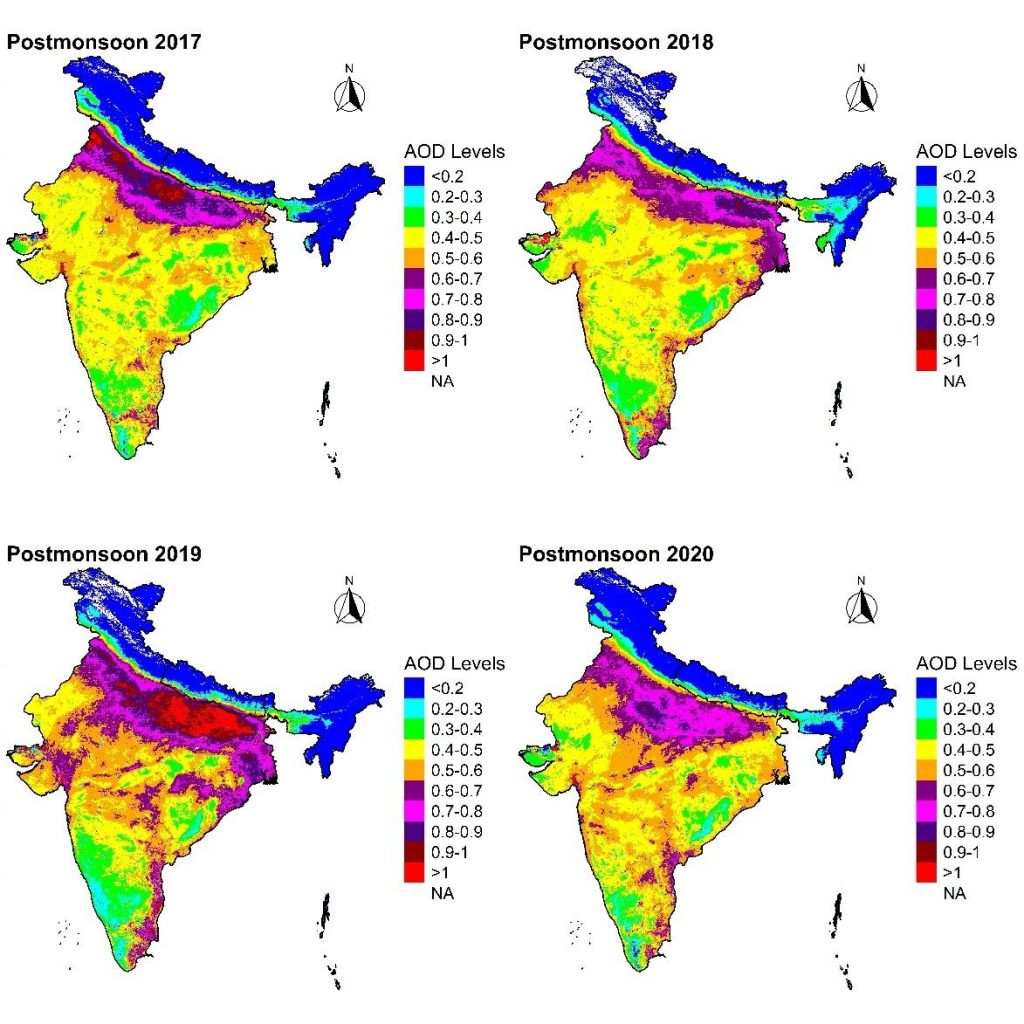
During the post-monsoon season, the IGP region showed the highest AOD values, especially in 2019 (Figure 8). This might have been due to more intense agricultural biomass burning and forest fire activities. Satellite data showed the highest pollution levels in Northern India regardless of the season. This result aligns with current findings in all three seasons (Figures 6 to 8) that have been analysed. Air masses at 500 m from biomass burning in Punjab likely carry dense smoke, creating a high AOD gradient from west to east and interacting closely with the boundary layer, where higher-altitude air masses can transport smoke particles over long distances (Kaskaoutis et al., 2014). Analysis of AOD also revealed a higher aerosol loading in the IGP region (Mahapatra et al., 2019). Although the Himalayan foothills exhibit lower aerosol loading (Mhawish et al., 2021), aerosols can still be transported from nearby air pollution hotspots. Hence, throughout all seasons, high amounts of AOD in the IGP region could be a factor influencing the air quality of the Kathmandu Valley.
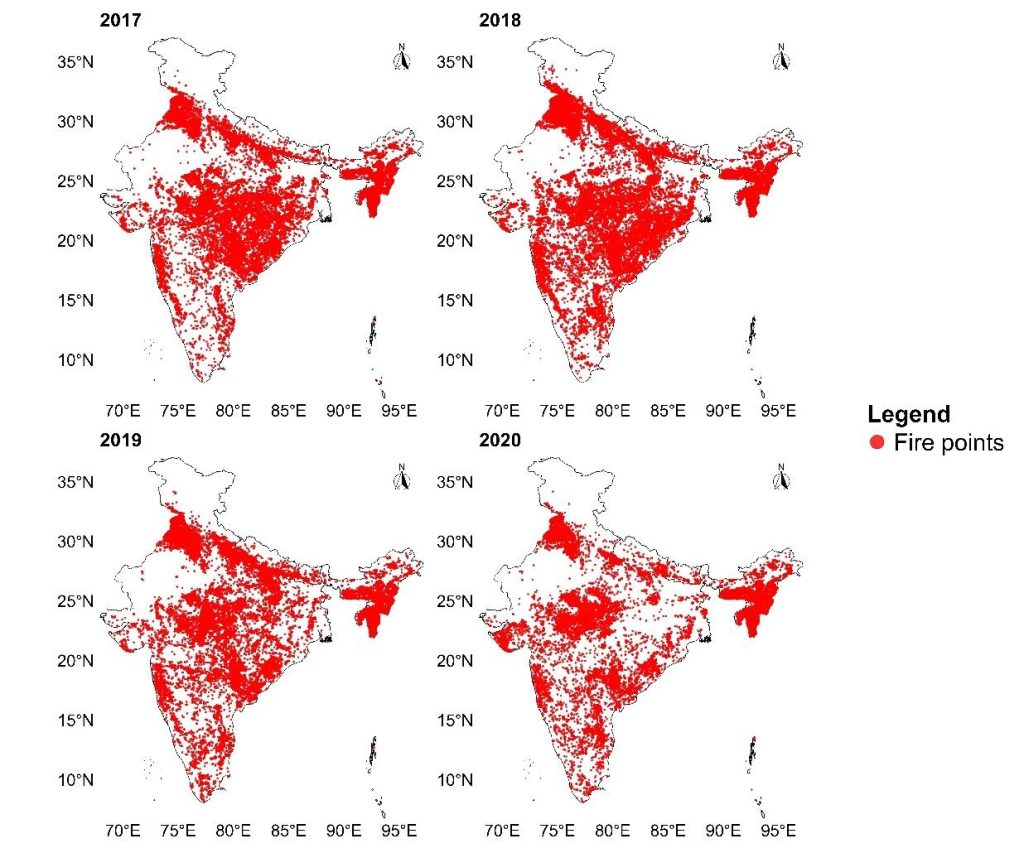
The fire occurrences during the pre-monsoon season in India and Nepal (Figure 9) have been analysed to relate them to their impact on the air quality of the areas. Occurrences of fire events release a large mass of air pollutants into the atmosphere, causing reduced visibility and contributing to exceeding air quality standards in the area (Sahu et al., 2022). In Delhi, fire occurrences include pre-monsoon and post-monsoon outdoor fire activities, such as agricultural burning, particularly in croplands (Liu et al., 2018). This is true not just for Delhi, but for most regions of Northern India. Considering Figure 4, the higher PM2.5 concentrations on the eastern side of Nepal and the long-range transport of pollution from the northern side of India have been observed, which reflects the concentrated PM2.5 in those areas during the pre-monsoon period. Figure 5 illustrates that the highest PM2.5 concentrations occur near the receptor site in Nepal. At the same time, a smaller fraction originates from transboundary transport from India during the post-monsoon season, highlighting the dominant influence of local sources. The rate of transport was observed to be lower in the post-monsoon period than in the pre-monsoon period. We can observe that there are significantly higher occurrences of fire events in areas closer to the southern borders of Nepal and in Uttar Pradesh and Bihar, India. CWT analysis has identified these regions as sources of the aerosols transported to the valley, and these fire events can be attributed as significant contributors during the pre-monsoon season. While this study has used 2020 as the representative year, records indicate that more burning incidents occurred in preceding years, with prevailing winds assisting in spreading smoke plumes over Northern India itself (Singh et al., 2023). Post-harvest agricultural fires contribute to a 43% increase in aerosol loading and a 60% increase in PM2.5 over the IGP and Delhi regions (Jethva et al., 2019). A high correlation between forest fires and degraded air quality in the Kathmandu Valley has also been illustrated in our previous study (Khadgi et al., 2024). During peak pollution days, air plumes arrived from extreme wildfire locations in the Chitwan, Parsa, Banke and Bardiya districts of Nepal, as well as the national parks in the Uttar Pradesh region. As also shown by the study of Khanal et al. (2022), the transport of smoke plumes from various fire activities was analysed using HYSPLIT, tracing air parcels arriving from the Uttar Pradesh and Bihar regions of India, which are major centres of agricultural burning. Hence, the high occurrence of stubble burning and forest fire in the entire IGP region has the potential to influence the air quality of Kathmandu Valley.
4. CONCLUSION
This paper combines an analysis of air pollution with air mass trajectories to distinguish the transboundary air pollution in the Kathmandu Valley. The daily average PM2.5 data from 2017 to 2020 of Nepal and India have been considered. Back trajectory analysis was conducted using the HYSPLIT model. Seasonal differences in the contributions of potential source regions of PM2.5 in the Kathmandu Valley were analysed using a receptor model, which was further related to AOD and fire-burning incidents. The receptor model findings suggest that higher potential sources influencing the generation of incredibly high PM2.5 concentrations were mostly located in the eastern, western and southern parts, including the border areas of Nepal. The results revealed that the pollution impact on Kathmandu Valley was higher during the pre-monsoon and winter seasons, and lower in the post-monsoon season. This may be due to the various meteorological conditions. Through the overall observation, the highest pollution in the valley at a particular time seems to be regional pollution within Nepal, followed by transboundary pollution. It may be due to disturbed activities within countries and neighbouring sites in India. One of the primary reasons for degraded air quality in Kathmandu is the influence of forest fires and agricultural burning that occur within Nepalese boundaries, as well as in Uttar Pradesh, Bihar, Punjab and Haryana. Transboundary air pollution cannot be effectively addressed through individual national efforts alone; it requires international cooperation. This research offers valuable insights into the key areas that require attention for the effective mitigation of air quality degradation, not only within Nepal but also across neighbouring countries, emphasising the importance of coordinated cross-border strategies. Effective solutions are likely to be achieved through stakeholders’ agreement on shared interests and can be guided by adaptive, incentive-based policies.
5. RECOMMENDATIONS
- Advanced receptor modelling techniques, such as PMF, can be further explored in future studies to examine detailed sources, including vehicular emissions, industrial activities and agricultural practices.
- Extend the analysis beyond PM2.5 to include other short-lived climate pollutants, such as black carbon, ozone, and methane, to assess their combined climate impacts.
- Investigate the chemical composition of PM2.5 to determine the relative contribution of harmful components and their potential health risks.
- Explore the socioeconomic drivers of emissions and their relation to policy compliance and mitigation success.
6. Acknowledgement
We would like to thank the Asia-Pacific Network for Global Change Research (reference number CRECS2020-02MY-Khadgi) for funding this project work. We also acknowledge the use of imagery from the NASA LANCE FIRMS (https://earthdata.nasa.gov/firms), part of the NASA Earth Science Data and Information System (ESDIS).