
How livelihood assets influence the multidimensional poverty status of mountainous farmers in Central Vietnam
Keywords
Livelihood assets · Mountainous farmers · Multidimensional poverty · Vietnam
HIGHLIGHTS
- The multidimensional poverty of mountainous farmers in Central Vietnam is high.
- Nine factors belonging to livelihood assets impact farmers’ multidimensional poverty.
- Population policies, land, credit activities, women’s unions’ activities, training programmes and telecommunication services need to be conducted to reduce farmers’ multidimensional poverty.
- Climate vulnerability factors do not significantly impact multidimensional poverty despite high exposure levels.
1. INTRODUCTION
Poverty is now a priority on the global agenda, connecting various governments for sustainable development purposes (United Nations, 2016). While poverty is often defined as income or consumption expenditure, it encompasses a range of manifestations (Wagle, 2002). The multidimensional poverty concept acknowledges individuals’ diverse deprivations on a daily basis, including poor health, lack of education, inadequate living standards, and more (Sen, 1985). It can be adapted to specific contexts. Multidimensional poverty approaches are widely employed in various countries to establish development programme targets and monitor their effectiveness over time (Alkire et al., 2017).
Vietnam has reached international recognition for its commendable achievements in poverty reduction and sustainable economic growth. Based on a threshold of USD 3.2 per day, the national poverty rate has significantly declined from 58% in 1990 to 9.8% in 2016 (ADB, 2019). More recent data shows continued progress, with poverty rates declining to 5.0% in 2020 and further to less than 4% in 2023 based on updated World Bank thresholds (World Bank, 2022, 2024). However, despite these achievements, the persistently high poverty rates among ethnic minorities present significant challenges to Vietnam’s sustainable development. Recent studies have highlighted the ongoing disadvantages that ethnic minority households face in reducing poverty (Tri & Anh, 2022). Ethnic minorities constitute only 15% of Vietnam’s population; they accounted for 47% of poor people in 2012 and 73% in 2016, respectively (Pimhidzai, 2018). According to 2022 multidimensional poverty assessments, ethnic minorities experienced an average poverty rate of 35.5% while the national rate was only 9.35% (United Nations Vietnam, 2024; World Bank, 2022). The ethnic minority population predominantly resides in mountainous, remote, and isolated regions, relying primarily on agriculture as their primary source of livelihood, which often falls short of ensuring sustainable livelihoods (Nguyen & Leisz, 2021). These persistent disparities necessitate innovative approaches that address the structural disadvantages faced by ethnic minority communities (Burau & Nguyen, 2025). It has been crucial to explore innovative approaches to enhance the primary livelihood activities of ethnic minorities, empowering them to extricate themselves from the cycle of poverty.
Numerous studies have acknowledged the significant role of livelihood assets in the context of poverty reduction strategies (Hua et al., 2017; Li et al., 2020). These assets encompass human capital, social capital, physical capital, financial capital, and natural capital. Effectively utilising these resources forms the foundation for farmers to develop appropriate livelihood strategies for their households. Human capital provides individuals with the advantage of engaging in lucrative employment, non-agricultural activities, and various forms of participation, thus facilitating resource acquisition and supporting livelihood completion, ultimately reducing poverty (Dika et al., 2021). Natural capital encompasses a diverse range of elements, including land, forests, biodiversity, wildlife, and rivers. Many researchers have indicated that individuals with more extensive land holdings tend to experience better outcomes than those with smaller holdings (Nanhthavong et al., 2020). Physical assets, such as tools and equipment, play a pivotal role in household production activities. Farmers typically possess a comprehensive range of agricultural machinery, irrigation equipment and sprayers, enhancing production efficiency (Azumah, 2023). Financial capital encompasses various components, including access to credit, savings, and liquid assets (Wang et al., 2021). Bullock et al. (2014) argue that access to financial assets contributes to income growth, thereby improving individuals’ access to healthcare services and facilities, as households can afford medical expenses. Social capital encompasses mutually beneficial norms, networks and trusted relationships, including formal and informal associations, families and voluntary organisations (Tran et al., 2022). Active participation in organisations or groups, as well as establishing networks with relatives and neighbours, can significantly enhance farmers’ access to loans for agricultural investments, leading to improved income (Tran et al., 2022; Wang et al., 2023).
Central Vietnam’s ethnic minorities (Co Tu, Van Kieu, Ta Oi and Gie Trieng) occupy mountainous border districts across Quang Tri, Quang Nam, and Thua Thien Hue provinces. These indigenous communities practice subsistence livelihood systems characterised by rotational agriculture, non-timber forest product extraction, and small-scale animal husbandry within geographically isolated montane environments exhibiting limited transportation infrastructure and market integration (Truong et al., 2017). However, these communities have faced challenges in generating income from forest-based endeavours due to policies such as forest closures and the establishment of protected areas. Moreover, the region faces the impact of climate change and frequent natural disasters, which further exacerbate living and cultivation conditions (Le et al., 2020). As a result, the area has a high poverty rate among farmers. In light of these circumstances, finding the most profitable and sustainable use of livelihood assets becomes the key to reducing poverty among households in this context. The sustainable livelihood approach (SLA), devised by the British Department for International Development (DFID), presents a more comprehensive understanding of the livelihoods of poor households (Ellis, 2000). By scrutinising human livelihood pursuits, we emphasise their livelihood assets to gain a comprehensive understanding of their livelihood outcomes, which, most obviously, accurately and comprehensively reveal their multidimensional poverty status (Wang et al., 2021). In this study, our aims are: (1) to identify the characteristics of livelihood assets of ethnic minorities in the study area; (2) to understand the multidimensional poverty status of households; and (3) to find how households’ livelihood assets influence their multidimensional poverty level.
2. METHODOLOGY
2.1. Theoretical background
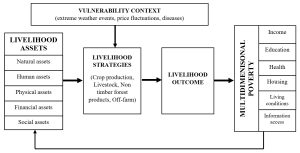
The Sustainable Livelihoods Approach (SLA), introduced by the Department for International Development (DFID), is widely used to examine how livelihood assets contribute to household livelihood strategies to improve overall well-being (Ellis, 2000). According to the SLA, livelihood assets and vulnerable contexts shape different livelihood strategies, which affect households’ outcomes and living standards. In this study, we apply the SLA framework to assess changes in the multidimensional poverty status of households based on different livelihood assets in vulnerable contexts. The primary vulnerability contexts considered in this study include the effects of extreme weather events, price fluctuations, and diseases. Floods, flash floods, droughts, storms, landslides and other extreme weather events seriously threaten farmers’ livelihoods, preventing them from accessing essential social services (Le et al., 2020; Que et al., 2022). Fluctuating market prices challenge rural agricultural production, often leading to farmers losing income (Coxhead et al., 2012). Diseases are considered the primary reason for substantially threatening crop and livestock productivity, diminishing yields and decreasing farmers’ output (Iizumi & Ramankutty, 2015). The livelihood assets of mountainous farmers include natural, social, human, financial, and physical capital. These assets form the basis for farmers to plan their livelihood strategies. In the areas studied, the main livelihood strategies of households include cultivating, raising livestock and collecting non-timber forest products (Truong et al., 2017). The outcomes of these livelihood strategies directly affect household incomes and access to essential social services such as health and education, ultimately reflecting the multidimensional poverty status of households. Figure 1 illustrates the analytical framework that describes the relationships between the studied components, while Table 1 lists the variables used.
| Variables | Measurement | Mean | Relevant literature |
|---|---|---|---|
| Dependent variable | |||
| Multidimensional poverty | Dummy, 0 = no, 1 = yes | 0.61 | (Alkire & Santos, 2014; Vietnam Government, 2015) |
| Independent variables | |||
| Human assets | |||
| Age of household head | Continuous, year | 41.37 | (Kwizera et al., 2023) |
| Education of the household head | Continuous, year | 5.63 | (Li et al., 2020) |
| Household size | Continuous, people | 4.72 | (Diem & Van Hoang, 2018) |
| Labour | Continuous, people | 2.46 | (Li et al., 2020) |
| Physical Assets | |||
| Owning smartphone | Continuous, number | 1.47 | (Sife et al., 2010) |
| Owning television | Continuous, number | 0.51 | (Azumah, 2023) |
| Owning motorbike | Continuous, number | 1.21 | (Azumah, 2023) |
| Farmland | Continuous, Saoa | 15.76 | (Paudel Khatiwada et al., 2017) |
| Forestland | Continuous, Sao | 6.13 | (Li et al., 2020) |
| Financial Assets | |||
| Access to Credit | Dummy, 0 = no, 1 = yes | 0.69 | (Wang et al., 2021) |
| Off-farm income | Continuous, million VNDb | 40.88 | (Duong et al., 2021). |
| Value of debt | Continuous, million VND | 31.94 | (Bullock et al., 2014) |
| Social Assets | |||
| Social spending | Ordinal, 1 = very low, 2 = low, 3 = medium, 4 = high, 5 = very high | 3.48 | (Wang et al., 2023) |
| Member of Youth Union | Dummy, 0 = no, 1 = yes | 0.43 | (Wang et al., 2023) |
| Member of Women’s Union | Dummy, 0 = no, 1 = yes | 0.69 | (Dineen & Le, 2015) |
| Member of Farmers Union | Dummy, 0 = no, 1 = yes | 0.39 | (Tran et al., 2022) |
| Participation Training Programmes | Dummy, 0 = no, 1 = yes | 0.53 | (Wang et al., 2023) |
| Vulnerability context | |||
| Price Fluctuations | Dummy, 0 = no, 1 = yes | 0.74 | (Coxhead et al., 2012) |
| Natural disasters | Dummy, 0 = no, 1 = yes | 0.59 | (Hansen et al., 2019) |
| Disease | Dummy, 0 = no, 1 = yes | 0.21 | (Iizumi & Ramankutty, 2015) |
| a One hectare equals 20 Sao (traditional land measurement unit widely used in Central Vietnam). | |||
| b Vietnamese Dong (VND), exchange rate: 1 USD ≈ 23,000 VND in 2022. | |||
2.2. Study site and data collection
This study was conducted in three Central Vietnam provinces: Quang Tri, Thua Thien Hue, and Quang Nam. These provinces were selected because they have the highest concentration of ethnic minorities, typical mountainous geography with mixed farming systems, and high vulnerability to climate change impacts. A multi-stage sampling method was employed. One district per province was selected based on ethnic minority density, followed by two communes per district and two villages per commune. Households were randomly selected from ethnic minority registers, with 25–30 households surveyed per village, totalling 320 households. Sample size was determined using Yamane’s formula: n = N/(1 + Ne2) (Yamane, 1967), where N = 10,450 (target population) and e = 0.055 (margin of error).
Data collection was conducted from January to April 2023 using a structured questionnaire consisting of two sections. The first section gathered socioeconomic data and information on livelihood assets, while the second section focused on multidimensional poverty indicators. Household heads or their spouses were interviewed, with 57.3% of respondents being male and 42.7% female. The gender composition of households comprised 62.8% male-headed households and 37.2% female-headed households, reflecting the demographic structure of ethnic minority communities in the study area. Additionally, six key informants, including commune agricultural extension officers (3) and ethnic minority community leaders (3) from the three provinces, were interviewed, selected based on their deep knowledge of local livelihood systems and community dynamics.
2.3. Data analysis
Data were analysed using Microsoft Excel version 2016 and SPSS version 25.0. The Alkire-Foster method was applied to calculate the multidimensional poverty level, while the binary logistic regression model was used to determine the influence of livelihood assets on multidimensional poverty. Identifying households experiencing multidimensional poverty involved two main steps. First, deprivation was evaluated across six dimensions at the household level: income, education, healthcare, housing, living conditions, and access to information using 11 indicators (Alkire & Santos, 2014; Vietnam Government, 2015). The income dimension contained one indicator, which contributed 1/3 of the total weight. The other five dimensions collectively contributed 2/3 of the weight, with each dimension having two equally weighted indicators (1/15 each). A household was considered deprived in a dimension if its score fell below the established threshold. The household’s overall deprivation score was calculated by summing the weighted scores across all dimensions. Second, households were classified as multidimensionally poor using the multidimensional poverty cutoff k = 0.33, meaning that households were classified as multidimensionally poor if their weighted deprivation score equalled or exceeded 33% of the maximum possible deprivation across all six dimensions, following the international standard established by Alkire and Santos (2014).
The study employed the Binary Logistic Regression Model to analyse the impact of livelihood assets on multidimensional poverty. The dependent variable in this model is binary, representing whether a household is categorised as poor (assigned a value of 1) or non-poor (assigned a value of 0). The independent variables encompass various aspects of five livelihood assets and vulnerable contexts in the study area that could influence the multidimensional poverty status of households. The model is mathematically defined as follows:
$$
P\left( 0,1 \right)=\beta_{0} + \beta_{1}1X_{1} + \beta_{2}X_{2} + \cdots + \beta_{n}X_{n} + e_{i}
$$
3. RESULTS AND DISCUSSION
3.1. Livelihood assets of highland farmers
Table 1 describes the livelihood assets and vulnerability context characteristics observed among the surveyed farmers. The average age of the farmers interviewed was 41.37 years, and their mean years of schooling totalled 5.63 years, which is substantially below Vietnam’s national average of 9.6 years, as reported by the General Statistics Office (2024). The typical family size for a farmer household was 4.72 individuals, considerably larger than Vietnam’s national average of 3.7 members per household (World Bank, 2022). An average of 2.46 labourers was engaged in agricultural activities. In terms of physical assets, farmers owned an average of 0.51 televisions, 1.47 smartphones, and 1.21 motorbikes per family. Digital connectivity remains challenging in mountainous ethnic minority areas, where technological infrastructure deficits significantly limit internet access and digital inclusion compared to urban and wealthier regions (World Bank, 2022). The mean sizes of farmland and forestland owned by the household heads and members in the study area were 15.76 sao (approximately 0.75 hectares) and 6.13 sao (around 0.27 hectares), respectively. Farmers generated an average income of 40.88 million VND (around 1,778 USD) from off-farm activities. Concurrently, they incurred an average debt of 31.94 million VND (around 1,387 USD) from financial institutions. Notably, 69% of the farmers had access to credit services, while 53% had participated in training programmes to enhance their skills and knowledge. A considerable proportion of farmers were members of community-based organisations. Specifically, 43% were affiliated with the Youth Union, 69% were part of the Women’s Union and 39% belonged to the Farmers’ Union. The high Women’s Union membership reflects Vietnam’s rural development policy, encouraging women’s participation in community organisations. Regarding vulnerability context, a significant portion of farmers had experienced various shocks. Specifically, 74% reported encountering price fluctuations, 59% had faced natural disasters and 21% had dealt with diseases, demonstrating high exposure to various economic and environmental shocks characteristic of mountainous agricultural communities in Central Vietnam.
3.2. Multidimensional poverty status of highland farmers
Table 2 presents a comprehensive range of deprivation facets, each accompanied by its respective indicators and corresponding values. The deprivation rate of monthly income per capita was 56.88% which signifies a substantial proportion of the population experiencing deprivation linked to income. In terms of the education dimension, adult education exhibited a high deprivation rate of 35.31%, highlighting significant adult education disadvantages in mountainous ethnic minority areas, while the rate of children not attending school was only 2.81% consistent with Vietnam’s national primary school attendance rate of 98.7% (General Statistics Office, 2024). For health dimensions, the health services access deprivation rate was 32.19%, showing that substantial gaps remain in healthcare access for ethnic minorities in remote areas, while the health insurance deprivation rate was only 3.44%, consistent with the World Bank’s (2023) report indicating that 93% of Vietnam’s population has national health insurance coverage (World Bank, 2023). The observed rate of housing quality deterioration was 18.44%, while the deprivation rate related to the indicator of insufficient living space for household members was 3.13%. The water resources indicator revealed a rate of limited access to clean water at 53.13%, emphasising challenges in securing adequate clean water sources in the present study area. Similarly, the sanitation indicator denoted a high rate of population lacking proper sanitary facilities at 58.13%. Regarding the information access dimension, 38.75% of households had limited access and utilisation of telecommunications services, while 13.13% lacked the necessary information access assets. This digital divide is pronounced when compared to the national telecommunications access deprivation rate of 21.9% in 2023, while urban areas experience only 15% deprivation (ERIA, 2023), reflecting broader telecommunications challenges in mountainous regions.
| Dimension | Indicator | Number of households | Incidence of deprivation (%) |
|---|---|---|---|
| Income | The average income per capita/month | 182 | 56.88 |
| Education | Adult education | 113 | 35.31 |
| Child School Attendance | 9 | 2.81 | |
| Health | Access to Health Services | 103 | 32.19 |
| Health Insurance | 11 | 3.44 | |
| Housing | Housing quality | 59 | 18.44 |
| Living area | 10 | 3.13 | |
| Water and sanitation | Water sources | 170 | 53.13 |
| Latrine | 186 | 58.13 | |
| Information access | Use of Telecommunications Services | 124 | 38.75 |
| Assets for Information Access | 42 | 13.13 |
3.3. Impact of livelihood assets on the multidimensional poverty of households
The results in Table 3 indicate a good fit of the research model to the data. The value of −2 log-likelihood was 115.400, which shows the high statistical significance of the model. The pseudo-R-square statistics, including Cox and Snell R-square (0.561 greater than 0.3) and Nagelkerke R-square (0.760 greater than 0.5), demonstrate a high level of agreement between the observed variables in the model. The Hosmer–Lemeshow test assesses goodness-of-fit for logistic regression models by comparing observed versus expected frequencies across deciles of predicted probabilities. A significance value > 0.05 indicates an acceptable model fit, suggesting no significant difference between observed and predicted outcomes. The model demonstrated good predictive accuracy, correctly classifying 90.3% of observations. The results revealed significant associations between the multidimensional poverty status of households and various factors representing different asset types. Specifically, the age of the household head and family size (human assets), smartphone ownership (physical assets), ownership of farmland and forest land (natural assets), access to credit and off-farm income (financial assets), membership in the women’s union, and participation in training programmes (social assets) were all found to be significantly associated with the multidimensional poverty status of households.
| Variables | B | S.E. | Sig. | Exp(B) |
|---|---|---|---|---|
| Age of household head | 0.043 | 0.019 | 0.027 | 1.044 |
| Education of the household head | −0.005 | 0.062 | 0.940 | 0.995 |
| Household size | 1.516 | 0.254 | 0.000 | 4.552 |
| Labour | 0.241 | 0.268 | 0.367 | 1.273 |
| Owning smartphone | −0.643 | 0.262 | 0.014 | 0.526 |
| Owning television | −0.089 | 0.446 | 0.842 | 0.915 |
| Owning motorbike | −0.061 | 0.389 | 0.875 | 0.940 |
| Farmland | −0.119 | 0.026 | 0.000 | 0.887 |
| Forestland | −0.058 | 0.022 | 0.009 | 0.944 |
| Access to credit | 1.250 | 0.558 | 0.025 | 3.490 |
| Off-farm income | −0.091 | 0.011 | 0.000 | 0.913 |
| Value of debt | −0.008 | 0.006 | 0.158 | 0.992 |
| Social spending | −0.359 | 0.320 | 0.263 | 0.699 |
| Member of Youth Union | −0.064 | 0.453 | 0.888 | 0.938 |
| Member of Women’s Union | 1.439 | 0.523 | 0.006 | 4.216 |
| Member of Farmers Union | −0.354 | 0.461 | 0.443 | 0.702 |
| Participation Training Programmes | −1.538 | 0.457 | 0.001 | 0.215 |
| Price fluctuations | 0.531 | 0.574 | 0.355 | 1.701 |
| Natural disasters | 0.048 | 0.449 | 0.915 | 1.049 |
| Disease | −0.234 | 0.551 | 0.671 | 0.791 |
| Constant | −1.774 | 1.652 | 0.283 | 0.170 |
| Note: B = unstandardised regression coefficient; S.E. = standard error of coefficient; Sig. = statistical significance level (p-value); Exp(B) = odds ratio (exponential of B coefficient). | ||||
Our findings indicated that households with larger family sizes and older household heads are more likely to experience poverty. Each additional year in the age of the household head was associated with a 4.4% increase in the probability of the household falling into multidimensional poverty. These results suggest that households with older household heads face a higher risk of being deprived of educational opportunities and access to information, leading to greater poverty. Vu and Nguyen (2021) and Dika et al. (2021) demonstrate that older households tend to be more impoverished than younger households, which is consistent with this study. We also found that an increase in household members corresponds to 4.552 times higher odds of multidimensional poverty. The fact shows that a larger household size implies a greater likelihood of income deprivation per capita, a significant contributor to multidimensional poverty. Our result is consistent with the analysis of Vu and Nguyen (2021) but inconsistent with the results of Diem and Van Hoang (2018), who found that family size has a negative influence on the poverty rate.
The present investigation emphasises the importance of smartphone ownership as a critical physical asset for households. A higher number of smartphones per household was associated with a lower likelihood of experiencing multidimensional poverty. This finding aligns with the research of Sife et al. (2010), who demonstrate that mobile phones improve rural livelihoods and reduce poverty by increasing their ability to access livelihood assets, undertake diverse livelihood strategies and overcome their vulnerabilities. Regarding natural assets, we found that ownership of farmland and forest land demonstrated a negative association with the multidimensional poverty status of households, indicating that households with more land (farmland and forest land) were less likely to experience multidimensional poverty. Increasing land ownership by one unit (e.g., Sao) in farmland and forest land reduced the probability of falling into multidimensional poverty by 15.6% and 9.6%, respectively. This relationship can be explained by the fact that a significant portion of household income is derived from agricultural activities such as rice, cassava, corn, fruit trees and acacia, which largely depend on the household’s land. This finding is consistent with the research of Nanhthavong et al. (2020), which shows that in remote areas or poorer villages in Laos, applying livelihood strategies that do not rely on farmland resources causes farmers to lose more farmland and is strongly associated with increasing poverty rates. The role of land ownership as a critical livelihood asset in poverty reduction is supported by previous researchers such as Paudel Khatiwada et al. (2017) and Hua et al. (2017).
Regarding financial assets, our findings show that easier access to credit resources was associated with a higher likelihood of households falling into multidimensional poverty. This can be explained by the fact that most households lack effective financial management skills in the study areas, so when they have convenient access to credit, they may accumulate more debt, exacerbating poverty. The previous research by Banerjee and Jackson (2016) found that microfinance increased indebtedness among impoverished communities and exacerbated economic, social and environmental vulnerabilities, which is consistent with this study. The present study found that off-farm income resources were positively associated with reducing multidimensional poverty (coefficient β = −0.091, p < 0.001), which is consistent with previous research (Duong et al., 2021). Specifically, each additional million VND in off-farm income reduces the odds of multidimensional poverty by 8.7% (Exp(B) = 0.913), highlighting the importance of livelihood diversification strategies. Interestingly, in this study, we found that although women’s unions are widely recognised as community-based organisations in rural Vietnam for their contribution to poverty reduction (Dineen & Le, 2015), our study did not find a significant association between membership in women’s unions and multidimensional poverty reduction. That explains that in most mountainous areas, women’s union activities primarily focus on raising awareness in social sectors rather than building livelihood models to enhance income for members. The results of the study suggest a need to reconsider the role of women’s unions in the area, focusing on supporting members in improving their livelihood activities first. We also found a positive and significant association between the variable of participating in training programmes and the multidimensional poverty status of households. This finding suggests that the current training courses equip farmers with essential knowledge and skills that contribute to improving agricultural production activities and reducing multidimensional poverty. This finding aligns with the research of Paudel Khatiwada et al. (2017), who emphasise the positive impact of training programmes on poverty reduction.
Notably, although most farmers faced a lot of extreme weather (storms, floods, landslides), price fluctuation of agricultural products and diseases in crops and animals, our study does not find a significant association between these vulnerability factors and the multidimensional poverty status of households, which indicated by previous studies (Coxhead et al., 2012; Hansen et al., 2019). The statistically non-significant impact of climate vulnerabilities on multidimensional poverty status, despite high exposure levels (74% experiencing price fluctuations, 59% facing natural disasters), can be explained by several mechanisms developed by ethnic minority communities in the study area. These communities have evolved sophisticated indigenous coping strategies passed down through generations, including diversified cropping calendars, traditional weather forecasting systems, as well as effective early warning systems and rapid disaster relief programmes that help buffer immediate income shocks from government interventions. Additionally, livelihood diversification with multiple income sources from agriculture, forest products, livestock and off-farm activities helps reduce dependence on climate-sensitive activities. These findings suggest that while vulnerability factors create short-term income volatility, they may not translate into chronic multidimensional poverty due to effective community-level resilience mechanisms.
4. CONCLUSION
The multidimensional poverty rate of mountainous farmers in Central Vietnam was high and highly associated with deprivation in income, sanitation facilities, access to clean water, information accessibility, adult education and healthcare services. All five forms of livelihood assets influence the multidimensional poverty status of households. Human assets contribute to multidimensional poverty, particularly in relation to the age of the household head and household size. Possessing telephones constitutes a noteworthy aspect of physical assets that correlates with multidimensional poverty. Owning more natural assets, including farmland and forestland, plays a significant role in poverty alleviation for households. Off-farm income sources serve as financial assets crucial in combating multidimensional poverty. Participating in training programmes is a critical social asset in reducing multidimensional poverty for households. These findings emphasise the need to analyse livelihood assets before giving any livelihood strategies to reduce multidimensional poverty targeting mountainous households. Based on these results, specific policy implications include: First, there should be a suitable approach regarding population and health policies, including birth rate reduction, vocational training for adults and fortified healthcare programmes for older people. The government should prioritise mobile health clinics and telemedicine services to overcome geographical barriers in mountainous areas. Second, focus on implementing land allocation and forest allocation policies, accompanied by planning suitable crops and livestock based on the socioeconomic characteristics of the mountainous ethnic groups. Accelerate red book certificate issuance and establish community-based forest management schemes that integrate traditional knowledge with sustainable practices. Third, facilitate access to telecommunications services and promote proficient smartphone usage while developing information channels to facilitate easy access to technological advancements and market information. Provide targeted smartphone subsidies for poor households and create multilingual digital platforms for market and agricultural information. Fourth, vocational training programmes should be developed for suitable off-farm occupations. Establish commune-level training centres focusing on eco-tourism, handicrafts and food processing with startup capital support for graduates. Fifth, local credit activities require efficient management to assist farmers in accessing secure and favourable credit channels while effectively enhancing their capacity to utilise loan capital for productive investments. Implement microfinance institutions with simplified lending procedures and government-backed guarantee schemes for ethnic minority entrepreneurs. Finally, promote the role of community organisations, especially women’s unions, in establishing appropriate livelihood models and linking them with stakeholders to ensure sustainable livelihoods for their members.
5. ACKNOWLEDGEMENTS
This article is based on work supported by the Asia-Pacific Network for Global Change Research (APN) under Grant No. CBA2022-05SY-Nguyen. The author(s) also acknowledge the support/partial support of Hue University under the Core Research Programme, Grant No. NCTB.DHH.2025.03.