Fronts converging microplastics in the Asia-Pacific river plumes
HIGHLIGHTS
- Ratios of microplastic abundance in fronts to non-frontal regions could reach up to over 500.
- The highly variant ratios reflect the dynamic nature of plume fronts.
- Inconsistent approaches across studies prevent reliable comparisons.
1. INTRODUCTION
Plastic is among the fastest-growing materials, with current production reaching about 450 million metric tons annually (Geyer et al., 2020). This production is projected to double, surpassing one billion tons per year by 2050 (Thompson, 2022). The linear plastic production and disposal system exhibits structural flaws characterised by excessive production of single-use plastics, limited emphasis on recycling, and a disposal-focused approach lacking long-term sustainability. As a result, an annual estimate of 5.6 million to 25.4 million tons of mismanaged plastic waste enters the global ocean (Kaandorp et al., 2023). This influx poses uncertain threats to ocean ecosystems, potentially undermining their integrity and resilience to future changes (MacLeod et al., 2021).
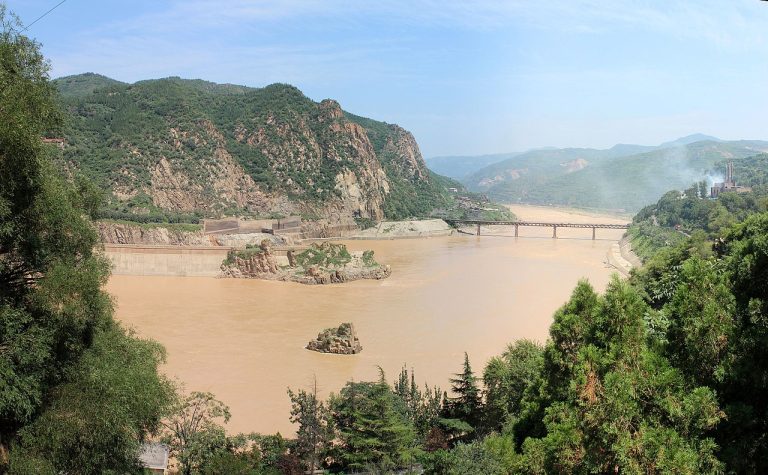
Rivers play a crucial role in transporting land-derived material (for example, ∼91% of the global mismanaged plastic waste (Lebreton & Andrady, 2019) to estuaries and the coastal ocean, where surface convergent fronts are formed at sharp density transitions between interacting water masses (O’Donnell, 1993). These fronts are specialised features of the estuarine regime in which strong convergence leads to the accumulation of buoyant material, surface-active components, and swimming organisms (Corlett & Geyer, 2020; Simpson & Turrell, 1986), as well as pollutants [such as oil (D’Asaro et al., 2018; Klemas & Polis, 1975)].
Whether and how estuarine fronts are important to the distribution, transport and fate of plastic waste remains largely unclear. Only three studies have monitored plastic waste concentrations in estuarine fronts (Atwood et al., 2019; Payton et al., 2020; Pazos et al., 2018) (Table 1). In studies conducted in the Po River, Italy, and Río de la Plata River, Argentina, both Payton et al. (2020) and Pazos et al. (2018) reported elevated plastic abundances in estuarine fronts based on observations at one station in each research. Payton et al. (2020) specifically collected particles between 43 and 104 µm in the Cooper River estuarine fronts, USA, and found significantly higher abundances of microplastics compared to those in non-frontal zones. A recent study has underscored the significance of estuarine fronts in converging, transporting and transforming plastic waste, offering insights into the fate of plastics along the land-ocean aquatic continuum (Wang et al., 2022). However, systematic observations regarding how estuarine fronts influence the distribution of plastic waste in the Asia-Pacific region have been limited, despite the rivers in this area being identified as the world’s largest contributor of mismanaged plastic marine waste (Meijer et al., 2021).
In this study, we conducted measurements of floating microplastics (<5 mm) levels, hereafter referred to as ‘plastics’, in both the fronts and non-frontal zones of the Terengganu River (Malaysia) and the Yellow River (China) plumes using specifically designed observational methods (refer to Figure 1). The plume front is a typical kind of estuarine front. Our measurements unequivocally demonstrate a significant concentration of microplastic particles in the frontal zones of these two Asia-Pacific estuaries (Figure 2). Additionally, we compare the methodologies employed for studying plastics and microplastics in estuarine fronts and propose suggestions for enhancing the reliability of datasets on microplastic observations in estuarine fronts.
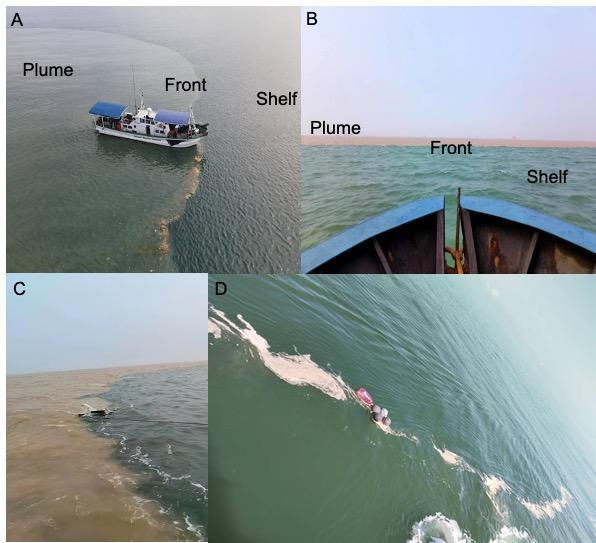
2. METHODOLOGY
Microplastics floating in estuarine waters were collected from both the Terengganu River (Malaysia) in May and August 2022 and the Yellow River (China) in August 2022. Prior to plastic collection, the occurrence of fronts in both estuaries was identified through water-colour images by flying drones and the Landsat Satellite (Paramasivan et al., and Chen et al., under review). Once fronts were located, the block sampling design was employed to collect samples from three regions (Morgan et al., 2005): the low-salinity plume, along the surface front at the leading edge of the plume, and in the adjacent more saline coastal marine water (Figure 1; hereafter referred to as plume, front and shelf, respectively). Briefly, a manta net (refer to Table 1 for the mesh size used) was first towed along the front edge for 15–20 min at a speed lower than 2 knots in the Terengganu River (Malaysia) and the Yellow River (China). Then, the plume and shelf stations in the same block were sampled. These plume and shelf stations were selected by steaming perpendicularly away from the front until no large changes in surface salinity were observed. In addition, 500 L of seawater was also sampled with a clean metal bucket at each station in the Terengganu River (Malaysia) and then filtered on a 20-µm mesh. The collected samples were then stored in a freezer at 4 °C for further laboratory analysis. In the Yellow River, thirteen net tows were conducted at fronts and ten at the shelf/plume; in the Terengganu River, four net tows were conducted at fronts and eight at the shelf/plume.
| Study region | Sampling tool | Particle size (µm) | Plastic confirmation | Ratio | Reference |
|---|---|---|---|---|---|
| Atlantic Ocean | Neuston net | >300 | Microscope | 68 | Brach et al. (2018) |
| Pacific Ocean | Neuston net | >335 | Microscope | 267 | Law et al. (2014) |
| Pacific Ocean | Neuston net | >335 | Microscope | 131 | Gove et al. (2019) |
| Timor Sea | Manta net | >500 | µFTIR | 32 | Hajbane et al. (2021) |
| Po River | Manta net | >300 | µFTIR | 1 | Atwood et al. (2019) |
| Mediterranean Sea | Manta net | >333 | Microscope | 5 | Collignon and Stacey (2012) |
| Cooper River | Bucket | 43–104 | Melting test | 3 | Payton et al. (2020) |
| Río de la Plata River | Bucket | >36 | Microscope | 1.6 | Pazos et al. (2018) |
| Terengganu River | Manta net, Bucket | >20 & >350 | µFTIR | 0.8 to 4.1 | Our study |
| Yellow River | Manta net | >335 | µFTIR | 0.12 to 508.5 | Our study |
| Note: ‘Ratio’ represents the ratios of plastic abundance in front to that in plume/shelf waters. | |||||
In the laboratory, large plastics were picked out, and small plastics in the remaining samples were separated through the density suspension with saturated sodium chloride and purified with 5% potassium hydroxide and 30% hydrogen peroxide (Amin et al., 2020; Zhao et al., 2017). Plastics were confirmed with micro-Fourier Transform Infrared (µ-FTIR) spectroscopy (Nicolet iN10, Thermo Fisher, USA). Half of the microplastic particles were analysed with µ-FTIR. Samples with confidence values > 60% were considered plastic materials. In this study, only plastic abundances are reported in particles per cubic metre (particles m−3). Plastic abundances in the Terengganu River represent the combined values from bulk and manta net samples. Other information on plastics and exact sampling stations will be reported in Paramasivan et al. (2025) and Xu et al. (2025).
3. RESULTS AND DISCUSSION
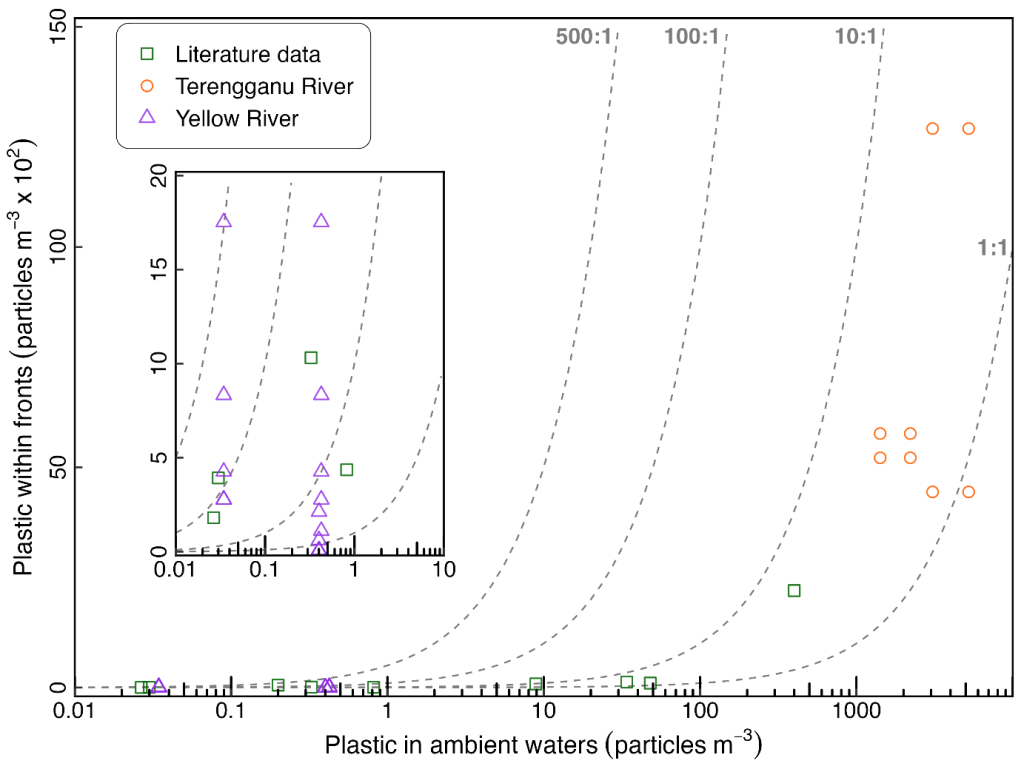
Our results show that the ratios (n = 23) of microplastic abundances in fronts to those in plume/shelf waters—referred to hereafter as ‘plastic ratios’— range from 0.12 to 508.5 in the Yellow River (n = 15) and 0.8 to 4.1 (n = 8) in the Terengganu River. Plastic ratios greater than 1 indicate potential plastic convergence at fronts. Overall, 19 of 23 plastic ratios are greater than 1, with 9 of these ratios being larger than 10. The majority of observational stations in fronts presenting higher values of plastic abundances compared to those in plume/shelf waters clearly confirms the aggregation of plastic waste at estuarine fronts (Figure 2). This finding aligns with conclusions presented in the literature, which was based on a limited observation dataset. For instance, two stations at the plume front within the Río de la Plata River in Argentina (Pazos et al., 2018) and one station at the plume front within the Po River in Italy (Atwood et al., 2019) have reported similar trends. In the Yellow River plume region, plastic abundances (>335 µm) range from 0.03 particles m−3 in shelf water to 17.5 particles m−3 in the fronts. Plastic abundances (>20 µm) in the Terengganu River Estuary range between 1.4 × 10³ to 12.7 × 10³ particles m−3. In approximately 40% of samples from frontal zones, microplastic abundances are at least one order of magnitude higher than in adjacent plume or shelf waters of the Terengganu and Yellow River estuaries, as indicated by the abundance ratios between frontal and non-frontal zones (Figure 2). This result indicates that there are likely stronger converging effects on plastics in the two Asia-Pacific estuarine fronts compared to previous observations in other estuaries (refer to Table 1). It is well documented that a wide range of neuston and plankton, such as phytoplankton, planktonic copepods, fish eggs, larval fishes and insects, are enriched at fronts (Wang et al., 2022). The co-occurrence of elevated microplastics and organisms at fronts can enhance the accessibility of smaller microplastics to biological tissues, accelerate additive leaching rates, and consequently expose different trophic organisms in frontal habitats to the threats of microplastics. The variations in physical characteristics among these plume fronts may partially explain this difference. As tidal plume fronts propagate, their characteristics evolve and remain dynamic (Wang et al., 2021). This includes variations in structures of horizontal/vertical velocity and density fields, which ultimately determine the horizontal convergence rate (O’Donnell, 1990; O’Donnell et al., 1998). Wang et al. (2022) summarised that horizontal convergence rates (s−1) at fronts of global river plumes range from 10−3 to 10−1. Even within the same river estuary, variations in measured horizontal convergence rates at the plume fronts of the Connecticut River plume differ by up to one order of magnitude (0.05 to 0.1 s−1) (O’Donnell et al., 1998). This variability is also reflected in the large disparities (over five orders of magnitude) in our calculated ratios of plastics in plume fronts to non-frontal waters in the Yellow River Estuary (Table 1). Moreover, the coefficient of variation (183%) for these ratios is substantially higher in the Yellow River compared to the Terengganu River (44.5%). This metric, calculated as the ratio of the standard deviation to the mean of plastic abundances, reflects greater variability in plastic convergence at fronts in the Yellow River. The wide range of converging effects of plume fronts on plastic waste suggests that advancements in understanding plumes require a more detailed appreciation of the physical properties at fronts. This understanding is essential to improving our predictive capabilities regarding the redistribution and fate of plastics.
Furthermore, inconsistent methodologies utilised in studies of plastics in frontal zones exist, as commonly identified in the field of microplastic research. In the summarised Table 1, two different sampling methods have been employed. The method of net trawl has been extensively used to collect floating plastics in aquatic environments (Eriksen et al., 2023; Nava et al., 2023) and has been proposed as a golden method (Pasquier et al., 2022). However, nets with different mesh sizes (∼300 µm and 500 µm) have been used. It is well-known that the concentration of plastic fragments increases as their sizes decrease. A study found that microplastic abundance collected with a 333-µm net is four times greater than that collected with a 500-µm net when these two nets were towed in parallel (Lindeque et al., 2020). Bulk water samples for plastics in fronts were also collected, which have been documented to be suitable for small microplastics and can collect over three orders of magnitude more particles than sampling with a neuston net in the estuary (Zhao et al., 2019). Our results in the Terengganu River Estuary are in line with this finding, indicating a significant underestimation of smaller plastics based solely on traditional net sampling due to mesh size limitations. In addition to sampling methods, various techniques, utilised for the identification of microplastics, such as spectroscopic and thermo-chemical, and visual inspection methods, could also bias the measurements (Table 1). The lack of validation of the chemical matrix of plastic-like particles could result in a high misidentification rate, ranging from 20% to 70% (Hidalgo-Ruz et al., 2012). The identification error rate increases with decreasing particle size. Currently, research on plastics and microplastics in plume fronts is still in its early stages, making the employment of consistent methods crucial for a comprehensive understanding of the role of fronts in the transport, fate and risk assessment of plastic waste (Wang et al., 2022). Recommendations for realistic observation of plastic pollution in fronts include: (1) Using a tow net with a mesh size of ∼300 µm to account for floating plastic debris; (2) Employing bulk water samples to capture small microplastics; and (3) Utilising chemical (Py-GC-MS) or spectroscopic (e.g., FTIR, Raman, and hyperspectral imaging) methods to confirm plastic polymers accurately.
4. CONCLUSION
In conclusion, our observations in the Terengganu River (Malaysia) and the Yellow River (China) undoubtedly identify the converging effect of plume fronts on microplastics. However, the wide variation in these ratios of microplastic abundances within and outside frontal zones reflects the dynamic characteristics of plume fronts, underscoring the importance of high-resolution measurements of front physical characteristics to precisely define their convergent role in plastic waste. We also highlight inconsistent methodologies across studies and propose realistic suggestions for implementing a comparable observation strategy.
5. ACKNOWLEDGEMENT
This study was supported by the Asia-Pacific Network for Global Change Research (CRRP2021-08MY-Zhao), the National Natural Science Fund of China (NO. 42076006) to TW, and the International Partnership Research Grant sponsored by Universiti Malaysia Terengganu (UMT/IPRG/22-55379).