Climate change impacts on spatiotemporal variation of extreme weather and its consequences on dam optimisation and risk management in the Cagayan basin, Philippines
Keywords
Dam optimisation · Drought risk · Flood risk · Rainwater-runoff inundation · Spatio-temporal climate impacts · Typhoon
1. INTRODUCTION
The most critical impacts are affecting water resources, especially the dam operation and effective river basin management. These directly affect agricultural systems, food, and livelihood security. Moreover, the Cagayan River Basin (CRB) in the Philippines is the central basin, covering a total land area of 27,493.49 km2, presently facing critical issues of rapid climate variability, sedimentation, and frequent occurrences of typhoons, floods, and droughts. These are the significant constraints that somehow prevent further development in CRB. Therefore, dams and reservoirs are essential to the sustainability of human civilisation because they collect and store water for irrigation and drinking, generate energy, and reduce flood and drought risks. Dams are still a crucial part of development today as a result of the world’s rising energy and water demands, as well as their ability to secure the water environment and mitigate damage caused by climate change and variability. Therefore, safe dam operation (i.e. optimised dam operation) is always crucial and has equal importance as being able to control food, which is a short-term or almost near-real-time goal (i.e. when to store or when to release the floodwaters) and in contrast to restoring the appropriate amount of water for irrigation, drinking, and several other purposes which is a medium-to-seasonal-to-annual goal to save water for various purposes such as drinking, irrigation, industries, and hydroelectric power, etc. during the dry season/period. This is because sometimes the amount of precipitation received during the normal or El Niño year is insufficient to fill the dam, and water is needed to replenish the dams. Also, considerable rainfall is lost as surface runoff (42.85%), with only a small portion recharging the groundwater aquifer (10.65%). The geologic property of the watershed governs low groundwater recharge. Conversely, the Cagayan River’s stream flow is approximately 55.04% of the annual rainfall (UPLB, n.d.). About 30% of the river basin is highly susceptible to drought. In comparison, only 14% of the river basin is susceptible to flood, covering most of the part from Isabela and Cagayan, and is one of the perennial problems existing in the CRB emphasised in the report of “climate-Responsive Integrated Master Plan for Cagayan River Basin”. Also, the Philippine Atmospheric, Geophysical and Astronomical Services Administration (PAGASA) reported that the temperature is expected to increase from 0.8–1.1 °C in 2020 and 1.6–2.2 °C in 2050, which will cause the CRB to have drier summer months and a wetter rainy season. This will add extra pressure and difficulties in appropriate strategies for water resource management. By looking into climate change, the situation may worsen in the upcoming period over CRB, which is predicted to increase the magnitude and frequencies of such hazardous weather events (PAGASA, 2023; WBG & ADB, 2021). Understanding knowledge regarding identifying specific risks and their possibility will be more critical for managing climate-related risks (Weaver et al., 2017). Therefore, to be prepared and counter these changes, there is a strong need for an integrated approach to studying climate change, combining aspects of climate projections and predicting future potential impacts to understand the spatiotemporal changes of extreme weather events and their consequences on surface water resource management. Hence, this study has been undertaken with the following objectives:
- Accessing the impact of climate change on the perception of occurrences of extreme weather events such as floods and drought at the CRB.
- Conducting the exposure survey to validate the extreme weather analysis results, understanding the awareness and critical problems risk communication, and
- Investigating the hydrological response under different dam release scenarios using the case of extreme Typhoon Ulysses on the Magat dam at the CRB.
These results would be an easy-to-use resource to tackle the extreme weather situation and guide the national and local disaster risk reduction and management offices in developing an appropriate decision for implementing adaptation strategies over high-risk zones.
2. METHODOLOGY
2.1. Study area mapping and datasets
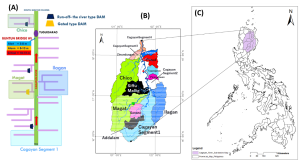
Figure 1 shows the location map of the CRB with a total catchment area of 27,281 km2 and a river length of 520 km. The Cagayan River flows from the Caraballo Mountains in the south to the north-northeast through the mountains, joining the Magat River on the left bank and the Ilagan River on the right bank. The main tributaries of the Cagayan River are the Chico River, with a catchment area of 4,550 km2. The Siffu-Mallig River with a catchment area of 2,015 km2, the Magat River with a catchment area of 5,110 km2 from the left bank, the Pared River with a catchment area of 970 km2, the Tuguegarao River with a catchment area of 660 km2, the Tumauini River with a catchment area of 960 km2, and the Ilagan River with a catchment of 3,130 km2 joins from the right bank side (Alejandro, 2021). According to the report “Climate-Responsive Integrated Master Plan for Cagayan River Basin” by UPLB (n.d.); “Floods created by this river flow down very slowly due to surface retention across a large flood plain, a very gradual slope, and flood retardation by multiple gorges and river meanders, and the location from Tuguegarao to Aparrib should target for flood forecasting and warning system”. The river basin has around 70 completed dams, two ongoing dams, and 63 proposed dams. These dams are divided into three types: diversion dams, water impounding systems, and small water impounding systems. The Magat Dam is the river basin’s largest dam (UPLB, n.d.). It is also reported that the flood extent in the future (2050) period will likely be the same as the flood extent of current climatic conditions, and extreme weather situations like typhoons can bring torrential rains and cause disastrous floods. Hence, optimised dam operation is crucial in such a situation for effective pre-release to control the flood and maintain the appropriate storage to secure water during prolonged dry periods.
This study used long-term and high-spatial-resolution climate change projection data (MRI-AGCM3.2S) to comprehensively assess extreme rainfall and temperature indices for the spatiotemporal assessment of the probability of flood and drought events under the worst-case (RCP8.5) climate change scenarios. The dataset used in this study was developed by Mizuta et al. (2012) from the Meteorological Research Institute (MRI) based on the simulations from the Atmospheric General Circulation Model (AGCM) with a horizontal grid size of about 20 km. A detailed description of this dataset can be found in the DIAS data catalogue at http://metadata.diasjp.net/dmm/doc/CMIP6_MRI_AGCM3_2_S_HighResMIP-ja.html. Also, this study used other geospatial datasets such as Digital Elevation Model (DEM), Rainfall, and other hydrological datasets, including reservoir inflow discharge, dam outflow, river discharge, dam operation rules, and power generation obtained from MERIT Hydro: global hydrography datasets, PAGASA, and NIA MARIIS (Yamazaki et al., 2019).
2.2. Estimation of extreme weather events and associated disaster risk for dam operation
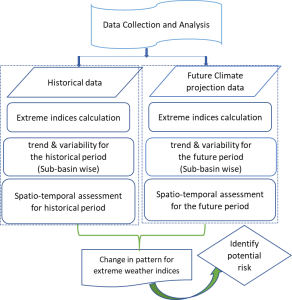
The approach of spatiotemporal assessment by Sen’s slope with Mann Kendall’s test was applied to analyse the variability and magnitude of change in climate variables and key extreme climate indices, using the daily meteorological variables obtained from high-resolution CMIP6 simulation data produced by MRI-AGCM3.2S over historical (1951–2014) and future (2015–2099) period (Figure 2).
This study estimated the extreme climate indices CDD, CWD, r95p, Tx90p, and Tn90p, considering the most important and relevant for water resource protection from climate change risk (Table 1).
| Precipitation Indices | Temperature Indices | ||||
|---|---|---|---|---|---|
| Indices | Definition | Unit | Indices | Definition | Unit |
| PRCPTOT | Total amount of annual precipitation | mm/yr | Tx | Mean daily max. temperature | °C |
| CDD | Consecutive dry days: Number of Spell of five consecutive days with rainfall < 1 mm per year | days | Tn | Mean daily min. temperature | °C |
| CWD | Consecutive wet days: Number of Spell of five consecutive wet per year with rainfall > 1 mm | days | Tx90p | Amount of the hot days: The percentage of days when Tx > 90th percentile | % |
| r95p | Very wet days rainfall: Annual total rainfall when daily rainfall exceeds the 95th percentile of wet days | mm/yr | Tn90p | Amount of warm nights: The percentage of days when Tn > 90th percentile | % |
The relative changes over each sub-basin and different periods were estimated to investigate the impacts of climate change on various extreme weather events such as consecutive wet days leading to flooding, heavy precipitation events, dry days leading to drought, number of hot days, and tropical nights. Along with this, we also studied other natural and technological disasters, as well as cyclone tracks, to better understand their occurrences and the implications for dam operation and overall climate risk management. The climate analysis supports dam operations and emphasises multiple aspects of management, such as releasing water during heavy rainfall events to control floods and storing the required amount of water during extended long dry periods for appropriate water use management for various purposes such as drinking, industries, irrigation, and energy production. Therefore, we estimate and simulate dam operation using the case of extreme Typhoon Ulysses, and the optimised dam operation rules have been estimated under different dam release scenarios and associated reservoir sedimentation impacts.
2.3. Estimation of dam optimisation using Rainfall Runoff Inundation (RRI) model
The RRI model can easily simulate the effect of a dam reservoir. Hence, this study has used the RRI model for hydrological simulation and optimisation of dam operation rules. As recommended by Alejandro (2021), the parameters of the dam model were settled for the maximum reservoir volume; flood control starts to release the total discharge and discharge rate for the Magat-dam, e.g., when the inflow is less than the flood control start discharge, the outflow is equal to the inflow, and when the inflow exceeds the flood control begins to discharge, the outflow = inflow × discharge rate. The dam is designed to release the same amount as the inflow when the water storage volume reaches the maximum storage volume (Figure 3).
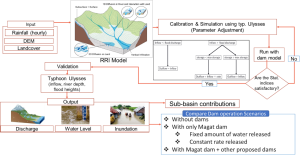
Then, the dam operation is simulated using four different scenarios: (1) without a dam, (2) with only a Magat dam but a fixed amount of water released, (3) with only a Magat dam but a constant rate released, and (4) with a Magat dam supported by an additional proposed dam, and the results were compared for water level changes at Buntun bridge (Iwamoto, Nohara, Takemon, Koshiba, & Sumi, 2021; Sayama, Myo, Fukami, Tanaka, & Takeuchi, 2011). In this way, several scenarios have been conducted, including an evaluation of each sub-contribution catchment’s and dam operations during the typhoon and an examination of additional proposed dams in the other sub-catchment. Then, the best feasible potential flood risk mitigation strategies have been evaluated.
3. RESULTS AND DISCUSSION
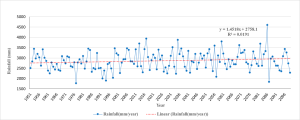
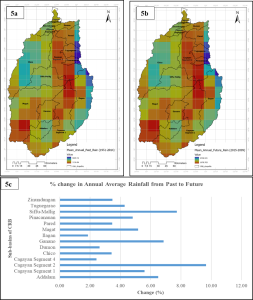
The relative changes for different periods and over each sub-basin were estimated and illustrated to investigate the variability and magnitude of change in rainfall and key relevant extreme climate indices over historical and future climate change. Temporally, the intra-annual rainfall has shown an increasing trend over the future, with a higher fluctuation rate in minimum and maximum annual rainfall (Figure 4). Overall, not many significant changes were observed for future annual rainfall changes. However, the amount of annual average rainfall varies across each sub-basin, with a significant difference observed between sub-basins even though they are close to each other (Figure 5). This will cause drought occurrences where precipitation has shown a decreasing trend over the sub-basins Ilagan, Dumon, Pared, Cagayan Segment 4, etc. in the future. On the other hand, floods will likely occur where precipitation has shown an increasing trend over sub-basins like Siffu-Mallig, Ganano, Addalam and Cagayan Segment 2, etc., in the future over the CRB (Figure 5c). Hence, this study has analysed extreme weather situations such as the spell for consecutive dry days (dryness), consecutive wet days (wetness), and the number of hot days (warmness) as the most relevant factors in consideration of appropriate management of surface water resources such as dam and reservoir operations.
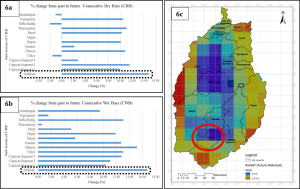
Interestingly, the findings also revealed that the sub-basin like Addalam would experience an increase in the percentage of consecutive dry days (CDD) as well as an increase in the percentage of consecutive wet days (CWD) in the future compared to the past (Figure 6a, and Figure 6b). This indicates the risk of intense dry spells and heavy precipitation events, which may cause severe drought and flooding the upstream and downstream of the Addalam sub-basin, respectively (Figure 6c).
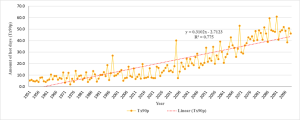
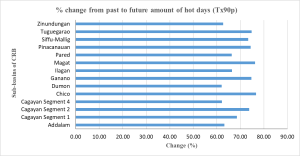
Furthermore, in terms of the impacts of temperature, the results have shown a significant increasing trend for the annual amount of hot days (Tx90p) continuously from past to the future (Figure 7). In contrast, the spatially, all sub-basins showed an increased amount of hot days in the future throughout the CRB (Figure 8). This indicates the probability of increasing warming over CRB in the future, which will likely cause an increase in evaporation. This will also affect the overall hydrological response of each sub-basin across the Cagayan River.
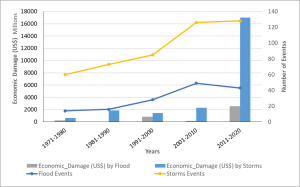
Understanding knowledge about the identification and probability of occurrences of such extreme weather events is always critical for addressing climate-related risks and managing surface water resources appropriately. Furthermore, more extreme weather events can be expected as the world continues to warm. Hence, as a result, this study used other freely available reputable national disaster databases to analyse the effects of other disasters in the Philippines and their consequences for the Cagayan River basin. The global international catastrophe (EM-DAT) database was used to construct the outlook of water-related disasters in the Philippines. Floods and storms are the top natural disasters in the Philippines in terms of occurrences, people affected, and overall socioeconomic damages (CRED, 2022). The frequency of occurrence events for storms and floods increased in the recent decade (2011–2020) compared to the past four decades 1971–2020. The graph (Figure 9) visualises how sharply it has increased in the recent period and caused considerable economic damage in the Philippines.
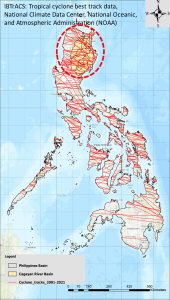
Also, the time series tropical cyclone tracks (NOAA’s International Best Track Archive for Climate Stewardship (IBTrACS)) data were used to construct a statistical outlook and to provide some context of the spatial distribution of impacts of typhoons across the Philippines (Knapp, Kruk, Levinson, Diamond, & Neumann, 2010). Figure 10 highlights the frequency and impacts of typhoon events over the Philippines during the past two decades, 2001–2021. It was observed that the overall cyclone frequency has increased over the northern Philippines, especially over the Cagayan River Basin, during the past two decadal periods, compared to the other parts of the country.
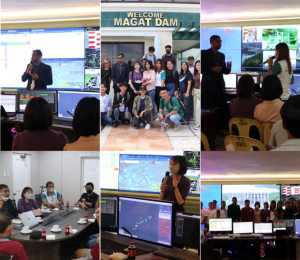
Furthermore, this study conducted an exposure field survey to validate our extreme weather analysis results and to understand the impacts and critical problems through a comprehensive community survey and institutional stakeholder interviews (Figures 11 and 12). It has been confirmed that the areas surrounding the Addalam sub-basin and Magat basin experienced frequent water shortages during the dry season and frequent floods during the wet season, respectively. This is because increased dryness (i.e. increased CDD) increases the risk for drought, whereas the increased amount of hot days (i.e. Tx90p) has increased the evaporation and added the risk for increased spells of heavy precipitation.

We visited several potential sites, institutes and households to learn about the key issues and the level of community risk awareness. The respondents indicated that they receive warnings and are fully aware of the situation when a typhoon occurs. However, the critical problem and key issues during such extreme weather situations revolve around whether to preemptively release water from the reservoir to control flooding or retain an adequate amount of water to address the risk of replenishing capacity during dry periods. Therefore, this study utilised the recent event (i.e. Typhoon Ulysses) as an example to simulate dam (i.e. Magat-Dam) operations under different water management scenarios (such as with only Magat dams, without dams, with Magat dam + other proposed additional dam, etc.) to better optimise the dam operation to mitigate the problem of flood and drought risk and address the dilemma between releasing water during extreme weather/heavy rainfall events to control floods and storing the required amount of water to ensure water availability during extended long dry periods (i.e. how to operate the dam during synergies between two extreme weather (flood and drought) situations). Because the Magat dam is one of the major multi-purpose dams along the Cagayan River Basin that should be operated in order to control reservoir releases to ensure water availability for irrigation on a year-round basis, especially during January to May, which are normally dry months, and effective release of impounded water during the flood seasons due to occurrences of typhoons and/or heavy rains, such as the case of Typhoon Ulysses. Hence, this study investigated the hydrological response and compared each sub-basin runoff to quantify the tributary sub-basin contribution under the assumption of constant rainfall across the entire basin. It was discovered that each sub-basin had different hydrological responses and subsequently contributed to the runoff during the typhoon. The Cagayan Segment 1 sub-basin contributed higher runoff than other sub-basins under dam and without-dam scenarios. Therefore, a new scenario of proposing an additional dam for flood control was compared with other baseline scenarios, which can help reduce flood risk in downstream areas and restore water to reduce the risk of water availability during the dry season. This helped evaluate the best feasible mitigation strategy for the CRB.
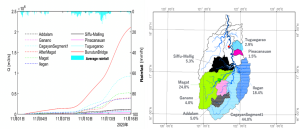
The actual rainfall data was used in the RRI model to reproduce the inflow discharges. Figure 13 shows that the contributions of Cagayan Segment 1 to the downstream are 44% compared with the other tributaries and sub-basins. Furthermore, the same hydrological inputs were simulated for a new scenario where the Magat dam was included. It was found that the contributions of Cagayan Segment 1 are higher compared to Magat River with and without dam scenarios. Therefore, we can use the constant discharge and rate discharge models to simulate the dam pre-release scenarios, as shown in Table 2. In the case that there is no sedimentation in Magat dam and they could pre-release to reduce the dam’s water level from 188.64 m to 180 m, the operation that does not store water total is only constant discharge of 1000 m3/s, and this operation can reduce water level at Buntun bridge from 13.3 m to 12.1 m. If there is sedimentation in Magat dam and they cannot pre-release more, the best operation is the starting discharge for flood at 700 m3/s and a discharge rate of 0.5. This operation can reduce the water level at Buntun bridge to 12.8 m (Table 2).
| Scenarios | Start Flood control discharge [m3/s] | Discharge rate | Water level at Buntun bridge [m] |
|---|---|---|---|
| No dam | – | – | 13.3 |
| Magat dam: Sedimentation, no pre-release | 700 | 0.5 | 12.8 |
| Magat dam: No sedimentation, pre-release | 1000 | 0 | 12.1 |
| Magat + CS1 + Ilagan | Magat: 700 | Magat: 0.5 | 12.4 |
| CS1: 500 | CS1: 0 | ||
| Ilagan 1: 300 | Ilagan1: 0 | ||
| Ilagan 2: 100 | Ilagan2: 0 |
Finally, new scenarios were compared with the baseline scenarios such that a proposed additional dam for flood control will be constructed in Cagayan Segment 1 and Ilagan sub-basins. We selected the location referred from JICA’s master plan, and our study result showed that Cagayan Segment 1 and Ilagan had high outflow (DPWH & JICA, 2002). The storages of the new dams are about 400 million m3. Therefore, if they can use the dam at Typhoon Ulysses and Magat dam’s operation, the starting discharge for flood is 700 m3/s, and the discharge rate is 0.5, they could reduce the Buntun bridge’s water level to 12.4 m (Table 2). The results of this study would probably be an easy-to-use resource to tackle extreme weather situations and guide the disaster risk and management offices in establishing an appropriate decision for implementing adaptation strategies over high-risk zones.
4. CONCLUSION AND FUTURE RECOMMENDATION
A consistent increase in temperature and precipitation is expected to result in prolonged dry and wet spells in some sub-basins, such as Addalam. Prolonged dry and wet spells may cause severe drought and flooding over CRB. Hence, the spatiotemporal assessment was helpful and recommended for analysing the specific risk of different hydroclimatic extremes.
Regarding Magat dam operation, sedimentation countermeasures and Magat dam pre-release have flood control effects, but they are insufficient. Therefore, there is an urgent need to optimise dam pre-release to target an appropriate balance between required storage during droughts and flood management strategies during floods. Moreover, optimising sediment management to recover reservoir volume and restore original functions is a high priority in the Cagayan River Basin, especially at Magat Dam. The simulation without a dam indicates that Cagayan Segment 1, Chico, Magat, had high outflow. Therefore, constructing an additional dam at the highly contributing tributaries is required to reduce floods in the lower CRB.
It is also recommended to start the discharge with a flow rate of 700 m3/s and a discharge rate of about 0.5 to lower the water level at Buntun Bridge and thus reduce the potential flood risk. It is also suggested that an ensemble rainfall forecast be used to optimise dam operations for pre-release before more than three days during the extreme typhoon prediction. Therefore, the effective use of an ensemble rainfall forecast system has been recommended to monitor the extreme weather situation and rainfall forecast for effective dam operation and maintain the optimised/maximum accumulated water storage volume, which can be secured and used effectively to address the water shortage/management issues to reduce drought risk during El Niño/normal climate condition. RRI models are suitable for science-based decision-making tools during extreme rainfall conditions. In addition, it is helpful for flood forecasting, early warning systems, evacuation planning, and emergency response.
5. ACKNOWLEDGEMENT
This work was supported by the Asia-Pacific Network for Global Change Research (APN) under the project CRRP2020-09MY-Kantoush (Funder ID: https://doi.org/10.13039/100005536).