
Assessing urban heat islands in Southeast Asia megacities: An integrated study of land use, climate change and heatwave occurrences
Keywords
Climate modelling · Heatwave · Local Climate Zone · Remote sensing · Southeast Asia · Urban heat island
HIGHLIGHTS
- First integrated UHI–heatwave assessment with +1 °C projections.
- LCZ-informed WRF improves UHI simulation in compact urban areas.
- Science-policy framework for climate-resilient urban planning.
1. INTRODUCTION
The urban heat island (UHI) phenomenon, coupled with heatwaves and global warming, poses significant challenges to urban environments, human health and sustainability, particularly in Southeast Asia (SEA) (Nguyen et al., 2023; Tran-Anh et al., 2026; Yu et al., 2025). Cities like Jakarta, Hanoi and Kuala Lumpur are experiencing notable temperature increases caused by both global warming and the local urbanisation impacts, raising concerns about their impacts (Doan et al., 2019; Hassan et al., 2021; Lathiifunnisa et al., 2024; Patel et al., 2022; Wati & Nasution, 2018). Recent government reports further underscore the adverse effects of heatwaves and their synergistic effects with the UHI on local communities, ecosystems and energy consumption (CNN, 2023; The Economist, 2023; Xue et al., 2024).
The UHI effect, defined as the elevated temperature difference between urban and surrounding rural areas, results primarily from heat storage in impervious materials, reduced evapotranspiration and anthropogenic heat release (Talwar et al., 2023). In tropical megacities such as those in SEA, this phenomenon is further amplified by consistently high baseline temperatures, conurbation processes and rapid urbanisation, making UHI impacts particularly acute (Rezza Ferdiansyah et al., 2024; Vujovic et al., 2021; Wang et al., 2019). These challenges have been recognised in international frameworks such as the Sustainable Development Goals (SDGs) and the Paris Agreement, which emphasise urban resilience, climate adaptation and sustainable land use as critical priorities (United Nations, 2015).
In response, various initiatives have been introduced to address UHI challenges, including the adoption of green infrastructure, heat-resilient urban design and improved ventilation systems (An & Dedekorkut-Howes, 2025; Cuce et al., 2025; Lien, 2024). However, persistent policy gaps remain, including the absence of UHI-specific regulations, limited integration of green infrastructure, inadequate consideration in building codes, low public awareness, limited interdisciplinary collaboration and incomplete monitoring systems (Semeraro et al., 2021). Closing these gaps is crucial for developing detailed strategies and methods to combat UHI and foster sustainable urban development in SEA countries. Linking UHI research to national climate strategies, such as Malaysia’s National Policy on Climate Change (Malaysia, 2024), further underlines the urgency of evidence-based approaches for climate-resilient urban planning.
Despite a growing body of research globally, UHI studies in Southeast Asia remain fragmented, often focusing on single events, limited temporal scales, or isolated cities. In particular, the integration of Local Climate Zone (LCZ) classification with UHI analysis remains limited, partly due to challenges in its applicability across different countries (Rahmani & Sharifi, 2025), which constrains efforts to compare urban thermal environments across diverse city morphologies systematically. This gap is significant given the region’s vulnerability to climate extremes and rapid land use change, in which fine-scale urban form plays a critical role in shaping local heat dynamics. Advancing approaches that combine remote sensing, LCZ mapping, climate modelling and heatwave indices can therefore provide a more comprehensive understanding of UHI formation, capturing both its biophysical drivers and socioeconomic implications (Ahmed et al., 2025; Benaomar & Outzourhit, 2024).
In recent years, remote sensing, geospatial analysis and climate modelling have emerged as essential tools and methods for studying UHIs and their connections with LCZ and Land Use Land Cover (LULC) (Chen et al., 2023; O’Malley & Kikumoto, 2022; Zhang et al., 2023). Among the most widely used remote sensing datasets for UHI studies are Sentinel-2, Landsat 8 and MODIS, owing to their ability to provide consistent observations of land cover and land surface temperature across multiple spatial and temporal scales. These technologies offer valuable insights into the spatial distribution, temporal dynamics and drivers of UHI effects, facilitating evidence-based decision making for urban planning and climate adaptation strategies. Furthermore, numerical weather prediction models such as the Weather Research and Forecasting (WRF) model play an important role in simulating urban climate dynamics and future climate scenarios. By integrating remote sensing and geospatial inputs into the WRF urban canopy model, UHI patterns can be assessed under different climate and urban development conditions. Previous studies have demonstrated the capability of WRF in simulating urban thermal environments, with Umezaki et al. (2020) applying WRF to estimate long-term UHI intensity over a 10-year period, while Deng and Zhou (2016) evaluated its performance in representing UHI effects above the building canopy layer. These studies highlight the importance of urban parameterisation in improving the accuracy of WRF-based UHI simulations.
The case of Kuala Lumpur provides a representative pilot study due to its rapid urban expansion, high population density and increasing exposure to heat-related risks (Wang et al., 2019). Kuala Lumpur exemplifies the challenges faced by SEA cities where UHI intensifies heatwave impacts, increases cooling energy demand, and exacerbates risks for vulnerable groups such as the elderly, children and low-income populations (Kamaruddin, 2024). By combining spatial analysis of land use change, climate projections and heatwave dynamics with stakeholder engagement, this study advances both the scientific understanding and the policy relevance of UHI research.
Generally, this study aimed to comprehensively assess UHI patterns, drivers and mitigation strategies, while advancing remote sensing and WRF-based approaches for UHI monitoring and prediction. By situating Kuala Lumpur within the broader SEA context, this research not only deepens scientific understanding of UHI dynamics but also offers practical insights for urban policymakers and planners. Its objectives are to (i) investigate the spatiotemporal relationships among LULC, LCZ, UHI and heatwaves; (ii) identify key drivers and impacts of UHI to inform climate resilience strategies; and (iii) develop innovative monitoring and prediction tools using remote sensing and WRF modelling. Drawing on robust scientific evidence, the study informs policymaking and supports the development of resilient and sustainable cities in the region.
2. METHODOLOGY
2.1. Study area
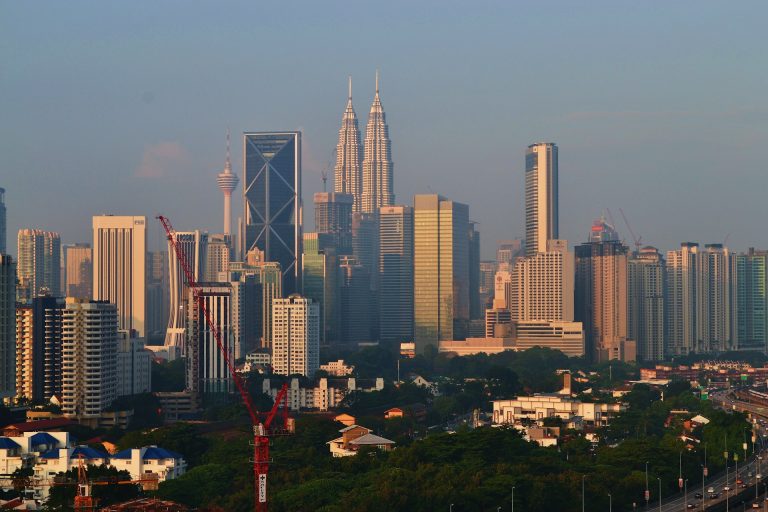
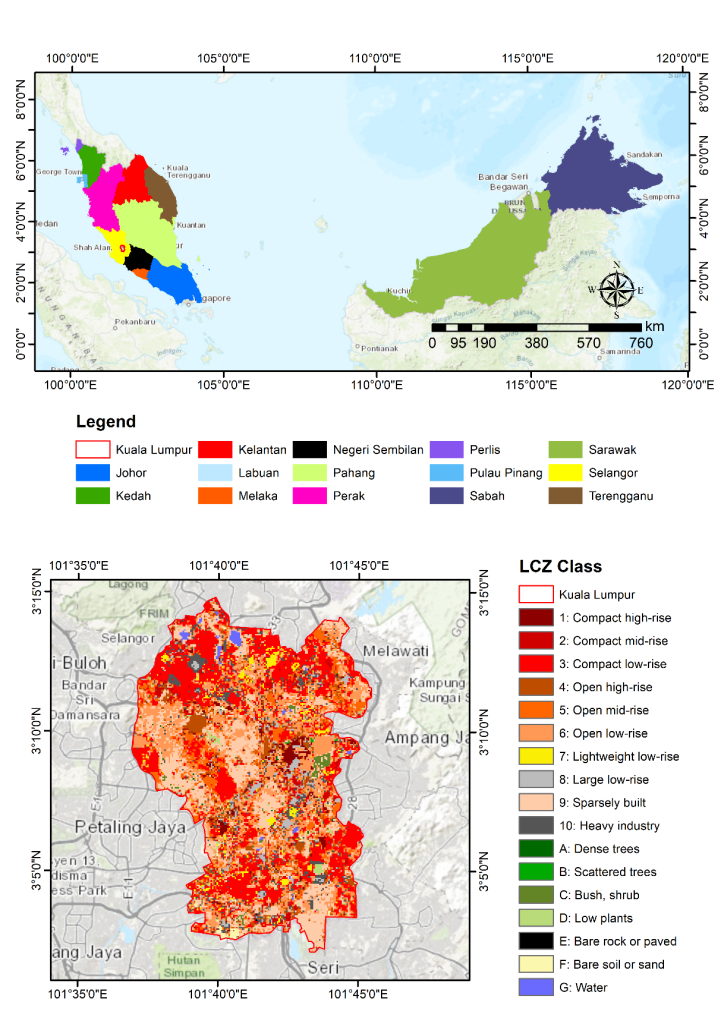
Kuala Lumpur (Figure 1), the capital city of Malaysia, was selected as the pilot study area due to its rapid urbanisation, dense built environment, and high susceptibility to UHI effects and extreme heat events (Miniandi et al., 2024). Located in the Klang Valley (3°08′24″N, 101°41′24″E), the city experiences a tropical rainforest climate with persistently high temperatures, humidity and bimodal rainfall driven by the monsoon system. In recent years, Kuala Lumpur has also experienced extreme rainfall, frequent flash floods and steadily rising temperatures, further intensifying climate-related risks (Zawawi et al., 2024). The metropolitan region contains a heterogeneous urban fabric, including high-rise commercial districts, medium-density residential zones, and peri-urban green and water bodies, making it well-suited for LCZ classification and UHI assessment. Due to their dense populations, cities like Kuala Lumpur are not only major contributors to global greenhouse gas (GHG) emissions. However, they are also extremely vulnerable to the impacts of climate change, including heatwaves, floods, severe storms and droughts. These overlapping risks make Kuala Lumpur an ideal case study for investigating the interactions between urban morphology, UHI dynamics and extreme heat under current and projected climate conditions.
2.2. LCZ classification
The LCZ classification was conducted using the LCZ Generator web platform (Demuzere et al., 2021), with training areas derived from building footprint and LULC datasets. This web tool has been widely used in previous studies, including those by Abougendia (2023), Senyel Kurkcuoglu et al. (2025) and Rahmani and Sharifi (2025), to assess UHI intensity across different LCZ classes. Building footprint data provided urban morphological characteristics such as density, coverage and height, which were critical for distinguishing compact and open built-up LCZ types. In contrast, LULC data represented natural surfaces including vegetation, bare soil and water. To ensure balanced training samples, large homogeneous polygons (>1.5 km2) were reduced to a radius of ∼350 m following recommended WUDAPT protocols. The training areas, together with a suite of Earth observation predictors (Landsat, Sentinel-1/2, terrain and canopy height features), were used as input to a random forest classifier implemented in Google Earth Engine. The classification produced LCZ maps at 100 m spatial resolution, along with a Gaussian-filtered version and class probability layer.
The LCZ classification consists of 17 standardised classes representing urban and natural land-cover types based on surface cover, building structure and land use. Urban classes include compact high-rise (LCZ 1), compact mid-rise (LCZ 2), compact low-rise (LCZ 3), open high-rise (LCZ 4), open mid-rise (LCZ 5), open low-rise (LCZ 6), lightweight low-rise (LCZ 7), large low-rise (LCZ 8), sparsely built (LCZ 9) and heavy industry (LCZ 10). Natural land-cover classes comprise dense trees (LCZ A), scattered trees (LCZ B), bush or scrub (LCZ C), low plants (LCZ D), bare rock or paved surfaces (LCZ E), bare soil or sand (LCZ F) and water (LCZ G) (Stewart & Oke, 2012).
2.3. UHI derivation
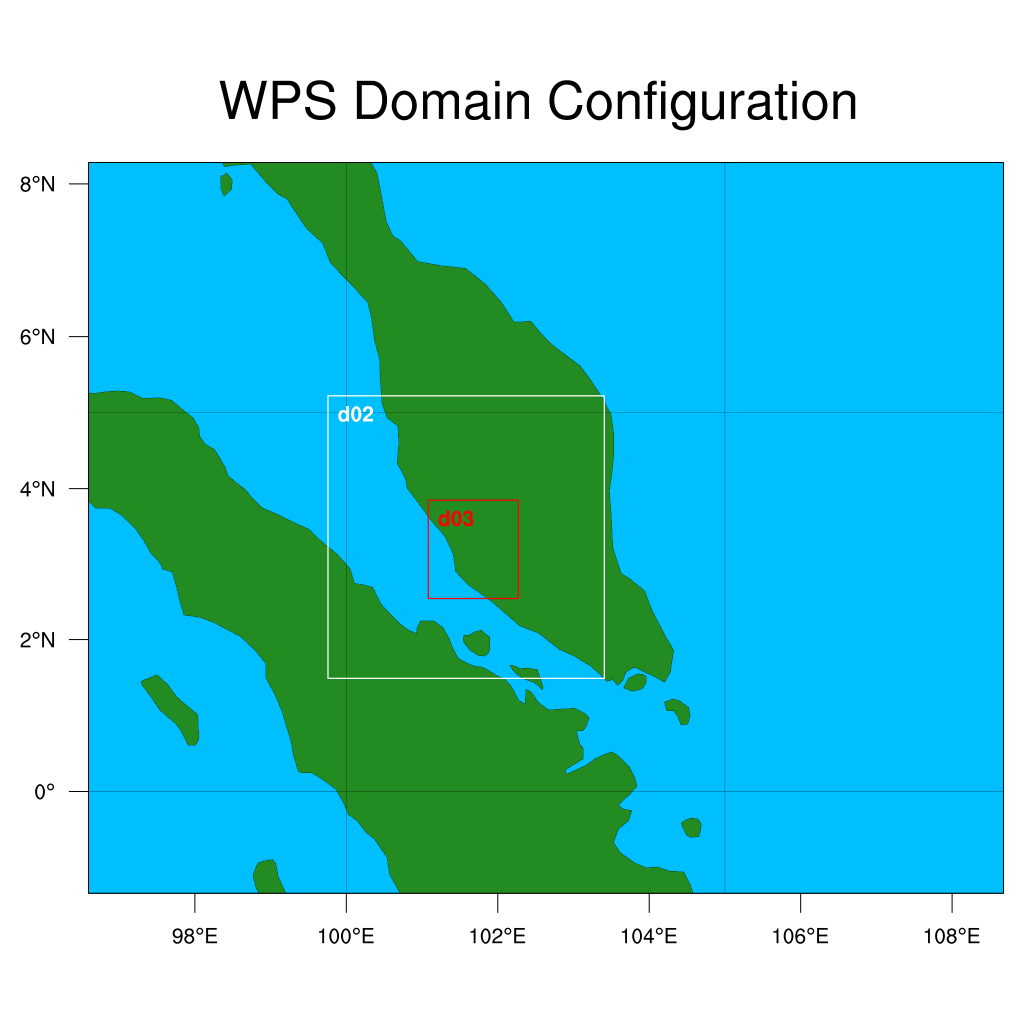
The UHI intensity was derived using both remote sensing and numerical modelling approaches. In the first approach, MODIS land surface temperature (LST) data from Terra and Aqua satellites were processed in Google Earth Engine (GEE) to extract daytime and nighttime LST for the period 2000–2024. Urban and rural reference areas were identified based on the LULC classification. Built-up areas were considered urban references, while vegetated land cover classes, such as forest and agricultural areas, were used as rural references. The rural reference areas were selected outside the urban core to represent background surface temperature conditions. UHI intensity was calculated as the difference between urban and rural LST, where positive values indicate warmer urban surfaces relative to surrounding rural areas. In the second approach, the WRF model was employed to simulate near-surface skin temperature (TSK). The urban canopy model (UCM) was coupled with the WRF software version 4.5 for the simulation of the urban climate of Kuala Lumpur city. The study domain adopted a three-level nested configuration, with d01 (9 km × 9 km) covering the Malay Peninsula, d02 (3 km × 3 km) and d03 (1 km × 1 km) focused on Kuala Lumpur (Figure 2). This nested domain configuration enables large-scale atmospheric processes to be captured while providing high-resolution simulations over the study area. April 2024 was chosen as the case study period due to several occurrences of heatwaves during that month in the city (NADMA, 2024). The physics setting used for the WRF is the tropical suite (UCAR, 2025).
Three urban parameter configurations were tested to represent the LCZ classification within WRF: (i) Single Layer Urban Canopy Model (SLUCM), (ii) WRF with default LCZ parameters, and (iii) WRF with localised LCZ parameters (LCZ_local) tailored to the study area’s urban morphology, derived from the CGLC-MODIS-LCZ_100m dataset. These simulations were used to estimate UHI intensity during a documented heatwave event in April 2024 and to assess the sensitivity of future UHI conditions to a +1 °C atmospheric temperature perturbation. The +1 °C perturbation was adopted as a sensitivity experiment to evaluate the response of urban thermal conditions to incremental warming rather than to simulate future climate under specific emissions pathways. Model performance was evaluated by comparing simulated TSK with MODIS-derived LST as the reference dataset. No ground-based observations or meteorological station data were used for model validation. The comparison was conducted using statistical metrics including mean absolute error (MAE), root mean square error (RMSE), bias, correlation coefficient (r), coefficient of determination (R2), and Willmott’s index of agreement (d), calculated using Python software.
2.4. Heatwave analysis
A heatwave is defined as a period of unusually high temperatures that poses significant risks to human health, infrastructure and ecosystems, characterised by sustained excess heat accumulation over multiple days. In this study, heatwaves were evaluated using the Excess Heat Factor (EHF), a metric designed to monitor and forecast heatwave intensity and severity with a focus on human health impacts (Nairn & Fawcett, 2015). The EHF was calculated from daily mean temperature (DMT) values derived from the hourly ERA5-Land reanalysis dataset (Hersbach, 2020). ERA5-Land provides hourly air temperature at 2 m spatially interpolated to a ∼9 km grid, offering a consistent long-term climate record suitable for heatwave assessment. Previous ecological and climatological studies conducted across Southeast Asia have extensively validated and applied ERA5-Land (Linarka et al., 2025), confirming its reliability as a proxy for interannual climate variability. The DMT, denoted as Ti, which is the average of the daily maximum and minimum temperatures for day i, reflecting the physiological impact of a hot night following a hot day. The EHF was calculated using two excess heat indices over a three-day period (TDP). The first index, the significance index, is given by:
$$EHI_{\mathrm{sig}} = \frac{T_i + T_{i+1} + T_{i+2}}{3} – T_{95}$$
where T95 is the local 95th percentile of DMT, calculated independently for each grid cell using the ERA5 hourly reanalysis dataset over the climatological reference period 1971–2000. This index assesses absolute heat relative to the annual climate. A positive EHFsig, indicates the TDP is unusually warm, a prerequisite for a heatwave, typically excluding winter half-year events. The second index, the acclimatisation index, is:
This measures the deviation of the three-day DMT from the average over the prior 30 days, accounting for short-term human and system adaptation. The final EHF was computed as:
$$EHF = EHI_{\mathrm{sig}} \times \max\left(1,\, EHI_{\mathrm{accl}}\right)$$
yielding positive values only when conditions are unusually hot, with units in °C2 for intensity quantification.
This enables severity classification: low-intensity for 0 < EHF < EHIas (where EHIas is the 85th percentile of positive EHF values), severe for, EHIas < EHF < 3 × EHIas, and extreme for EHF ≥ 3 × EHFas allowing normalised comparisons across diverse climates.
Compared with traditional definitions, which rely on sequences of daily maximum temperatures that exceed fixed thresholds (e.g., three days above the 90th percentile), EHF offers distinct advantages. It incorporates minimum temperatures to capture overnight heat retention and cumulative thermal stress, critical for health impacts, rather than focusing solely on daytime peaks. By including the acclimatisation index, EHF reduces false positives due to gradual warming, better aligning with human vulnerability. Additionally, its continuous intensity scale and severity classification provide a more nuanced impact assessment than binary traditional methods, enhancing forecasting accuracy and supporting tailored mitigation strategies (Nairn & Fawcett, 2015).
For the assessment of heatwaves using the EHF method, we evaluated four key characteristics:
Heatwave intensity (HWI), quantified as the annual mean EHF, measured the severity of heatwave events by combining temperature exceedance and acclimatisation effects. This annual mean provided a standardised metric for comparing severity across regions and years.
Heatwave duration (HWD) is the total number of days across all heatwave events in a year, where each event requires at least three consecutive days with EHF > 0. It is calculated as:
$$HWD = \sum_{j=1}^{m} d_j$$
where m is the number of heatwave events, and dj is the number of consecutive days in the jth event. This metric quantifies cumulative heat exposure, crucial for assessing impacts on health, agriculture and infrastructure (Perkins-Kirkpatrick & Lewis, 2020).
Heatwave frequency (HWF) is the number of distinct heatwave events in a year, each comprising at least three consecutive days with EHF > 0, separated by at least one day with EHF ≤ 0. It is expressed as:
$$HWF = m.$$
Heatwave peak temperature (HWP) is the yearly averaged maximum DMT during heatwave events, calculated as:
$$HWP = \frac{1}{m} \sum_{j=1}^{m} T_{\max,j}$$
where Tmax,f is the maximum DMT during the jth heatwave event.
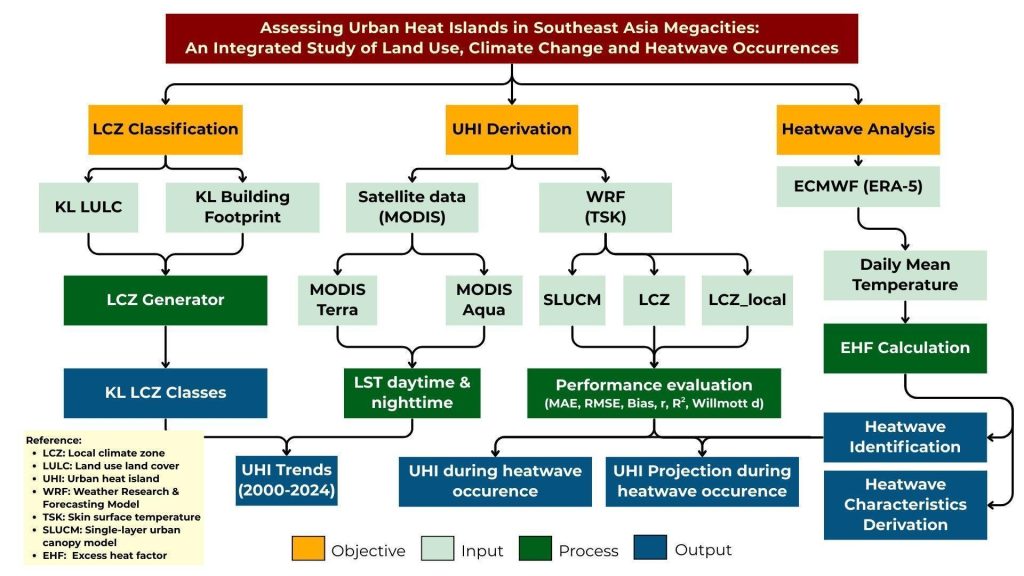
Overall methodology is shown in Figure 3.
3. RESULTS AND DISCUSSION
3.1. UHI trends from 2000 to 2024
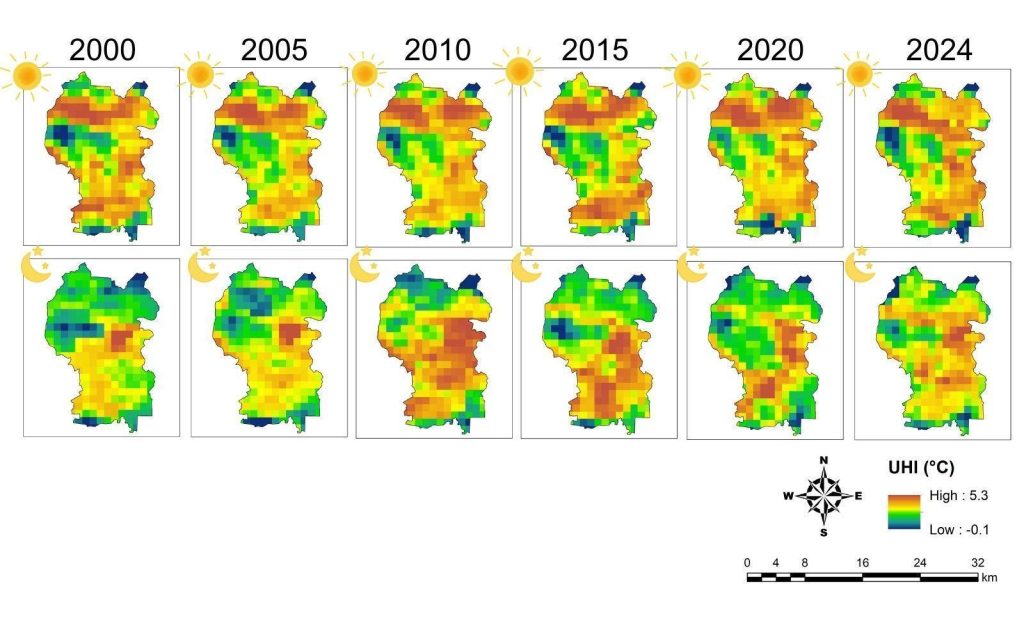
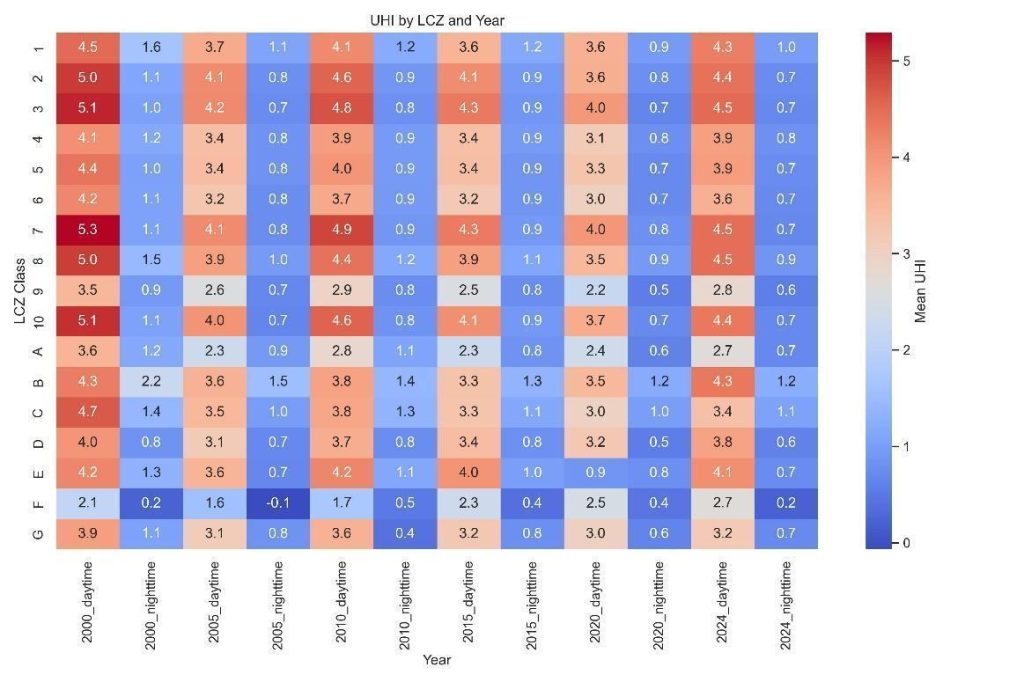
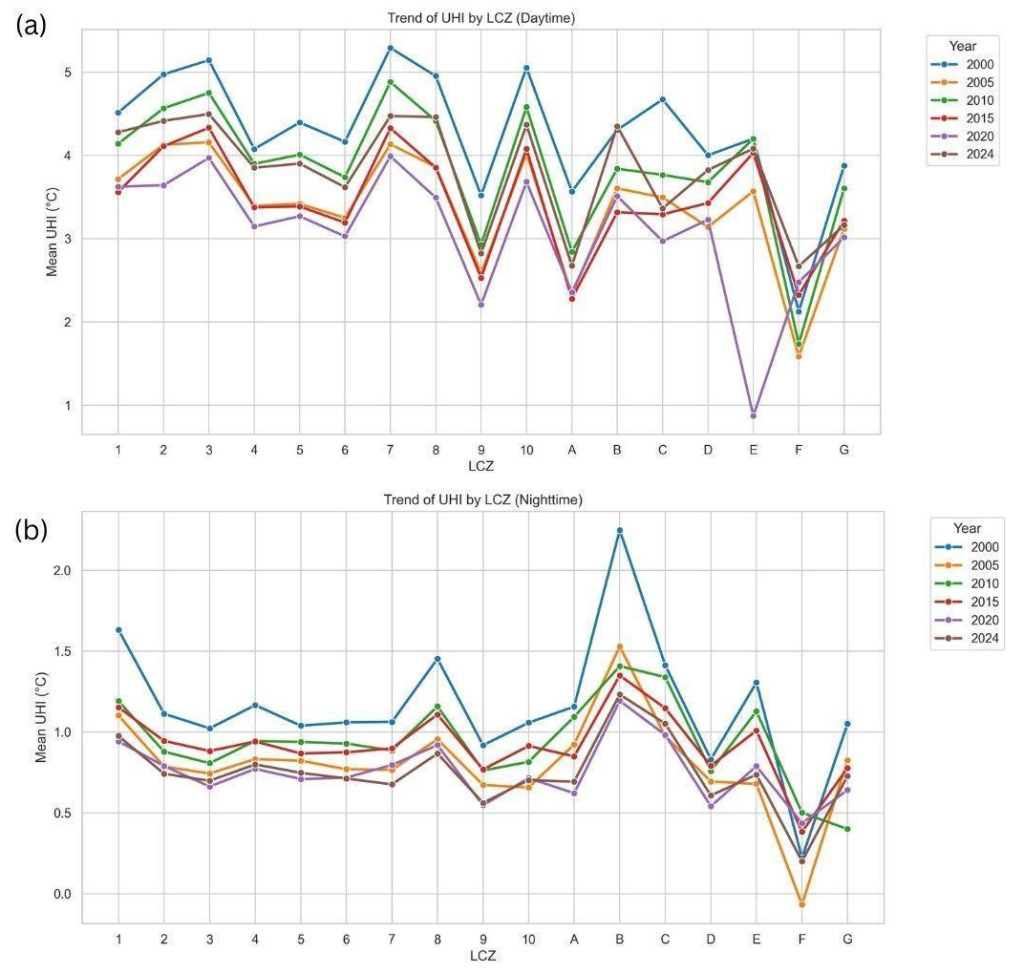
The analysis of UHI intensity from 2000 to 2024 reveals clear spatial and temporal variability, with statistically significant differences between LCZ classes (p < 0.05) (Figures 4–6). The following subsections present the spatial, LCZ-specific and diurnal trends in detail.
3.1.1. Spatial patterns
The spatial distribution maps (Figure 4) reveal persistent UHI hotspots in the central urban core of Kuala Lumpur throughout 2000–2024. These hotspots align with compact built-up areas, particularly in the commercial and high-density residential zones, whereas peripheral areas remain cooler and exhibit weaker UHI intensity. This spatial heterogeneity highlights the strong influence of urban morphology and surface cover on thermal patterns at the metropolitan scale. The slightly negative UHI values (minimum = −0.1 °C) primarily reflect local variations arising from the urban–rural reference temperature used in the UHI calculation rather than a persistent urban cool island effect. Because UHI intensity was computed as the temperature difference between urban and rural reference areas, localised conditions, such as vegetation within urban areas, water bodies, elevation differences, or spatial heterogeneity in land cover, may occasionally result in urban temperatures being marginally lower than the selected rural reference. The small magnitudes of these negative values indicate they are negligible and do not alter the overall spatial pattern of positive UHI observed across Kuala Lumpur.
3.1.2. LCZ-Specific variations
The LCZ-based analysis (Figure 5) quantifies these spatial patterns by showing that compact built-up LCZs (LCZ 1–3) consistently exhibit the highest UHI intensities, ranging from 4.0–5.3 °C, while natural LCZ classes (LCZ A–G) remain comparatively cool, generally below 1.5 °C. This contrast confirms that building density, impervious surfaces and reduced vegetation are key drivers of elevated surface temperatures. The consistent intensity of hotspots across the study period indicates that compact urban forms are the primary contributors to Kuala Lumpur’s long-term UHI.
3.1.3. Temporal and diurnal trends
Figure 6 extends the analysis by examining UHI trends for daytime (6a) and nighttime (6b) from 2000 to 2024. The mean daytime UHI during this period was 3.6 °C, indicating a persistent heat island effect across Kuala Lumpur. Daytime UHI shows the strongest effects, with compact LCZs peaking above 5 °C in 2000 and remaining above 4 °C in most subsequent years. Cooler LCZs (E–G) consistently remain below 3 °C, reinforcing the moderating influence of vegetation and open surfaces.
Nighttime UHI is much weaker, averaging 0.9 °C, with a maximum of 2.2 °C observed in LCZ B (2000) and localised cooling recorded in LCZ F (–0.1 °C) in 2005. Across nearly all LCZs, daytime peaks are 3–4 °C higher than nighttime values, confirming the dominant role of solar heating and heat storage during the day, while radiative cooling and reduced anthropogenic heat emissions moderate nocturnal temperatures.
Temporal trends reveal a notable intensification between 2010 and 2015, followed by partial moderation in recent years.
Built-up LCZs consistently maintained higher UHI levels than vegetated zones, driving both the spatial and temporal patterns observed. Collectively, Figures 2–4 demonstrate how LCZ characteristics shape the spatial distribution, diurnal amplitude and long-term evolution of UHI across Kuala Lumpur.
3.2. Performance assessment of WRF_Simulated temperatures with SLUCM, LCZ and LCZ_local land use inputs
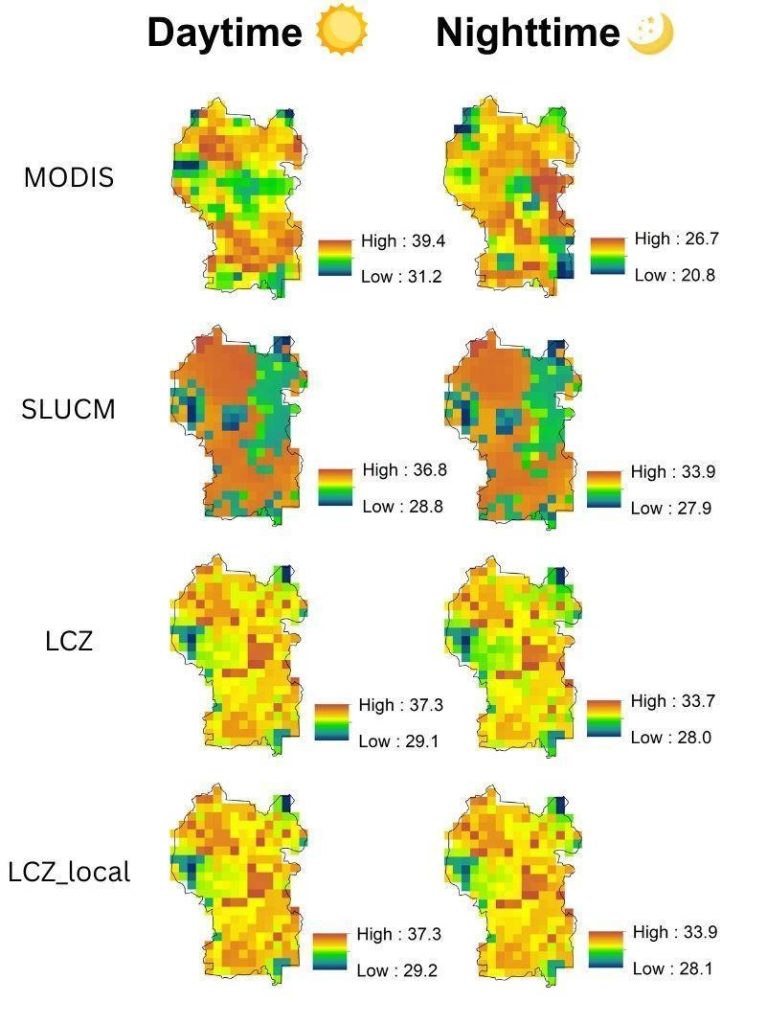
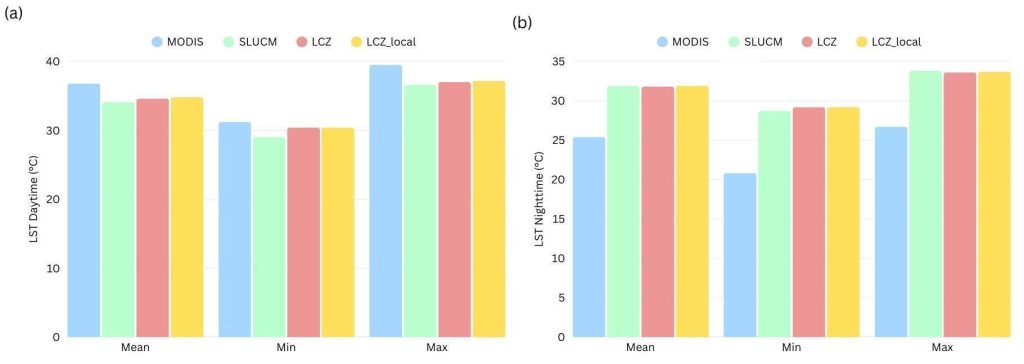
Daytime and nighttime LST were analysed to evaluate the performance of WRF-simulated models (SLUCM, LCZ and LCZ_local) against reference data derived from MODIS (via GEE). For daytime conditions, both LCZ and LCZ_local simulations produced mean values closest to the MODIS reference, indicating relatively better agreement (Figures 7 and 8). SLUCM, however, simulated the lowest extremes, with minimum and maximum values of 29 °C and 37 °C, respectively, suggesting an underestimation of daytime variability (Figure 8). Statistical evaluation in Table 1 confirmed these patterns: LCZ_local achieved the lowest errors (MAE ≈ 2.2 °C; RMSE ≈ 2.5 °C), while all models exhibited a negative bias of approximately −2.0 °C to −2.7 °C. Correlation was moderate (r ≈ 0.3–0.5), reflecting an ability to capture overall patterns but with limited representation of variability. The explained variance remained modest (R2 ≈ 0.1–0.2).
| Dataset | Time | MAE | RMSE | Bias | r |
R2 |
Willmott d |
|---|---|---|---|---|---|---|---|
| SLUCM | Daytime | 2.8 | 3.2 | −2.7 | 0.5 | 0.2 | 0.4 |
| Nighttime | 6.6 | 6.7 | 6.6 | 0.0 | 0.0 | 0.1 | |
| LCZ | Daytime | 2.3 | 2.6 | −2.1 | 0.2 | 0.1 | 0.4 |
| Nighttime | 6.4 | 6.5 | 6.4 | 0.0 | 0.0 | 0.2 | |
| LCZ_local | Daytime | 2.2 | 2.5 | −2.0 | 0.3 | 0.1 | 0.4 |
| Nighttime | 6.5 | 6.6 | 6.5 | 0.0 | 0.0 | 0.2 |
Meanwhile, at nighttime, SLUCM, LCZ and LCZ_local yielded similar mean values, but all were consistently higher by about +6 °C than the MODIS reference (Figures 7 and 8). This positive bias was also reflected in the minimum and maximum values, with all three models overestimating nighttime LST. Performance statistics (Table 1) indicated large errors (MAE ≈ 6.4–6.6 °C; RMSE ≈ 6.5–6.7 °C), negligible correlation (r = 0.0)and no explained variance (R2 = 0.0). Willmott’s index of agreement was also very low (d ≈ 0.1–0.2), highlighting poor overall agreement between modelled and observed nighttime LST.
Although ground-based meteorological observations are commonly used to evaluate WRF simulations of near-surface air temperature (T2), this study focused on land surface temperature, the TSK, which is directly comparable with MODIS LST. The use of MODIS enabled spatially explicit validation of the simulated surface temperature and UHI patterns across Kuala Lumpur. Nevertheless, the inclusion of ground-based observations would provide complementary validation and could further improve confidence in the model performance.
Overall, the LCZ_local configuration consistently outperformed SLUCM and LCZ, particularly under daytime conditions and can therefore be considered the most reliable model setup for reproducing observed temperature patterns in this study.
3.3. UHI intensity across LCZ during heatwave periods
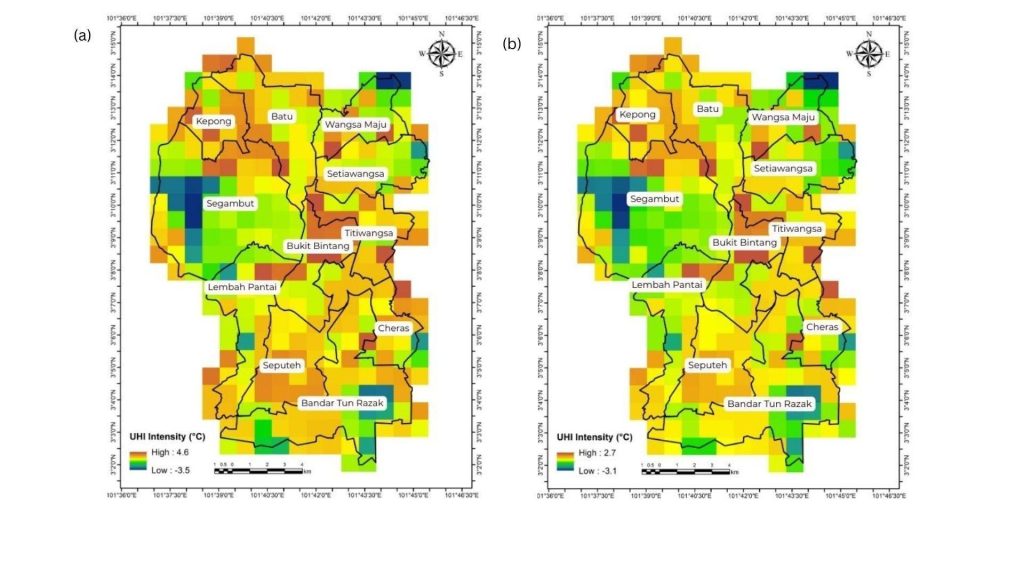
Since LCZ_local demonstrated the best overall performance, it was selected to calculate UHI intensity during the heatwave period in Kuala Lumpur (April 2024). The estimated UHI intensity ranged from −3.5 to 4.6 °C during the daytime and from −3.1 to 2.7 °C at nighttime (Figure 9). The negative UHI values indicate locations where surface temperatures were lower than the selected rural reference, representing localised urban cool island conditions or the influence of heterogeneous land-cover characteristics within the urban–rural reference framework. These areas are primarily associated with vegetated and open landscapes, where shading, evapotranspiration, proximity to water bodies and local topographic effects can reduce surface temperatures despite the occurrence of a regional heatwave. Results of the ANOVA indicate that UHI intensity varied significantly across LCZ classes, with a p-value < 0.05 confirming statistically significant differences at the 5% level (Table 2). Among the classes, LCZ 1–3 consistently exhibited the highest UHI intensity compared to other LCZ types, reflecting the influence of dense building morphology and high impervious surface cover (Figure 10).
| sum_sq | df | F |
PR(>F) | ||
|---|---|---|---|---|---|
| Daytime | LCZ | 530.84 | 16.00 | 681.07 | 0.00 |
| Residual | 12.86 | 264.00 | |||
| Nighttime | LCZ | 246.21 | 16.00 | 419.03 | 0.00 |
| Residual | 9.69 | 264.00 |
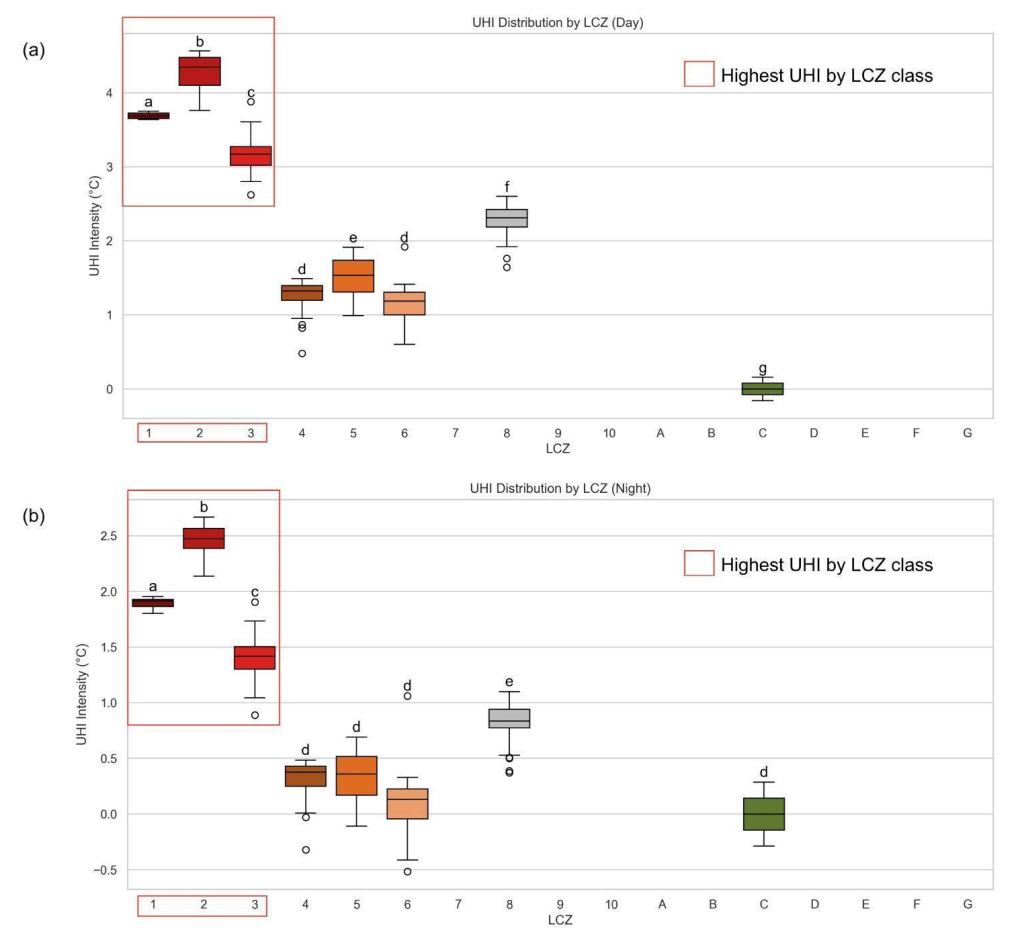
Notably, several LCZ classes (LCZ 7, 10, A, B, D, E, F and G) were absent in the WRF outputs. This is attributable to the heterogeneous and fragmented distribution of these classes in Kuala Lumpur, which are too small in spatial extent to be resolved by the WRF’s dominant land-use representation. Their omission is not expected to substantially affect the overall UHI patterns, given their limited areal coverage within the study domain. Collectively, these results confirm that UHI intensity in Kuala Lumpur is strongly dependent on LCZ type, with the most pronounced heat stress concentrated in compact urban areas, underscoring the importance of targeted heat mitigation strategies.
3.4. UHI trends during heatwave periods
The daily UHI intensity ranged between 3.9 °C and 5.8 °C, with the peak recorded on 11 April (Figure 11(a)). The overall mean UHI was 4.7 °C and variability was relatively low (standard deviation < 2.5 °C), indicating stable conditions with no extreme fluctuations.
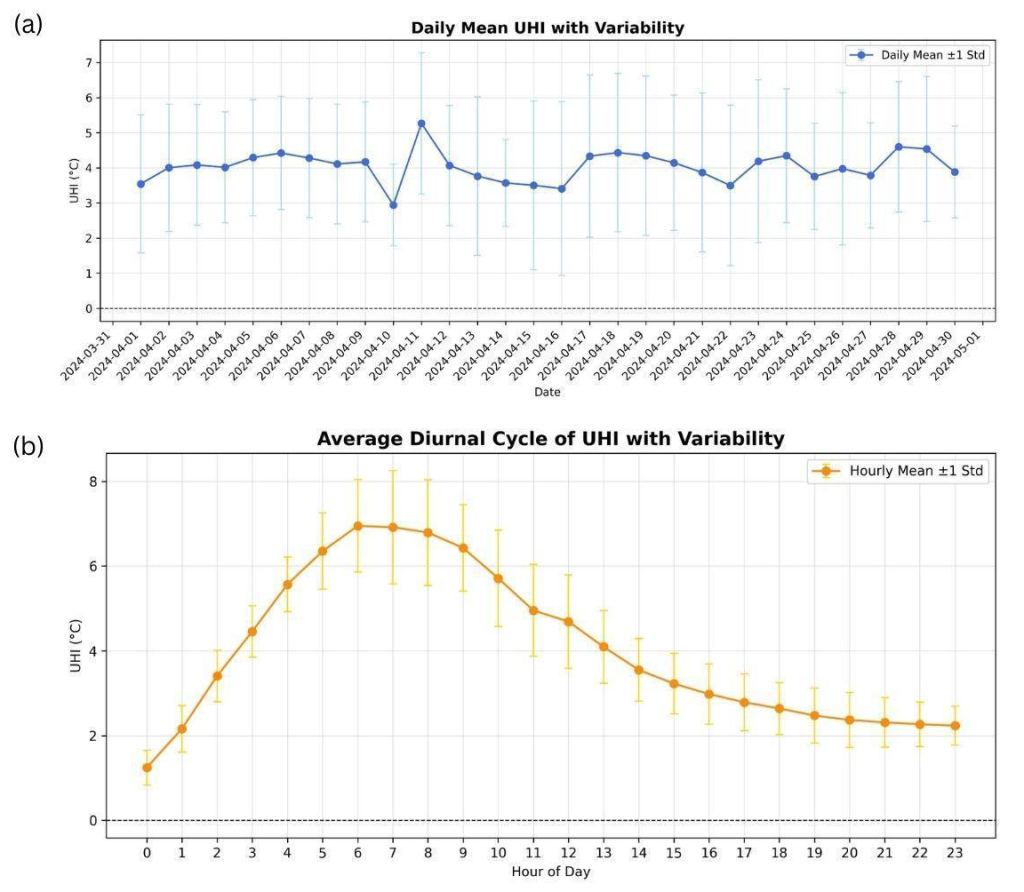
The diurnal cycle showed a peak UHI intensity of approximately 6.9 °C occurring during the early morning (06:00–07:00), while the lowest intensity (∼2.0 °C) was observed around midnight to the early nighttime hours (Figure 10(b)). The early-morning peak is physically plausible, as it corresponds to the pre-sunrise period, when the contrast between urban and rural thermal responses is typically strongest. During nighttime, rural areas generally experience more rapid cooling due to efficient longwave radiation loss and lower thermal storage capacity, whereas urban surfaces retain heat accumulated during the daytime due to higher heat capacity, reduced sky-view factor and limited nocturnal radiative cooling (Cimolai & Aguilar, 2025; Pron & Zyane, 2026). Consequently, the urban–rural temperature difference increases and reaches its maximum before sunrise. This diurnal behaviour is consistent with previous studies based on both remote sensing observations and in situ measurements, which commonly report stronger UHI intensity during nighttime and early morning periods, followed by a reduction during daytime as solar heating decreases the temperature contrast between urban and non-urban areas (Mathew et al., 2018; Memon et al., 2009). However, the exact timing and magnitude of the peak UHI can vary among cities, depending on local characteristics such as urban morphology, vegetation cover, surface properties and prevailing weather conditions. Following sunrise, increasing solar radiation warms both urban and rural surfaces, reducing the relative temperature contrast and weakening UHI intensity. The diurnal variation was approximately 5 °C between the minimum and maximum values. The relatively low variability (standard deviation < 1.3 °C) throughout the cycle indicates a consistent and stable diurnal UHI pattern during the heatwave period.
3.5. Projected impacts of +1 °C temperature increase on UHI across LCZ
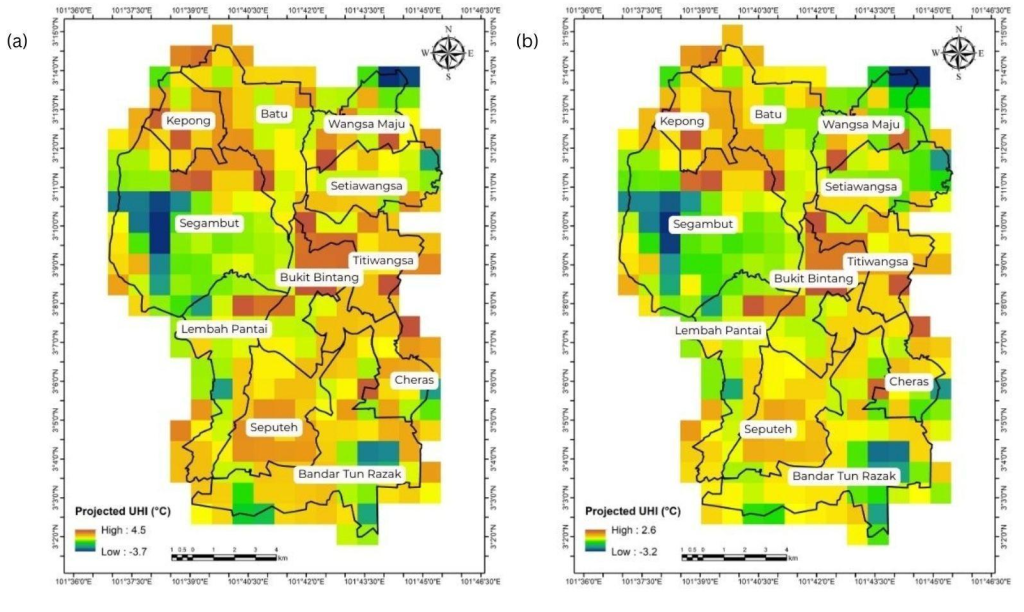
Given that LCZ_local demonstrated the highest overall performance, it was applied to estimate the projected UHI intensity during the heatwave period in Kuala Lumpur (April 2024) under the +1 °C perturbation scenario. The simulated UHI intensity ranged from −3.7 °C to 4.5 °C during the daytime and from −3.2 °C to 2.6 °C at nighttime (Figure 12). Spatially, the strongest UHI effects were concentrated in compact and dense built-up areas (LCZ 1–3), whereas vegetated and open zones exhibited lower UHI values, indicating localised cooling. The results of the ANOVA confirmed that UHI intensity varied significantly by LCZ (p < 0.05) (Table 3), with post-hoc analysis further showing that LCZ 1–3 were significantly different from the more open and natural LCZ classes (Figure 13).
| sum_sq | df | F |
PR(>F) | ||
|---|---|---|---|---|---|
| Daytime | LCZ | 541.05 | 16.00 | 694.08 | 0.00 |
| Residual | 12.86 | 264.00 | |||
| Nighttime | LCZ | 247.98 | 16.00 | 370.05 | 0.00 |
| Residual | 11.06 | 264.00 |
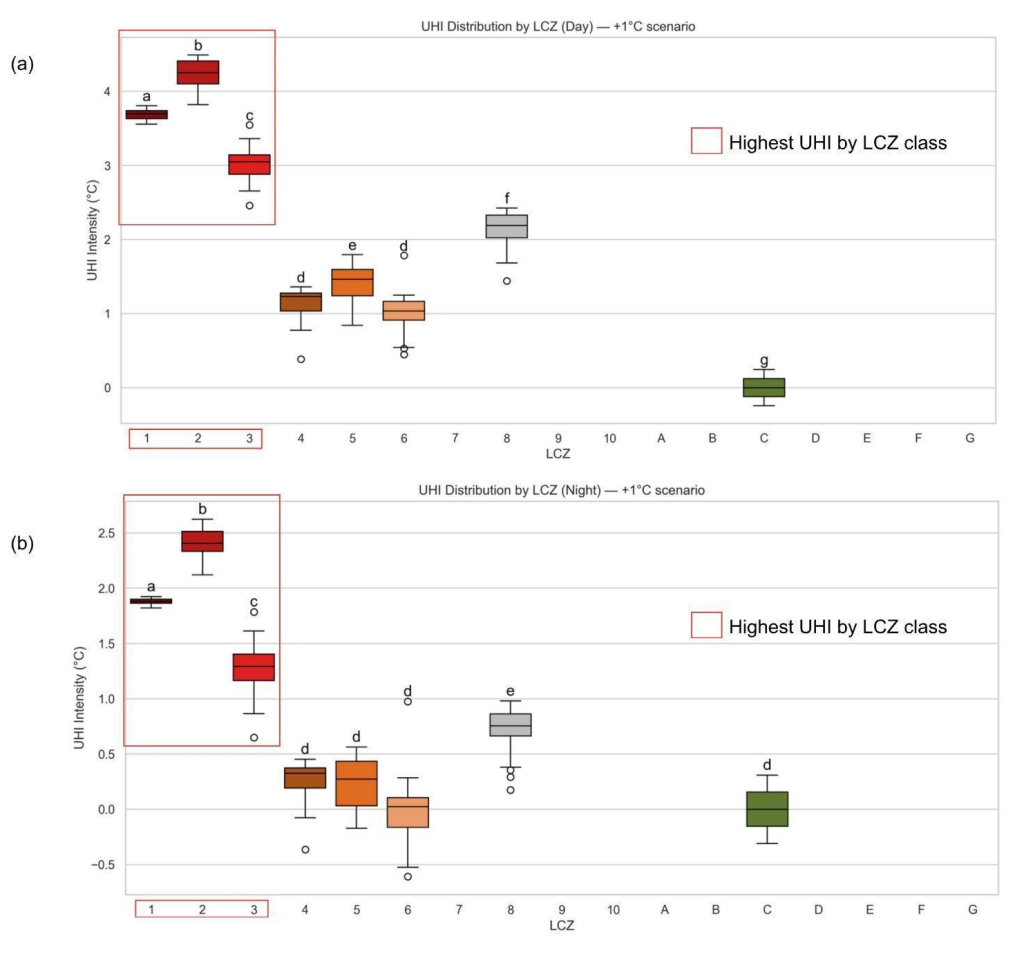
Temporally, both daytime and nighttime UHI displayed variability, with hotspots distributed across both mid- and high-rise built-up areas. The +1 °C perturbation amplified UHI intensity across all LCZ classes, with the largest increases occurring in compact urban forms, underscoring the disproportionate heat stress in these areas. Overall, LCZ_local not only reproduced observed spatial–temporal patterns more accurately than SLUCM and standard LCZ but also highlighted the heightened vulnerability of dense urban LCZs during extreme heat events (Figure 12).
3.6. Heatwave characteristics
Heatwave characteristics were analysed at both regional and city scales to distinguish the influence of large-scale climate variability from localised urban thermal effects. The analysis across Peninsular Malaysia provides the broader climatic context of changing heat extremes. At the same time, the Kuala Lumpur-specific assessment highlights how these regional changes translate into increasing thermal stress within a highly urbanised environment. Although heatwaves are not directly caused by UHI, the interaction between background warming, prolonged heat events and urban land surface characteristics can amplify heat exposure in cities. Therefore, evaluating heatwave intensity, duration, frequency and peak temperature provides important context for interpreting the magnitude and persistence of UHI effects under extreme heat conditions.
Figure 14 reveals pronounced spatial and temporal changes in the HWI across Peninsular Malaysia over the past four decades. Between 1980 and 1999, the average HWI was 0.41 °C2, with values ranging from 0.17 °C2 to 0.83 °C2. Higher intensities were concentrated in the northern and central regions, while southern parts, including Johor and the coastal lowlands, exhibited relatively weaker heatwave signals. In contrast, during 2000–2024, the mean HWI increased markedly to 0.52 °C2, with local maxima reaching 1.13 °C2, particularly in northern inland areas such as Kedah and Perak. This spatial shift suggests a northward and inland intensification of heatwave conditions, possibly reflecting both changes in background climate and land surface modifications. The anomaly map, showing differences between the two periods, indicates a widespread positive signal, with anomalies ranging from 0.1 °C2 to 0.5 °C2 across most of the peninsula. The strongest anomalies are observed in the northwestern and northeastern regions, while minor or near-neutral changes occur in a few southern coastal zones. This pattern implies that the increase in heatwave intensity has been both spatially extensive and geographically differentiated, with interior and northern regions experiencing the greatest amplification.
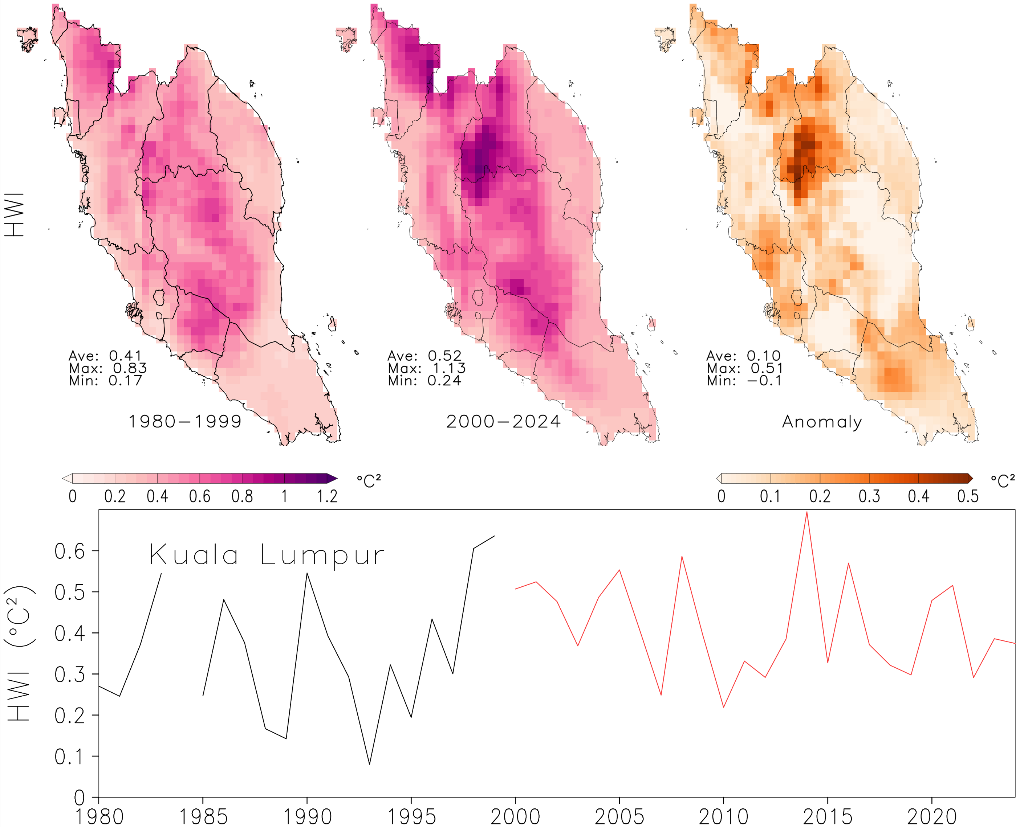
The time series for Kuala Lumpur provides further temporal detail by demonstrating how regional-scale heatwave intensification manifests in one of Southeast Asia’s most rapidly urbanising metropolitan areas. This city-scale assessment complements the UHI analysis by identifying periods when enhanced background heat conditions may increase the vulnerability of urban populations to additional warming from built environments. From 1980 to the early 1990s, HWI values fluctuated between 0.2 °C2 and 0.5 °C2, followed by a brief decline around the mid-1990s. After 2000, however, a clear upward trend emerged, with several pronounced peaks—most notably around 2010–2015, when HWI values exceeded 0.6 °C2, the highest in the record. Although interannual variability remains substantial, the overall mean during 2000–2024 is consistently higher than during 1980–1999.
Taken together, these results highlight a significant intensification of heatwaves across Peninsular Malaysia, with a regional mean increase of about 0.1 °C2 and local increases exceeding 0.3–0.4 °C2. The stronger signal over northern and highly urbanised regions, including Kuala Lumpur, indicates the potential compounding effects of regional climate warming and urban land surface modification on heat exposure. While HWI primarily reflects background heatwave characteristics, its upward trend provides important climatic context for understanding how extreme heat events may interact with UHI processes in urban areas. This intensification not only underscores the growing risks of heat stress in densely populated and agricultural regions but also signals the need for adaptive planning to mitigate the health and environmental impacts of rising heat extremes.
Between 1980 and 1999, the average heatwave duration across the peninsula was 15.2 days, with spatial variations ranging from 12.5 to 17.3 days (Figure 15). Heatwave events were relatively short and evenly distributed, with slightly longer durations observed in the northern inland and east-coastal areas. This pattern suggests that heatwave conditions were relatively moderate and localised during this earlier baseline period. In contrast, the 2000–2024 period exhibits a substantial intensification in both the magnitude and spatial extent of heatwaves. The mean HWD nearly doubled to 29.6 days, with durations exceeding 40 days in some southern and central regions, including Pahang, Negeri Sembilan and Johor. This spatial shift toward longer, more persistent heatwaves indicates a significant increase in the frequency and duration of hot conditions across the entire peninsula. The anomaly map further highlights this escalation, showing widespread positive anomalies between +4 and +28 days, with the strongest increases occurring in southern and interior zones, while even traditionally cooler northern areas experienced notable lengthening of heatwave events.
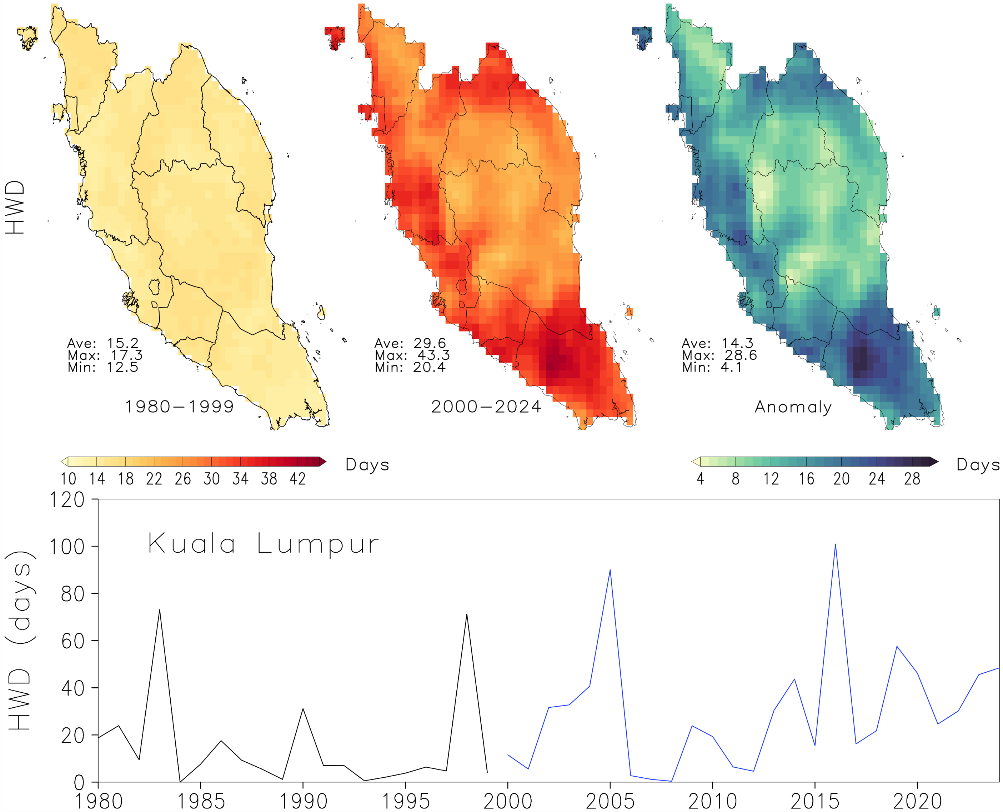
The time series for Kuala Lumpur reflects this broader regional pattern. Between 1980 and 1999, the city experienced short, sporadic heatwave periods, typically lasting fewer than 20 days per year, with occasional peaks around 1985 and 1995, reaching 60–70 days. After 2000, however, a marked shift occurred: HWD values increased sharply, with frequent episodes exceeding 50 days and the most extreme peaks surpassing 100 days around 2010–2015. This trend underscores a transition from intermittent heatwaves to sustained, prolonged events in recent decades.
Figure 16 shows clear spatial and temporal increases in HWF across Peninsular Malaysia between 1980–1999 and 2000–2024. During the earlier period, heatwaves were relatively rare, averaging 2.68 events per year (range 1.7–4.15), with most areas experiencing only two to four events annually. By contrast, from 2000–2024, the mean frequency more than doubled to 5.40 events, with several southern and central regions recording up to 7–8 events per year. The anomaly map highlights widespread increases of 0.4–5.4 events, most pronounced in southern and inland zones.
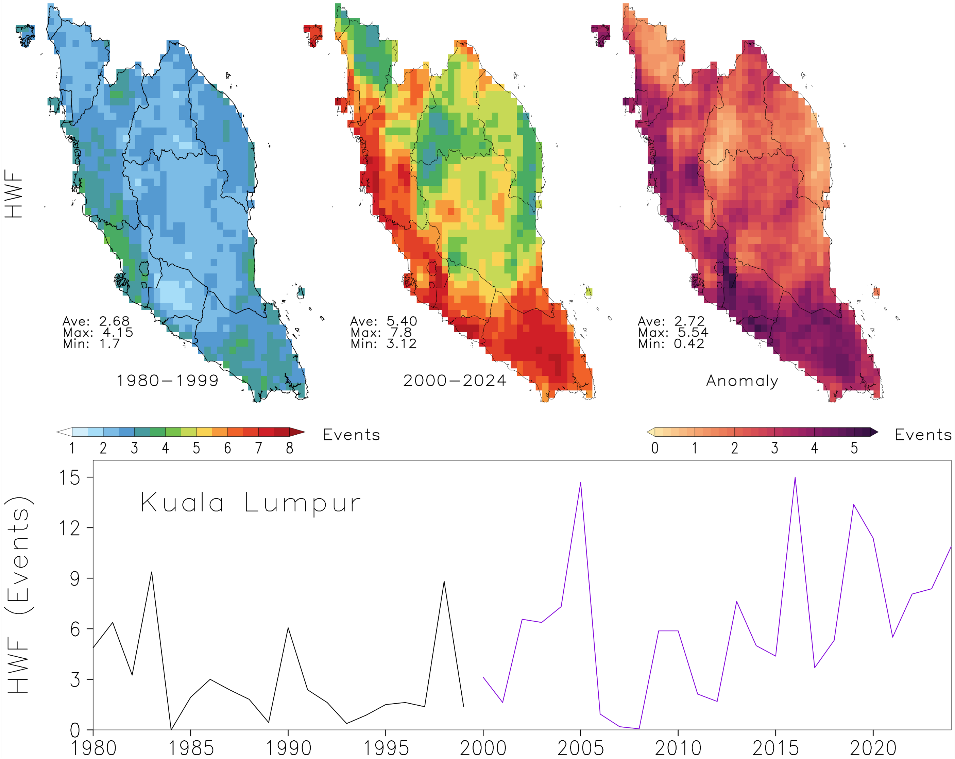
Simulation results for Kuala Lumpur reflect a similar pattern. From 1980 to 1999, heatwave events remained below four per year, interrupted by occasional spikes. After 2000, frequencies rose sharply, with repeated peaks exceeding 10–14 events, especially during 2005–2017. The results indicate a substantial and geographically consistent rise in heatwave occurrences, driven by regional warming and intensified by urbanisation. This increase in both magnitude and recurrence underscores growing thermal stress in urban areas, emphasising the need for improved heat management and adaptation planning.
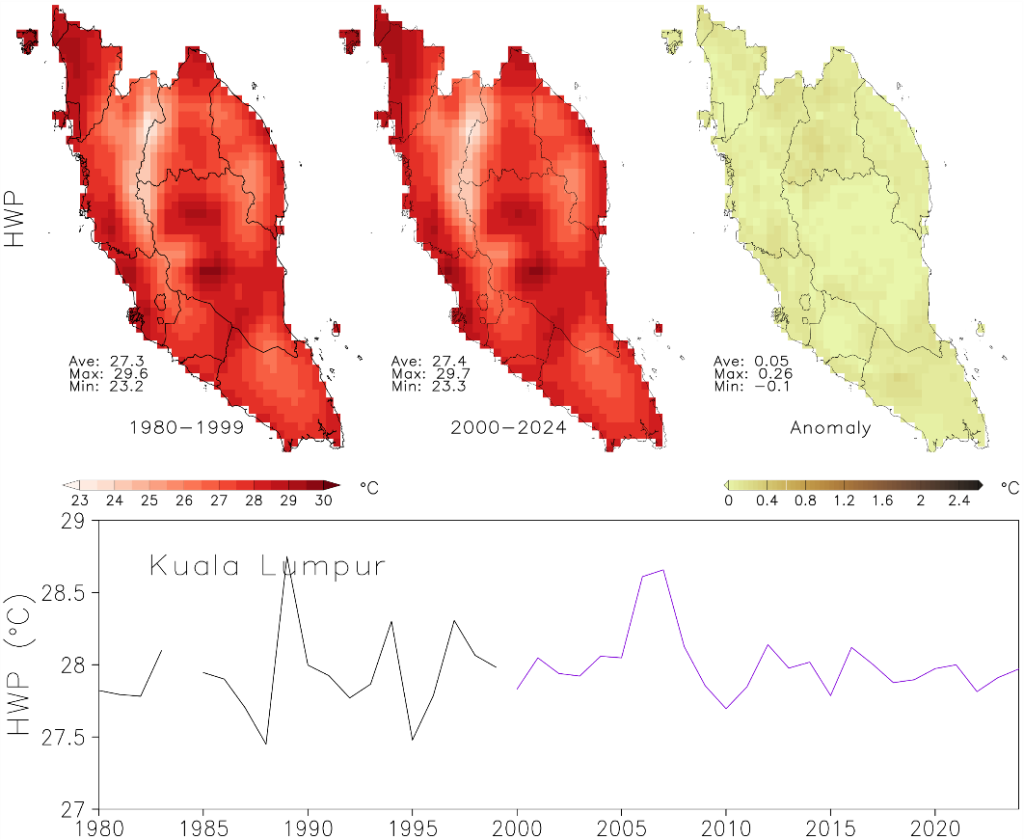
Regarding HWP, spatial patterns indicate only a slight increase in the maximum temperature reached during heatwaves over the past four decades (Figure 17). The mean HWP rose marginally from 27.3 °C in 1980–1999 to 27.4 °C in 2000–2024, with maxima around 29.6–29.7 °C and minima near 23 °C for both periods. The anomaly map confirms this stability, showing generally weak positive differences—mostly within ±0.3 °C and locally up to 0.26 °C—suggesting that while heatwaves have become more frequent and longer (as seen in other indicators), their peak intensity has changed very little. The time series for Kuala Lumpur supports this finding. From 1980 to 2024, HWP fluctuates between 27 °C and 29 °C, with no pronounced upward trend. Occasional peaks around 1990 and 2005–2010 reflect episodic extreme years rather than a consistent rise. Despite this relative stability in peak temperature, these values still coincide with notable increases in heatwave duration and frequency, indicating that heatwaves are lasting longer and occurring more often, even if their maximum temperatures remain similar. The result suggests that the severity of heatwaves in terms of peak temperature has remained nearly constant, while other dimensions—frequency, duration and intensity—have intensified. This pattern implies that the region’s growing heat risk stems less from higher absolute temperatures and more from the persistence and recurrence of extreme heat conditions.
4. Discussions
The daytime and nighttime UHI intensities observed in this study are consistent with previous research conducted in Kuala Lumpur (Aghamohammadi et al., 2021; Elsayed, 2012; Syed Mahbar & Kusaka, 2024). The higher daytime UHI intensity can be attributed to increased solar radiation, surface heat absorption and anthropogenic heat emissions. In tropical cities, high solar intensity and humid climatic conditions can further amplify urban heat accumulation by increasing surface heating and limiting evaporative cooling (Aghamohammadi et al., 2021). Urban materials such as concrete and asphalt possess high thermal capacity and low albedo, allowing them to absorb and re-radiate substantial amounts of incoming solar energy during the day (Ryu & Baik, 2012). Moreover, a previous study in Southeast Asia demonstrated that rapid urban expansion across this region has increased impervious surface coverage while reducing natural cooling mechanisms provided by vegetation, further intensifying daytime thermal contrasts between urban and rural environments (Aghamohammadi et al., 2021; Kurniati & Nitivattananon, 2016; Putra et al., 2021). Although nighttime UHI is commonly associated with the slow release of stored heat from urban surfaces and reduced nocturnal cooling, the daytime effects are amplified by ongoing human activity and solar input (Nyuk-Hien & Yu, 2007; Ryu & Baik, 2012). Therefore, the observed daytime-dominant UHI pattern in Kuala Lumpur reflects the combined effects of tropical climate conditions and urban land-surface modification. The consistency of the observed UHI intensities with previous studies, together with the validation of the WRF simulations against MODIS land surface temperature observations, provides confidence in the reliability of the reported UHI magnitudes. Among the tested configurations, the localised LCZ parameterisation (LCZ_local) achieved the lowest RMSE and the highest overall agreement with the satellite observations.
Analysis across LCZs revealed that UHI intensity is notably higher in urban LCZs, particularly compact built-up zones (LCZ 1–3). This can be explained by the predominance of impervious materials, which exhibit distinct thermal properties, including higher heat storage capacity and lower albedo (Wonorahardjo et al., 2020). Additionally, the limited vegetation cover, reduced shading and high building density in these areas hinder evapotranspiration and restrict air circulation, thereby amplifying heat retention. Conversely, non-urban LCZs exhibited substantially lower UHI intensity due to abundant vegetation and shading, which promote surface cooling through evapotranspiration (Wang et al., 2023). Moreover, surfaces such as bare rock or light-coloured paving in non-urban zones often have higher albedo than asphalt or concrete in built-up areas, thereby reflecting a greater proportion of incoming solar radiation and reducing heat absorption (Elgendy et al., 2025). Additionally, long-term land use transformations have been shown to significantly influence LST patterns, where expansion of built-up areas and reduction of vegetation cover contribute to increased surface temperatures, while green and water surfaces provide cooling effects (Pandey et al., 2023a, 2023b). Such relationships demonstrate the importance of considering land surface characteristics when assessing UHI dynamics.
The UHI effect was also found to intensify during heatwave periods, with higher UHI magnitudes observed under real heatwave conditions and further amplification projected under a +1 °C heatwave scenario. This pattern indicates that extreme heat exacerbates existing urban–rural temperature contrasts, reinforcing the compounding effects of heatwaves and UHI. The concurrent increase in both observed and simulated UHI intensity highlights the vulnerability of densely built urban areas to future warming, where even moderate temperature increments can lead to disproportionately higher heat exposure. The heatwave analysis further revealed that the frequency, intensity and duration of heatwave events are likely to increase in Kuala Lumpur over the coming decades.
These trends emphasise the urgency of integrating scientific evidence into local climate adaptation strategies. Strengthening science–policy collaboration through structured dialogues, technical workshops and targeted policy briefings can facilitate the translation of research findings into effective urban heat mitigation measures. Community engagement is also important for strengthening climate resilience, particularly through initiatives that increase awareness of urban heat risks and encourage locally appropriate adaptation measures. Citizen science campaigns using low-cost temperature sensors and mobile applications could support the monitoring of local microclimates and help identify UHI hotspots. Similarly, community-led greening initiatives, including urban gardens, rooftop greenery and tree-planting programmes, could help reduce heat exposure and improve thermal comfort. Collectively, these approaches can strengthen the translation of scientific evidence into practical and locally responsive urban heat adaptation strategies.
5. CONCLUSION
This study demonstrates how advanced scientific methods combining satellite-based UHI mapping, LCZ classification and climate modelling can be translated into practical urban management strategies. The integrated approach provided a comprehensive assessment of UHI intensity, its variation across LCZ classes, diurnal behaviour and interaction with heatwave conditions in Kuala Lumpur. By integrating spatial analysis with stakeholder engagement, the research bridges the gap between science and policy, supporting climate adaptation planning in rapidly urbanising tropical cities such as Kuala Lumpur.
The findings show that UHI intensity is substantially stronger during the daytime (≈3.6 °C) than at night (≈0.9 °C), peaking at about 6.9 °C in the early morning (06:00–07:00), highlighting persistent urban–rural thermal contrasts under tropical conditions. UHI intensity also varies significantly across LCZ classes, with compact built-up areas (LCZ 1–3) consistently exhibiting the highest values due to dense morphology, high imperviousness and limited vegetation. These results highlight the potential of LCZ-informed strategies in urban zoning, green infrastructure and building design to reduce thermal exposure. Among the WRF configurations tested, the LCZ_local parameterisation showed the best agreement with MODIS land surface temperature, demonstrating the importance of incorporating realistic urban morphology in climate modelling. The heatwave analysis further revealed increases in heatwave intensity, duration and frequency across Peninsular Malaysia, while peak temperatures remained relatively stable. In Kuala Lumpur, the increasing frequency of heatwaves provides important context for understanding how prolonged extreme heat can compound urban thermal stress. Collectively, these findings demonstrate that integrating remote sensing, LCZ-based urban characterisation and climate modelling improves understanding of urban heat dynamics in tropical cities and provides a strong evidence base for targeted heat mitigation and climate adaptation planning.
Nonetheless, this study is subject to limitations associated with the availability of fine-scale spatial data, particularly for detailed urban morphology, building characteristics and ground-based observations, which may influence the representation of localised thermal variations within the urban environment. Future research should extend the current modelling framework by evaluating UHI responses under +1.5 °C and +2.0 °C global warming scenarios, consistent with the Paris Agreement targets. Such analyses would provide a more comprehensive assessment of urban heat risks under progressively warmer climates, enabling policymakers to identify adaptation thresholds, prioritise mitigation strategies and develop evidence-based planning measures for long-term urban resilience. By linking observed UHI patterns, urban morphology, climate modelling and heatwave characteristics, this study provides a transferable framework for assessing compound urban heat risks in rapidly urbanising tropical cities.
6. Acknowledgements
The authors gratefully acknowledge the financial support provided by the Asia-Pacific Network for Global Change Research (APN) under Grant No. CRRP2024-08SY-Wan for this study. We extend our sincere appreciation to all collaborators and researchers for their invaluable contributions, dedication and continuous feedback throughout this research. Special thanks are also extended to the Institute of Climate Change, National University of Malaysia (UKM) and the Hanoi University of Mining and Geology, Vietnam, for providing access to their computational facilities and workspace, which enabled parts of the data processing and analysis presented in this paper.