
Flood dynamics in the Vietnamese Mekong Delta from Earth observations
Keywords
Flood dynamics · Google Earth Engine · MODIS · Remote sensing · VMD
HIGHLIGHTS
- Flooding in the VMD has decreased due to various drivers.
- MODIS is effective for large-scale, long-term flood assessment.
- The false sense of security should be avoided, as future floods can be more extreme.
1. INTRODUCTION
Flooding is one of the deadliest disasters on Earth (Husein et al., 2025). It affects both developed and developing countries on almost all continents. While flash floods cause the greatest flood-related mortality in developed countries, other types of floods (such as fluvial, pluvial, and storm-related floods) cause destructive damage to developing countries (Saber et al., 2023). Natural processes, especially climate change, and human activities, such as deforestation and urbanisation, are the main drivers of flooding, largely through intensifying rainfall intensity and increasing the runoff coefficient in the catchment (Hamidi et al., 2025). In developing countries, such as Vietnam, flooding is an annual recurring event, driven by typhoons, tropical depressions, and extreme seasonal monsoonal rainfall. People who live in the Red River Delta, the Vietnamese Mekong Delta (VMD), and the Central coastal regions of Vietnam are mostly affected by flooding.
The VMD is a vital agricultural and aquaculture region of Vietnam, characterised by its dense river and canal system, alongside an extensive network of low and high dykes. This region heavily relies on water resources from the Mekong River. Annual floods are a key factor, offering numerous benefits by connecting the main rivers with their floodplains, providing essential sediment, creating favourable conditions for fish migration, and maintaining the region’s unique ecosystem (Hung et al., 2014b; Thanh et al., 2020). However, flooding also has several adverse effects on both humans and the environment. It can cause deep inundation in agricultural fields, leading to reduced income for farmers.
Additionally, floodwaters can spread pathogens to humans and animals, threatening public health and damaging ecosystems (Phung et al., 2016). To safeguard people and agricultural activities, dyke systems have been constructed, especially in An Giang and Dong Thap Provinces, since 2000. By 2011, the area of high dykes in An Giang and Dong Thap had expanded to 1431 km2 and 990 km2, respectively (Thanh et al., 2020).
While dyke systems, especially high-dyke systems with crest elevations of approximately 4 m above mean sea level, have positive effects, they also fragment flood regimes in the region. Particularly, floodwaters that cannot enter the dyke systems tend to concentrate in adjacent areas, raising peak river water levels (Duc Tran et al., 2018). High-dyke development in the upper VMD, particularly in Long Xuyen Quadrangle (LXQ) and Plain of Reeds (PoR), has likely increased flood peaks by 9–13 cm and extended flood duration by 15 days in the central VMD (e.g., in Can Tho and Vinh Long) (Triet et al., 2017). The situation is further complicated by irregular upstream reservoir operations and the unpredictable impacts of climate change in the Mekong basin. While examining the spatiotemporal flood dynamics in the VMD is crucial, the limited number of hydrological monitoring stations makes it difficult to capture the full scope of flood behaviour. To overcome these data limitations, remote sensing provides an essential tool for large-scale, long-term assessments of flood dynamics in the VMD.
Many studies have examined flooding in the VMD. Duc Tran et al. (2018) concluded, using a one-dimensional (1-D) hydrodynamic model with a quasi-two-dimensional (2-D) approach via Mike 11 software, that water levels in the upper reaches have increased. In contrast, downstream water levels have remained relatively unchanged. Dang et al. (2016) reported an overall decrease in the percentage of the maximum inundated area in the VMD from 2013 to 2016, using measured water-level data and remote sensing. Specifically, the flooded extent of the LXQ decreased from 65% in 2000 to 29% in 2013, and from 62% to 41% in the PoR during the same period. Hoang et al. (2019) reported a significant increase in dry-season flows, while rainy-season flows decreased, using a distributed hydrological model (i.e., VMod). Binh et al. (2021) also documented a reduction in flood-season flow and an increase in dry-season flow in the VMD, attributing these changes to upstream dam development using statistical analyses. Most previous studies have primarily relied on mathematical models or statistical analyses to examine flooding. These models often require large amounts of input data and make many assumptions, leading to high uncertainty in the results when high-quality data are unavailable. Moreover, the simulations are time-consuming and resource-intensive, requiring significant human and computational resources. Alternatively, remote sensing can track spatiotemporal flood dynamics at large scales, perform rapid calculations with high accuracy and require less input data. These advantages make remote sensing a promising tool for this study.
Satellite-based remote sensing has become widely used in flood studies worldwide, particularly in data-scarce regions (Munasinghe et al., 2018). Varma et al. (2025) employed remote sensing, geographic information systems (GIS), and the analytic hierarchy process (AHP) to classify flood hazard zones along the Bhagirathi River, thereby aiding effective rescue operations. A similar approach, combining remote sensing with GIS and AHP for flood hazard and risk zoning, was used in Ziway Lake, Ethiopia (Husein et al., 2025). Liu (2025) estimated flood area in Hebei Province, China, in 2023 using SAR remote sensing with high accuracy, demonstrating its effectiveness in monitoring and evaluating flood disaster impacts. Zafar et al. (2024) used the Sentinel-1 satellite data to examine the damage from the 2022 flood on infrastructure and cropland in Sindh Province, Pakistan, identifying heavy rainfalls, extreme temperatures, strong glacial melting, and poor governance as key drivers of intensifying flooding. Hamidi et al. (2025) developed an app on Google Earth Engine (GEE) that combines optical and SAR satellite data for near-real-time global flood mapping, helping to popularise the use of remote sensing in flood studies.
Several studies have applied remote sensing to flood monitoring and assessment in the VMD. Dang et al. (2016) combined statistical analysis of water levels with MODIS satellite data to examine flood dynamics from 2000 to 2013. They revealed that Cambodian floodplains can buffer the effects of upstream dams in the Mekong basin. At the same time, flood prevention systems in the VMD may accelerate the rise and fall rates of water levels in the upper VMD and increase water levels in the central delta. Fayne et al. (2017) used MODIS imagery to observe floods in the lower VMD from 2003 to 2015. They demonstrated that the percentage-change method used in the near-real-time NASA flood extent product (NASA-FEP) is effective for flood mapping compared with other change-detection methods. Kuenzer et al. (2013) employed 60 Envisat-ASAR-WSM scenes to characterise the flood regime from 2007 to 2011 and examined how dyke systems and land use shape flood occurrence patterns. Nghia et al. (2022) used Sentinel-1 imagery to assess flooding from 2015 to 2020 and identified a gradual shift in flooding from upstream to downstream provinces. Dinh et al. (2019) combined Sentinel-1, Sentinel-2, and Landsat-8 data to map water masks at a 10-day temporal and 10-m spatial resolutions for 2016–2017, finding less flooding in the coastal provinces of the VMD. Tran et al. (2022) employed Sentinel-1 SAR time series with dynamic Otsu thresholding to monitor floods in An Giang Province from 2017 to 2018, showing that surface water maps generated from Sentinel-1 agree well with those from the Sentinel-2 multispectral instrument using static Otsu thresholding. Lam et al. (2023) integrated machine learning models with Sentinel-1 data to map flooded areas for 2019 and 2020, revealing that 53–58% of rice fields and 9–14% of built-up areas were affected by floods in those years.
While several studies have used remote sensing to monitor and assess flooding in the VMD, two research gaps remain. First, studies using the MODIS satellite for examining flood dynamics of the entire VMD covered short periods, ending in 2013 or 2015. Second, while studies covering recent years (2015–2020) provided high spatial resolution using Sentinel-1, Sentinel-2, and Landsat-8 data, they focused on small regions of the VMD, such as the lower VMD or An Giang Province. Therefore, the present study addresses these research gaps by examining flood dynamics in the entire VMD from 2001 to 2023 using the Terra MOD09A1.061 dataset from the MODIS satellite, bridging the gap between prior MODIS studies and the recent research dominated by higher-resolution remote sensing data.
2. STUDY AREA
The VMD is located in Southwestern Vietnam, downstream of the Mekong River (Figure 1), having an area of approximately 39,000 km2. It is characterised by a dense river network that plays a crucial role in inland waterway transport, sediment delivery, and soil fertility. This makes the region the agricultural centre of Vietnam, especially for rice production. The river network of the VMD consists of the Mekong River’s distributaries, including two primary rivers: the Tien River (250 km) and the Hau River (220 km). These rivers discharge into the East Sea of Vietnam via eight major tributaries: Tieu, Dai, Ba Lai, Ham Luong, Cung Hau, Co Chien, Dinh An, and Tran De (Figure 1).
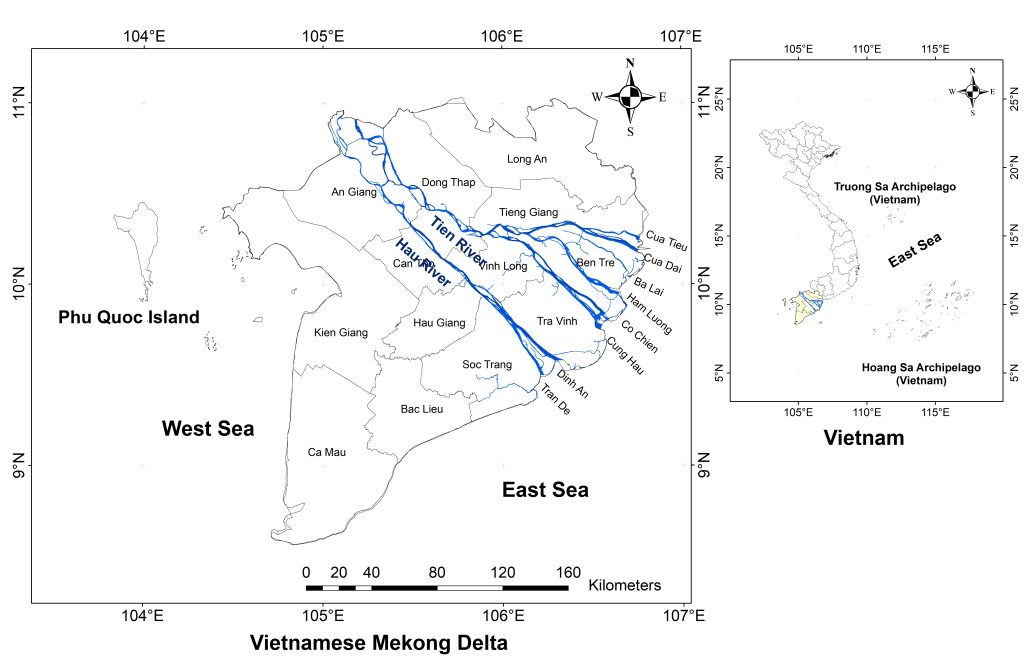
The terrain of the VMD is predominantly flat and characterised by a tropical monsoon climate, with two seasons: a dry season from December to April and a rainy season from May to November (Binh et al., 2021). However, the flood season typically runs from July to December because of the basin’s large area (795,000 km2); rainfall over the basin takes time to become river discharge, as a substantial portion is initially retained within the basin’s geological substrate. The flooded area across the VMD can reach 3–4 million hectares (Quan et al., 2018). With flood depths ranging from 0.5 m to more than 4 m (Long et al., 2022), the delta can be divided into three flooded regions. The heavily flooded area, with water levels higher than 2 m, is located in the upper VMD (An Giang and Dong Thap). The moderately flooded area, with water levels from 1–2 m, is in the central part. The lightly flooded area, with water levels below 1 m, is in the downstream region, where flooding is also affected by tides.
3. DATA AND METHODS
The MODIS Terra MOD09A1.061 product, provided by NASA LP DAAC at the USGS EROS Center (https://lpdaac.usgs.gov/products/mod09a1v061/), provides estimates of surface reflectance of Terra MODIS Bands 1 to 7. MODIS has a large swath coverage, spanning 2330 km across the Earth’s surface, allowing for observation of a vast area. The satellite provides data at a high frequency with an 8-day composite and a spatial resolution of 500 m. The released MODIS imagery was already corrected for atmospheric conditions, such as gases, aerosols, and Rayleigh scattering.
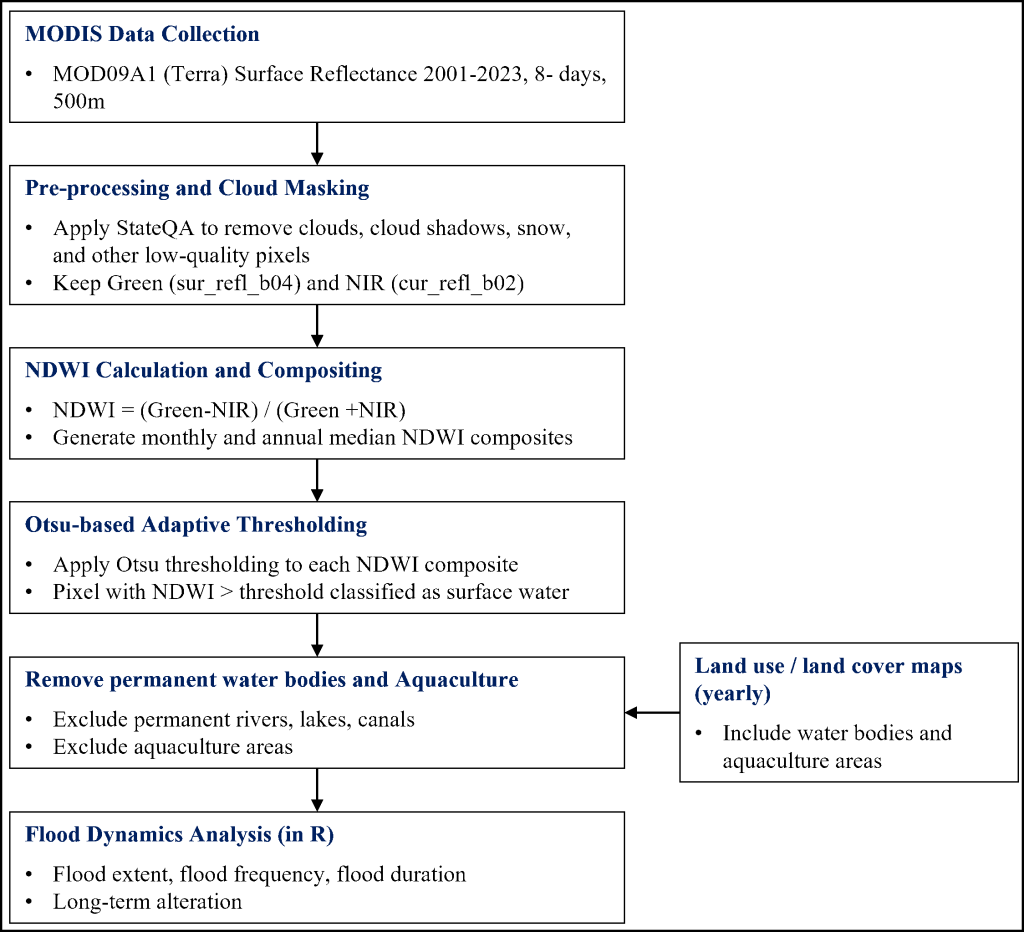
Figure 2 shows the schematic framework of the research methodology. First, we collected MODIS images from the Terra MODIS MOD09A1 dataset from 2001 to 2023, yielding 620 scenes for the study area. We then applied cloud masking to remove low-quality pixels and generate cloud-free composite images. This was accomplished using the StateQA quality assurance band with maskQuality function, where bits 8–13 of the QA band were extracted (getQABits(QA, 8, 13), and only pixels with a code value ≤1 (internalQuality.lte(1)) were retained. This process removed low-quality observations, minimised noise from cloud cover, and produced near cloud-free composites suitable for water classification.
| Month | No. of MODIS composites | Mean cloud-contaminated observations (%) | SD (%) | Range (%) |
|---|---|---|---|---|
| September | 92 | 91.06 | 8.41 | 63.81–99.99 |
| October | 73 | 82.08 | 14.92 | 46.62–100.00 |
| November | 87 | 69.42 | 19.90 | 21.13–99.69 |
| Sep–Nov | 252 | 80.99 | 17.58 | 21.13–100.00 |
To quantify the effect of cloud contamination during the peak flood season, we calculated the proportion of cloud-contaminated MODIS observations from September to November (Table 1). This period was selected because it corresponds to the flood peak in the Vietnamese Mekong Delta. Cloud-contaminated observations were identified from the StateQA layer of MOD09A1 using cloud-related QA flags. The cloud-contaminated proportion was calculated as the ratio of cloud-contaminated pixel observations to the total number of MODIS pixel observations within the study area. Peak-month statistics were then derived from these image-level cloud-contamination proportions. From 2001–2023, cloud-contaminated observations accounted for an average of 80.99% of the MODIS observations during September–November. The highest cloud contamination occurred in September, with an average of 91.06%, followed by October at 82.08% and November at 69.42%.
We calculated the normalised difference water index (NDWI) to classify water surface and other land cover types for flood detection. The NDWI was calculated using the original (McFeeters, 1996) formulation by applying the green band (‘sur_refl_b04’, 545–565 nm) and the near-infrared band (NIR-‘sur_refl_b02’, 841–876 nm), as shown in Equation (1). After cloud and low quality pixels were removed, monthly and annual NDWI composites were generated using the median value of all valid observations within each period. The median (pixel-wise median in GEE) compositing approach was selected because it is less sensitive to extreme values and residual noise than the mean composite. After QA-based cloud masking, residual effects from thin clouds, cloud shadows, haze, atmospheric noise, or unfavourable viewing conditions may still persist, especially during the wet and flood seasons. Median or medoid-based composites are robust against extreme values and can better represent seasonal surface conditions than composites based on maximum index values (Flood, 2013). Therefore, compared with maximum NDWI compositing, the median approach reduces the risk of overestimating flood extent caused by anomalously high NDWI values. In contrast, minimum NDWI compositing may underestimate inundation by selecting the driest observation within the period.
$$\mathrm{NDWI} = \frac{\mathrm{Green} – \mathrm{NIR}}{\mathrm{Green} + \mathrm{NIR}} \tag{1}$$
To detect surface water pixels from non-water pixels, we applied adaptive thresholding rather than a fixed NDWI threshold across all images. Specifically, the Otsu thresholding algorithm was used to determine an optimal NDWI threshold for each monthly and annual composite based on the NDWI histogram. Otsu thresholding selects the threshold that maximises the between-class variance between water and non-water pixels (Otsu, 1979). A pixel was classified as surface water when its NDWI value was greater than the Otsu-derived threshold:
$$\mathit{Surface\ Water}_{m,y}(x) = 1 \quad \text{if} \quad \mathrm{NDWI}_{m,y}(x) > T_{m,y} \tag{2}$$
where T*m,y is the adaptive Otsu threshold estimated for month m and year y. In this study, the Otsu-derived NDWI thresholds for the monthly and annual composites were consistently positive (>0), which is consistent with the general NDWI convention that water pixels typically have higher positive NDWI values than non-water surfaces (Ji et al., 2009).
The initial surface-water maps were further processed to derive flood extent maps. Permanent water bodies and aquaculture areas were removed from the classified surface-water maps using the corresponding yearly land use land cover data. Then, the final flood extent represents temporary inundated areas rather than permanent rivers, canals, lakes, or aquaculture ponds. Trends in flood extent in each pixel were examined using the Mann–Kendall test (Kendall, 1938; Mann, 1945), while the change rate was estimated using the Sen slope method (Sen, 1968). These steps were performed in the R programming language.
Flood duration was estimated from the monthly flood maps. For each year, monthly flood maps were generated for the flood season from July to December. Each monthly map was converted into a binary flood layer, in which flooded pixels were assigned 1 and non-flooded pixels 0. A standardised duration of 30 days was assigned to each month in which a pixel was classified as flooded. Since six flood-season months were considered, the estimated flood duration ranges from 0 to 180 days. For example, a pixel detected as flooded in one month was assigned a flood duration of 30 days, while a pixel detected as flooded in two months was assigned a flood duration of 60 days. It should be noted that this approach does not represent exact daily or event-based inundation duration. Instead, it provides a monthly-scale estimate of flood persistence, which is suitable for assessing long-term spatial and temporal changes in flood retention over the VMD.
4. RESULTS AND DISCUSSION
4.1. Flood frequency and extent
Figure 3 shows the seasonal pattern of flood frequency across the VMD. Floods rarely occurred in June, began to appear from July, gradually increased to a peak in October, and then receded by November. Flood frequency was calculated as the percentage of years in which a pixel was classified as flooded during the study period. Therefore, a flood frequency value of 100% means that flooding occurred at that pixel in every year, whereas a value of 0% means that flooding was not detected at that pixel in any year. Flood frequency increased from July to September, reached its highest persistence in October–November, and then decreased in December. aligning with the regional hydrological cycle. November and October are particularly notable, accounting for 12.15% and 11.33% of the inundated area, respectively, with a 90–100% flood frequency. In September, lower-frequency classes were more dominant, especially the 1–10% and 11–20% classes, with 11.30% and 8.95%, respectively, suggesting the early onset of seasonal flooding. By December, the 90–100% frequency class decreased to only 1.95%, reflecting flood recession. These results indicate that highly recurrent flooding was mainly concentrated in October and November, while flooding in the other months was less persistent and more spatially variable.
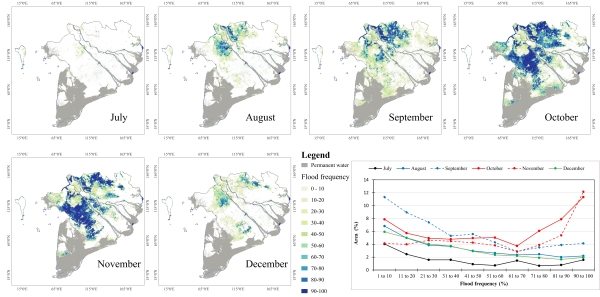
Spatially, Can Tho City, the LXQ, and the PoR exhibited the highest flood frequencies over the study period. These areas are structurally prone to flooding due to their low-lying topography and direct connection to major flood pathways, with an average elevation of about 1 m and a gentle gradient of roughly 1 cm/km from the Hau River to the West Sea of Vietnam. By contrast, the upper parts of An Giang and Dong Thap show much lower flood frequency, largely because they are protected by extensive high-dyke systems for triple-rice cropping farming. Approximately 65% of cultivated land in An Giang and 40% in Dong Thap are protected by high dykes, significantly reducing natural overbank flow into agricultural floodplains (Thanh et al., 2020). These structural modifications have increasingly limited lateral flood propagation into formerly inundated areas.
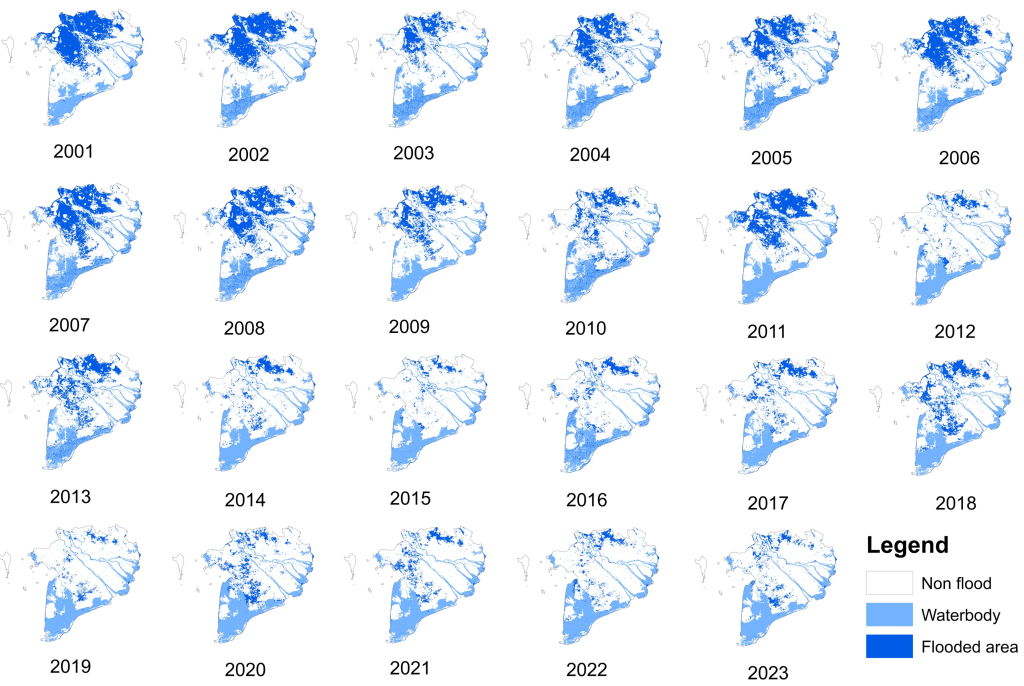
The flood extent results from 2001 to 2023 (Figure 4) further reinforce the long-term declining trend in inundated areas across these yearly flood extent maps, which were generated from annual median NDWI composites after QA-based cloud masking and NDWI thresholding. Flooding has become highly localised, with significant inundation now confined to the upstream region of Dong Thap. In contrast, many areas, especially those protected by high-dyke systems in An Giang and Dong Thap, now experience minimal or no seasonal flooding. This shift reflects a clear reduction in floodplain connectivity, driven by decades of hydraulic infrastructure expansion.
4.2. Long-term changes in flood inundated area
The long-term trend analysis of monthly flooded areas from 2001 to 2023 shows a statistically significant decline in inundation extent across most months of the flood season (Figure 5). Linear regression results indicate slopes ranging from −0.05 to −0.67, reflecting a consistent decreasing trend, with p-values indicating varying levels of statistical significance. Specifically, July shows an insignificant trend (slope = −0.05; p = 0.12), suggesting that early-season flooding has remained relatively stable. However, pronounced and statistically significant reductions are observed from August to November: August (slope = −0.31, p = 0.001); September (slope = −0.44, p = 0.002); October (slope = −0.67, p = 0.002); November (slope = −0.48, p = 0.001). December also shows a moderate but significant decline (slope = −0.15; p = 0.032). These results indicate that the most substantial decreases occur during the flood season, aligning with earlier findings by Dang et al. (2016) that inundation extent in the VMD declined from 2000 to 2013. The strongest decline in October (known as the flood peak month in the VMD) suggests a marked reduction in flooding in the VMD, with an average annual decline of −0.67%. Interannual variability further indicates that, although major flood events still occur (e.g., the exceptional 2011 flood, with roughly 25% of the area inundated in October), they are insufficient to counteract the overall declining trend. This pattern is consistent with large-scale hydrological changes driven by upstream hydropower dam operation and climate-related alterations in monsoon behaviour (Ly et al., 2021).
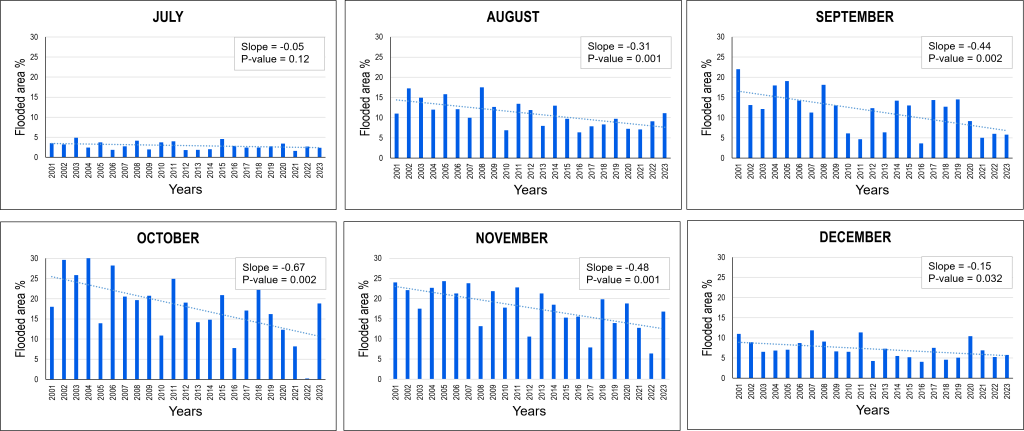
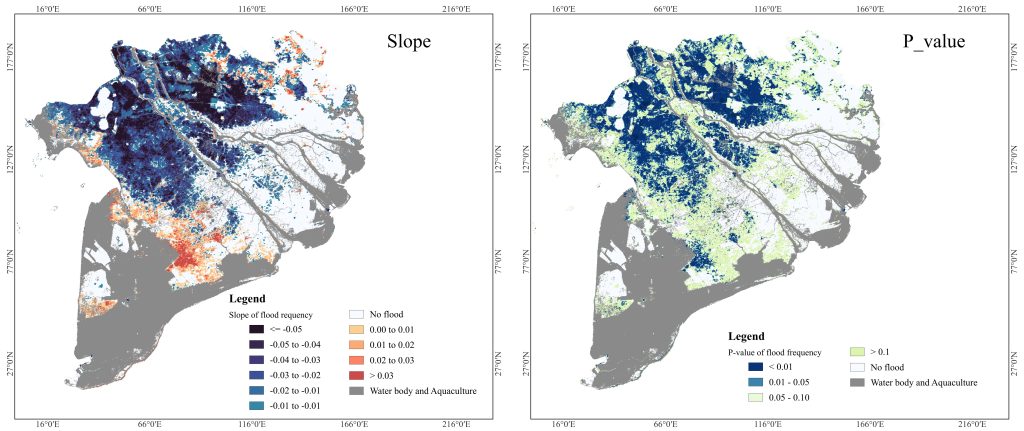
Figure 6 presents the spatial distribution of the slope and statistical significance of changes in flood frequency across VMD from 2001 to 2023. The slope values, estimated using linear regression, indicate the annual rate of change in flood frequency, while the p-value map shows the significance level of these trends. The results show a clear downward trend in flood distribution in the area. Negative slope values are widely distributed in the main flood-prone areas, particularly in the upper and central parts of the delta, including the LXQ and the PoR. These areas show relatively strong negative trends, indicating that floods have occurred less frequently over the past two decades. The decline is especially clear in areas where statistically significant trends are observed, with many pixels showing p-values below 0.05. Positive slope values are scattered and occur only in smaller areas, mainly along transitional and downstream zones. However, these increasing trends are spatially fragmented and generally less dominant than the decreasing trends. In many of these areas, the p-values are greater than 0.10, suggesting that the observed increases are not statistically significant.
One of the major drivers of the decline in flood extent is the expansion of high-dyke systems, implemented intensively after the extreme flood in 2000. High and closed dyke systems in An Giang and Dong Thap Provinces have progressively disconnected natural floodplains from the main rivers, thereby reducing the propagation of floods into the upper VMD (Thanh et al., 2020). In addition, hydropower dams and reservoir operations in the upstream of the Mekong River have altered the flow regimes of the VMD. Recent studies found that dry-season flows have increased, while rainy-season flows have decreased due to reservoir operation and controlled release schedules (Binh et al., 2020). These hydrological changes reduce the flood discharge reaching the delta, consistent with the negative slopes in the results. The decline in flooded areas in September and October indicates that the “flood pulse” is weakening. This has major negative implications for sediment delivery, agricultural productivity, fisheries, and ecological functions of floodplains (Horton et al., 2022; Manh et al., 2015), as reduced flooding threatens the natural replenishment cycles on which the delta depends.
Although the observed flood extent and frequency show a declining tendency during 2001–2023, this trend should not be interpreted as a permanent reduction in future flood risk. Future flooding in the VMD will likely be shaped by the combined effects of climate change, upstream hydropower development, reservoir operations, and continued floodplain modification. Climate-related changes in monsoon rainfall may increase the variability and intensity of extreme flood events, while upstream dams and reservoir regulation can further alter flood timing, magnitude, and seasonal flow distribution (Hoang et al., 2019; Ly et al., 2021). In addition, high-dyke development may reduce inundation locally in protected areas but can shift floodwater toward adjacent or downstream regions, increasing flood peaks and prolonging inundation in some locations (Thanh et al., 2020; Triet et al., 2017). Therefore, the recent reduction in observed flood extent should not create a false sense of security. Flood management in the VMD should remain adaptive, accounting for both declining regular flood pulses and the possibility of future extreme flood events.
4.3. Spatiotemporal distribution of flood duration
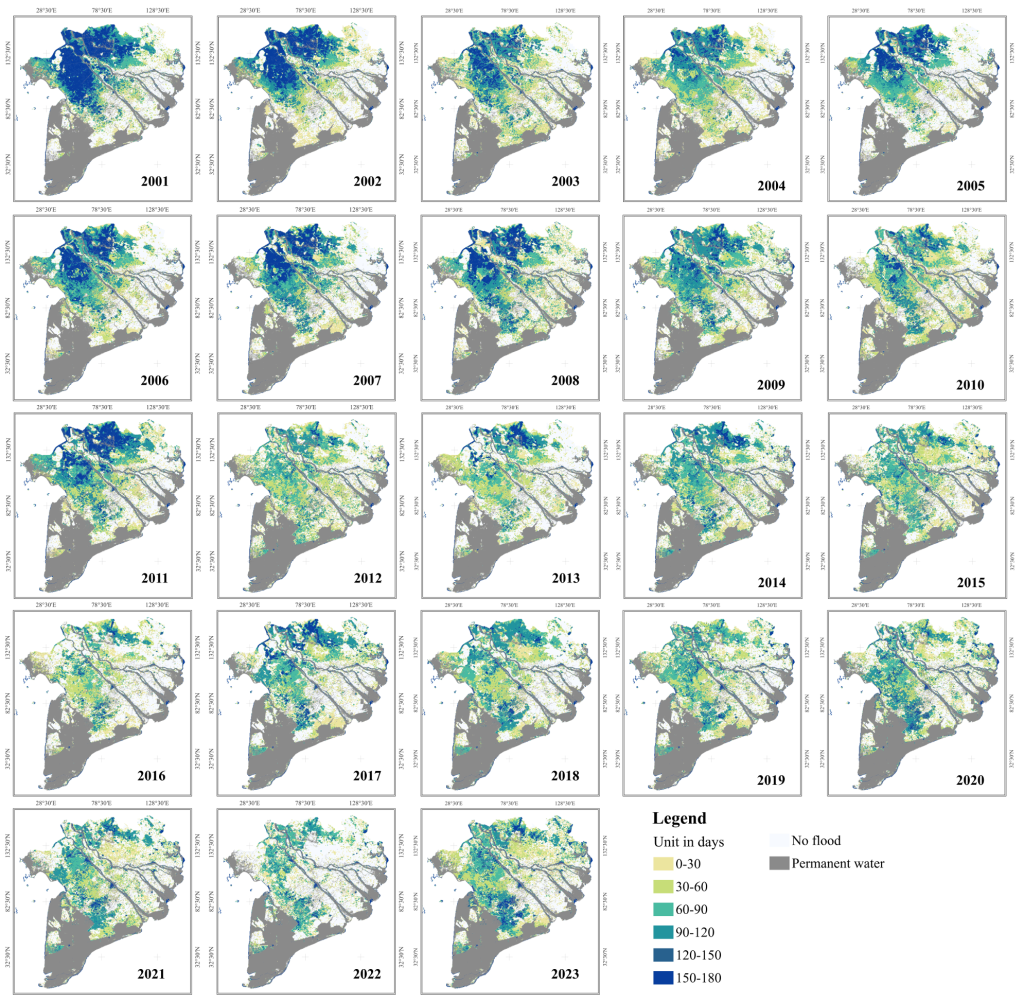
Figure 7 presents the spatiotemporal changes in flood duration across the VMD from 2001 to 23. The results show a gradual decrease in the number of flooded days, with the most pronounced reductions occurring in upstream provinces, including Dong Thap, An Giang, and parts of Can Tho. From 2001 to 2005, large areas in these provinces experienced flood durations of 120–150 days or more. By contrast, from 2012 to 2018, most areas recorded only 60–90 days of inundation, and in some regions, flood duration fell below 60 days. In the later years, particularly from 2016 to 2022, long-duration flooding was largely reduced, and most flooded areas were characterised by short- to moderate-duration inundation of 30–90 days. Notably, 2016 experienced the shortest flood duration, as it was the most severe drought over the past 100 years (Loc et al., 2021). Although some recovery of flood duration was observed in 2017, 2019, and 2023, these flooded areas were generally less continuous and less extensive than those observed in the early 2000s. Flood duration has also changed at both provincial and regional scales. In 2001, Dong Thap, An Giang, Can Tho, and Vinh Long Provinces experienced floods lasting more than 90 days. By 2018, however, a small part of Vinh Long still recorded flood durations of around 90 days. Substantial reductions in flood duration can be attributed to dam construction in the Mekong basin and the expansion of dyke systems (Binh et al., 2020; Triet et al., 2017). The upstream VMD once functioned as a major natural flood-retention zone. However, the development of high-closed-dyke systems, particularly in areas for intensive triple rice cropping, has dramatically reduced inflow volumes into the paddy fields, thus shortening flood retention time.
These findings highlight the potential value of managed seasonal flood retention in selected floodplain areas as part of a more flexible flood management strategy. The results show that flood extent, frequency, and duration have declined markedly in the upper VMD, where high-dyke systems have disconnected former floodplains from river flows. This decline indicates a weakening of the seasonal flood pulse, which may reduce sediment deposition, nutrient replenishment, groundwater recharge, fisheries habitat, and other floodplain ecosystem functions. Therefore, flood reintroduction should be understood as the managed or controlled seasonal flood retention in suitable floodplain areas, rather than uncontrolled flooding. Such an approach could help restore part of the natural floodplain functions while maintaining protection for settlements and high-value agricultural areas.
These changes in flood duration and retention time pose potential challenges for sediment deposition, groundwater recharge, and agricultural sustainability (Chapman et al., 2016; Doble et al., 2012; Hung et al., 2014a). Long-duration floods have traditionally been crucial for delivering nutrient-rich sediment to agricultural lands and for maintaining ecosystem function and biodiversity, especially in flood-dependent habitats (Manh et al., 2014, 2015). However, reduced flood duration leads to lower sediment accretion, contributing to soil nutrient depletion and increasing reliance on fertilisers in intensive rice-production areas (Duc Tran et al., 2023; Kondolf et al., 2018).
4.4. Validation of flood maps using water-level gauge records
To provide an independent hydrological consistency check for the MODIS-derived flood maps, observed daily mean water levels at three representative hydrological stations (Tan Chau, Chau Doc, and Can Tho) were analysed during the flood season (July to December) for 2001–2021 (Figure 8). The daily data were aggregated into annual mean water levels, and long-term trends were assessed using Sen’s slope and the Mann–Kendall test. The results show a clear decreasing trend in mean flood-season water levels at the two upstream stations, Tan Chau and Chau Doc. At Tan Chau, the mean water level decreased significantly, with a Sen’s slope of −8.87 cm/year and a Mann–Kendall p-value of < 0.001. Similarly, Chau Doc showed a significant decreasing trend, with a Sen’s slope of −6.79 cm/year and a p-value of 0.002. These statistically significant reductions indicate a long-term decline in flood magnitude in the upstream part of the VMD.
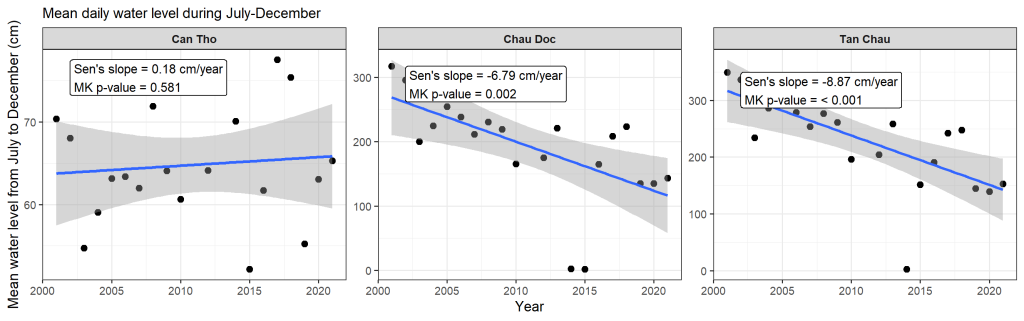
In contrast, Can Tho station, located in the downstream region, showed a slight increasing trend, with a Sen’s slope of 0.18 cm/year. However, this trend was not statistically significant, as indicated by the Mann–Kendall p-value of 0.581. This suggests that no clear long-term change in mean flood-season water level was detected at Can Tho during the study period. The different trend at Can Tho may be related to downstream hydrodynamic conditions, tidal influence, and local water-level regulation.
4.5. Limitations of the study
The MODIS Terra MOD09A1.061 product offers several advantages, such as high frequency and large-scale coverage, but it also has limitations in detecting flood inundation. First, with a spatial resolution of 500 m, MOD09A1 is not the best product for detecting flood dynamics in smaller flood areas with complex river and canal networks. Second, with an 8-day composite, MOD09A1 cannot capture rapidly fluctuating or flash floods in steep areas. Finally, while MOD09A1 is atmospherically corrected, excessive cloud cover or adverse weather conditions during the rainy season can degrade image quality and accuracy, making it difficult to detect flood extent and affect flood classification accuracy.
Despite these limitations, MODIS is well-suited for long-term studies over large areas. In this study, the MODIS-derived flood patterns were qualitatively consistent with observed water level records at key hydrological stations, supporting the reliability of the detected long-term flood changes. For smaller study areas or more detailed flood mapping, future studies should consider using higher-resolution datasets such as Sentinel-1, Sentinel-2, or Landsat.
5. CONCLUSION
This study assessed flood dynamics in the VMD from 2001 to 2023 using MODIS imagery in the GEE platform. The results show that high flood frequency was observed in the LXQ and the PoR, particularly in An Giang and Dong Thap provinces, where most of the land is used for double- and triple-rice cropping annually. Flood extent, frequency, and duration generally declined over the study period. Flood extent in the area has gradually decreased, particularly pronounced during peak flood months, for example, from 21.4% in September 2001 to 5.7% in September 2023, while long-duration flooding has also become less extensive in recent years. These changes were most evident in the upper VMD, where extensive high-dyke systems have increasingly disconnected former floodplains from seasonal river flows. The maximum flood duration also decreased, from more than 120 days in 2001 to just over 60 days in 2018.
The declining flood pattern was consistent with observed water-level trends at key hydrological stations. In particular, significant decreases in flood-season water levels at Tan Chau and Chau Doc support the detected reduction in flood magnitude in the upstream VMD, while the non-significant trend at Can Tho reflects more complex downstream hydrodynamic and tidal influences. This consistency strengthens confidence in the long-term changes identified from the satellite-based flood maps.
This study provides a view of the long-term evolution (from 2001 to 2023) of flood extent, duration, distribution, and frequency across the VMD, offering useful insights for policies aimed at modifying and developing hydrological infrastructure. It also supports the reintroduction of floods to their natural floodplains, bringing fertile sediment and natural fisheries, and contributing to the development of agriculture and aquaculture in the VMD. Although regular flooding has declined, this should not be interpreted as a permanent reduction in flood risk, as future floods may still be affected by climate change, upstream hydropower operations, and continued floodplain modification.
6. ACKNOWLEDGEMENTS
This article is based on work supported by the Asia-Pacific Network for Global Change Research (APN) under Grant No. CRRP2023-04MY-Doan Van (Funder ID: https://doi.org/10.13039/100005536).