
Seasonal and climate-related variations in norovirus and PMMoV detection in Vietnamese oysters
HIGHLIGHTS
- In oysters, norovirus GI was detected at a significantly higher rate than GII (45.4% vs 35.4%; p = 0.032).
- Norovirus detection rates were marginally higher in the dry season than in the wet season, but the difference was not statistically significant (GI: p = 0.240; GII: p = 0.627).
- Significant inter-annual differences in norovirus detection were observed in the dry season (GI: p = 0.008; GII: p < 0.001), with markedly lower detection in 2020, which may be linked to COVID-19 restrictions.
- PMMoV, a faecal contamination marker, did not correlate with norovirus detection in oysters, suggesting it may not be a reliable proxy for norovirus risk in this tropical setting.
- Continuous environmental monitoring is essential to protect public health and seafood safety.
1. INTRODUCTION
Norovirus is a member of the Caliciviridae family and is the predominant cause of acute gastroenteritis. Norovirus leads to 19–21 million cases, 109,000 hospitalisations and 900 deaths annually in the United States, primarily in young children and the elderly (United States Centers for Disease Control and Prevention, 2024). According to a meta-analysis, 17% of patients with acute gastroenteritis in developing countries had norovirus (Nguyen et al., 2017). There are seven norovirus genogroups (GI-GVII), under which there are over 38 genotypes (Verhoef et al., 2015; Vinjé, 2015). Norovirus GII is the most prevalent genogroup globally, contributing to human infections as well as GI and GIV (Medici et al., 2015; Zheng et al., 2006). Genogroup II genotype 4 has been the leading cause of norovirus-associated outbreaks globally in the past decade (Pu et al., 2016). Furthermore, the number of norovirus illness cases could increase by 50% when there is a new strain (United States Centers for Disease Control and Prevention), while diverse norovirus genotypes, including variants, keep being detected in sewage, oyster and human faeces (Pu et al., 2016).
The number of gastroenteritis cases is reported to be higher in winter in temperate regions, although norovirus presents a broader monthly distribution (Sandmann et al., 2017; Tseng et al., 2011). Numerous studies have investigated norovirus-associated outbreaks, observing higher concentrations of the virus in wastewater and increased patient outbreaks during winter months (Haramoto et al., 2006; Victoria et al., 2010). Pathogen seasonality, defined as the occurrence of repeated epidemics at specific times of the year (Dowell, 2001), has been well-documented in temperate climates with distinct seasons. However, most research on norovirus seasonality has been conducted in temperate regions and evidence from tropical settings remains limited. In tropical climates, distinct wet and dry seasons characterise the annual climate cycle, and the relationship between seasonal rainfall patterns and viral prevalence in shellfish remains poorly understood.
Known for its remarkable stability and resistance to environmental stresses and water treatment processes, norovirus is a persistent challenge in clinical and environmental settings, with its prevalence being a crucial public health issue (de Graaf et al., 2016), especially in developing countries like Vietnam, where wastewater treatment infrastructure is limited and shellfish are widely consumed raw.
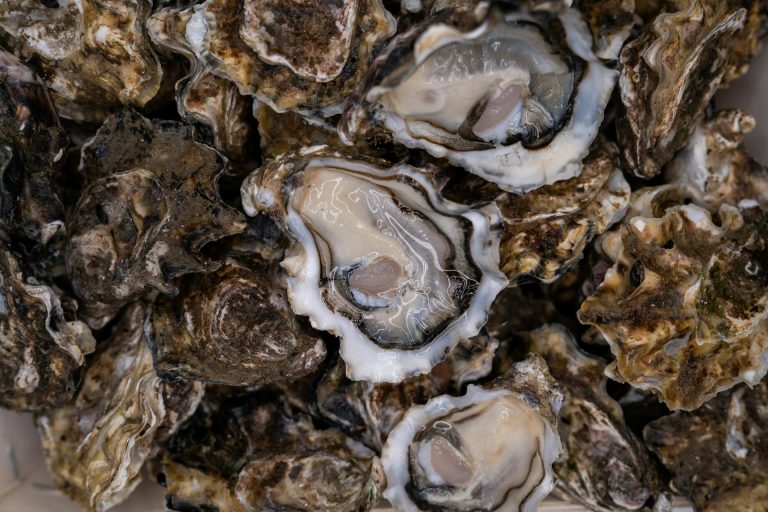
Norovirus ingestion through the food pathway remains a significant public health concern. Oysters, a commonly consumed raw shellfish worldwide, can accumulate pathogens when cultivated in sewage-contaminated waters. Raw oyster consumption is a traditional practice in many coastal communities in Vietnam and other Asian countries (Nguyen et al., 2012). The consumption of norovirus-contaminated oysters is one of the main pathways of norovirus transmission and a primary route of gastroenteritis (Flannery et al., 2012), and is also considered a catalyst for norovirus epidemics, as human-to-human transmission (secondary infection) accelerates the rapid spread.
Because direct measurement of patients’ faeces faces challenges in sample collection and analysis, wastewater-based epidemiology (WBE) has emerged as an alternative for studying viral prevalence in populations, yet it is less feasible in areas with limited resources or undefined sewerage systems; in Vietnam, although about 60% of urban households are connected to a public sewerage network, only 10% of wastewater is actually treated (World Bank, 2014), severely limiting the coverage of conventional WBE. Therefore, environmental surveillance, particularly through oyster monitoring, emerges as a viable method for gathering epidemiological data on disease spread and assessing potential risks to human health. Where WBE coverage is incomplete, oysters function as natural concentrators of human enteric viruses: human-norovirus GI in particular is selectively bioaccumulated in oyster digestive tissue via specific carbohydrate ligands, reaching detectable concentrations even when source-water levels would otherwise fall below qPCR limits (Le Guyader et al., 2011).
In this study, we aim to utilise oyster surveillance to investigate the epidemiology of norovirus GI and GII prevalence between March 2019 and October 2021 in a tropical climate, specifically examining potential climate impacts on norovirus prevalence in Hue City, Vietnam. Additionally, we assess the suitability of Pepper Mild Mottle Virus (PMMoV) as a potential viral indicator for detecting virus contamination.
2. METHODOLOGY
2.1. Sampling location and collection
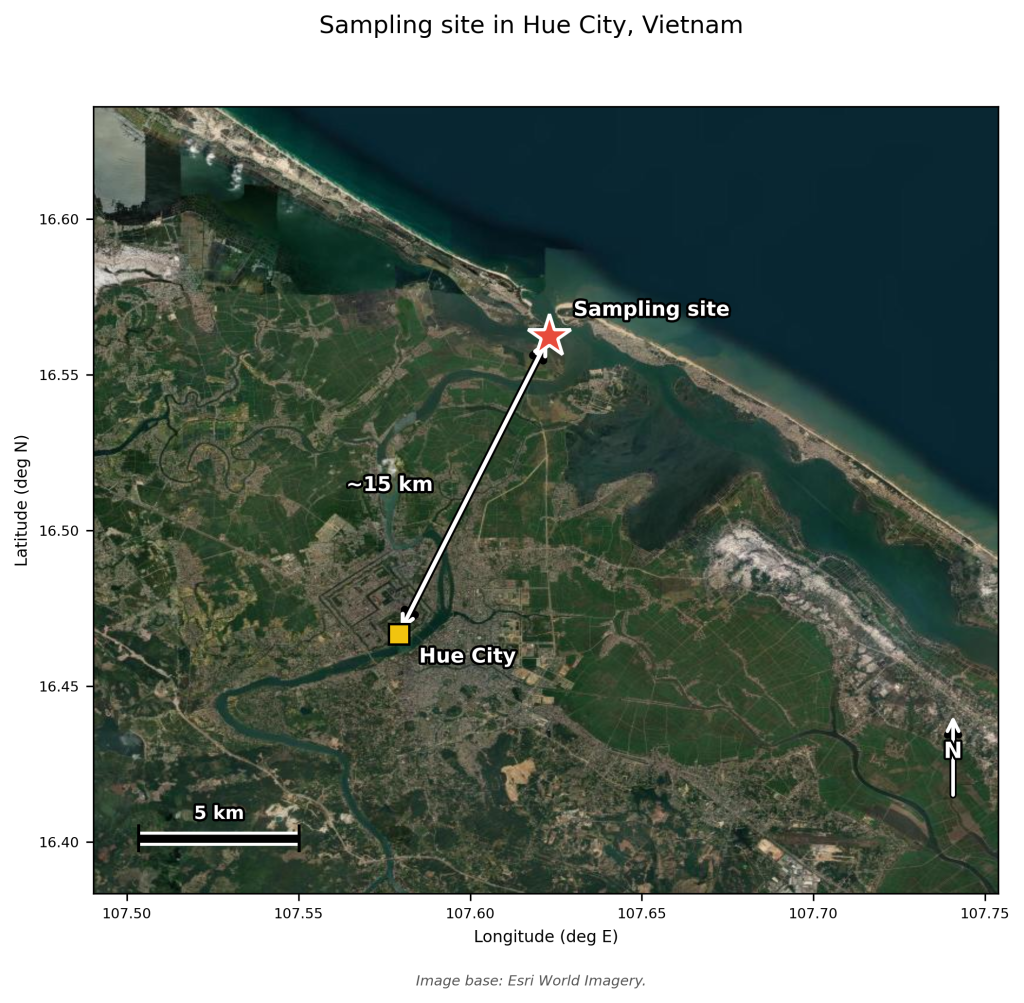
Located in Central Vietnam at 16°28′00 N, 107°34′45 E, on the banks of the Perfume River, oysters are typically consumed there raw, fried, dried, or baked, with an average consumption of 4.9 g per person per day (Nguyen et al., 2012). With an average of about 3,000 mm of rainfall per year, the city has a tropical monsoon climate. Flooding usually starts in October and lasts from August to January during the rainy season. The average annual temperature is 25 °C during the dry season, which runs from March to August. Notably, Hue lacks a municipal wastewater collection and treatment system and is prone to flooding, affecting its 455,230 inhabitants (Nguyen et al., 2018).
Oysters were collected from one coastal sampling area on the Perfume River estuary, Hue City, Vietnam, between March 2019 and October 2021 (Figure 1). Sampling was conducted intermittently over this 31-month period; the original frequency was weekly or biweekly but varied for operational reasons. Sampling was suspended during March, April, August, September and October 2020 due to COVID-19 restrictions in Hue City. In 2021, only February–April and October were sampled; January and May–September 2021 were missed. A total of 34 sampling events were conducted, with 6 to 12 oysters collected per event and each oyster processed and analysed individually, yielding 240 individual oyster samples in total. Oysters, as invertebrate molluscs, are not subject to vertebrate animal ethics regulations in Vietnam. Sampling was conducted with the permission of local authorities. Samples were transported on ice within 12 hours of collection; oysters were rinsed in PBS, shucked, and the digestive tissues dissected. Tissues were stored at −20 °C until viral extraction.
For seasonal analysis, only data from the complete 12-month sampling cycle (March 2019 – February 2020, 21 sampling events, 162 oysters) were used, as this represents the only uninterrupted annual cycle with full seasonal representation. Data from 2020 and 2021 are presented separately to illustrate inter-annual variation.
2.2. Virus extraction and qPCR analysis
Murine norovirus (MNV) was spiked as a process control into each homogenised digestive tissue prior to extraction, at approximately 105 – 106 copies per sample, and the recovery efficiency was calculated.
Viral genomes were extracted from the digestive tissue following the method outlined by Pu et al. (2018).
Briefly, digestive tissue was digested with α-amylase, proteinase K and lipase, clarified by centrifugation, and the supernatant from each individual sample was stored at −80 °C until subsequent analysis. Viral RNA was extracted using NucliSENS miniMAG reagents (BioMérieux, Marcy-l’Étoile, France). Extracted viral RNA was reverse transcribed into cDNA using the High-Capacity cDNA Reverse Transcription Kit (Applied Biosystems, Tokyo, Japan). The cDNA was then subjected to quantitative polymerase chain reaction (qPCR) to detect norovirus genogroups I (GI) and II (GII), as well as pepper mild mottle virus (PMMoV), using the StepOnePlus Real-Time PCR System (Applied Biosystems, Tokyo, Japan). Thermocycling conditions, along with primer and probe specifications (Table 1), were as described by Canh et al. (2021). Data analysis was conducted to evaluate differences in norovirus prevalence between the dry and wet seasons.
| Target | Name | Function | Sequence (5’→3’) | Reference |
|---|---|---|---|---|
| Norovirus GI | COG1F | Forward primer | CGYTGGATGCGNTTYCATGA | Kageyama et al. (2003) |
| COG1R | Reverse primer | CTTAGACGCCATCATCATTYAC | Kageyama et al. (2003) | |
| RING1A | TaqMan probe | FAM-AGATYGCGATCYCCTGTCCA-TAMRA | Kageyama et al. (2003) | |
| RING1B | TaqMan probe | FAM-AGATCGCGGTCTCCTGTCCA-TAMRA | Kageyama et al. (2003) | |
| Norovirus GII | COG2F | Forward primer | CARGARBCNATGTTYAGRTGGATGAG | Kageyama et al. (2003) |
| COG2R | Reverse primer | TCGACGCCATCTTCATTCACA | Kageyama et al. (2003) | |
| RING2 | TaqMan probe | FAM-TGGGAGGGCGATCGCAATCT-TAMRA | Kageyama et al. (2003) | |
| PMMoV | PMMoV-F | Forward primer | GAGTGGTTTGACCTTAACGTTTGA | Haramoto et al. (2013) |
| PMMoV-R | Reverse primer | TTGTCGGTTGCAATGCAAGT | Haramoto et al. (2013) | |
| PMMoV-P | TaqMan probe | FAM-CCTACCGAAGCAAATG-MGB-NFQ | Haramoto et al. (2013) | |
| MNV (process control) | MNV-F | Forward primer | CCGCAGGAACGCTCAGCAG | Kitajima et al. (2010) |
| MNV-R | Reverse primer | GGYTGAATGGGGACGGCCTG | Kitajima et al. (2010) | |
| MNV-P | TaqMan probe | FAM-ATGAGTGATGGCGCA-MGB-NFQ | Kitajima et al. (2010) |
Samples with MNV recovery rates above 1% are considered validated for qPCR (International Organization for Standardization [ISO], 2017). Retests were performed on samples with an MNV recovery rate below 1%.
A standard curve was included on every qPCR run, prepared from a 10-fold serial dilution series of quantified standards and run in triplicate. Mean amplification efficiencies (± SD) across all runs were 82.5% ± 2.5% for norovirus GI, 97.2% ± 6.0% for norovirus GII, and 95.5% ± 9.5% for PMMoV, with R2 values of 0.98–0.99. Results are reported as percentage positive rather than absolute gene copy numbers, as quantification below the reliable detection range would introduce substantial uncertainty. The Cq < 40 positivity threshold was established as a laboratory-specific criterion based on standard-curve analysis and prior experience with norovirus detection in oyster samples from the same site (Nguyen et al., 2018). This threshold is supported by evidence that Cq cut-off values around 40 are appropriate for norovirus detection, as amplification efficiency and measurement reliability decrease substantially at higher cycle numbers (Trang et al., 2015). All Cq < 40 calls additionally required the expected sigmoidal amplification curve and no-template controls (NTCs) were required to remain negative in every run. Sterilised polyethylene low-binding tubes were used for all procedures unless otherwise noted.
2.3. Data analysis
The monthly average positive rate of norovirus detection was calculated. Prior to all ANOVA analyses, Levene’s test was used to assess homogeneity of variance. Where variances were equal, one-way ANOVA was applied; where variances were unequal, Welch’s ANOVA was used instead. Two separate analyses were conducted: first, seasonal comparison (dry season: March–August vs wet season: September–February) using data from the complete 12-month cycle only (March 2019–February 2020, 21 sampling events, 162 oysters), representing the only uninterrupted annual cycle in the study period; second, inter-annual comparison of dry season and wet season detection rates separately across 2019, 2020 and 2021. Where significant inter-annual differences were found, post-hoc Tukey HSD tests were performed to identify specific pairwise differences. The overall prevalence of norovirus GI and GII across the complete study period was compared using the chi-square test. Pearson correlation analysis was used to assess the relationship between PMMoV and norovirus GI and GII detection rates across all sampling events. Statistical significance was set at α = 0.05. All analyses were performed in SPSS v.29.
3. RESULTS AND DISCUSSION
3.1. Norovirus detection in oysters and seasonal trends
This study detected norovirus GI and GII in the digestive tissues of oysters, which were collected between March 2019 and October 2021. The recovery efficiency of the detection method, determined by spiking with murine norovirus, was 5.8% (N = 61, SD = 5.5%), which is low but comparable with known PCR inhibition challenges in oyster digestive tissue matrices (Nguyen et al., 2018). This low recovery rate may have reduced detection sensitivity, meaning the true prevalence of norovirus may be higher than reported. Norovirus GI and GII were observed in 45.4% and 35.4% of oysters, respectively. Notably, norovirus GI was more prevalent than GII in the oysters (χ2(1) = 4.576, p = 0.032). Although GII is globally dominant in clinical gastroenteritis surveillance, this pattern does not necessarily extend to environmental matrices such as oysters, where genogroup prevalence is additionally influenced by local wastewater composition, oyster filtration efficiency, and differential environmental persistence of GI and GII strains. This is consistent with findings from the same region by Nguyen et al. (2018). Similarly, GI prevalence was observed over GII in wastewater in Japan (Katayama et al., 2008) and in environmental waters in Thailand (Kittigul et al., 2009). However, this contrasts with a study in Brazil by Victoria et al. (2010), where GII predominated in wastewater samples. Geographic and environmental factors may influence the variation in genogroup prevalence across regions. One possible explanation for the higher GI detection could be related to environmental resilience; da Silva et al. (2007) suggested that GI may be more resistant to decomposition in aquatic environments than GII, which might lead to its greater persistence in environmental water. Future studies should directly compare GI and GII environmental persistence in estuarine matrices (for example, by measuring decay rates under salinity, temperature and UV-exposure conditions representative of tropical coastal waters) to confirm whether differential resilience, rather than differences in source loading, drives the GI-dominant pattern observed here.
The tropical climate of the study area is characterised by distinct dry and wet seasons. Cooler temperatures of 20 °C to 22 °C are typical of the wet season, whereas average temperatures during the dry season range from 27 °C to 29 °C. For analysis, the dry season was defined as March–August and the wet season as September–February, following the regional climatology (Nguyen et al., 2018). According to our findings, the dry season had a marginally higher prevalence of both norovirus GI and GII than the wet season (see Table 2). However, seasonal differences were not statistically significant for GI (F(1,19) = 1.474, p = 0.240) or GII (Welch’s F(1,11.7) = 0.248, p = 0.627). There is frequently a discernible seasonal trend in norovirus prevalence in nations with distinct four-season climates, with wintertime peaks usually occurring (Haramoto et al., 2006; Victoria et al., 2010). In tropical climates, however, seasonality might not have as much of an effect. In a Vietnamese region, Nguyen et al. (2018) reported elevated norovirus levels during flood seasons, but our data revealed no discernible seasonal variation (p < 0.05). This could imply that human activity, rainfall and water flow all affect norovirus trends in tropical climates.
| Season | Norovirus GI | Norovirus GII | ||||
|---|---|---|---|---|---|---|
| Positive No. | Total No. | Positive rate (%) | Positive No. | Total No. | Positive rate (%) | |
| Dry | 46 | 96 | 47.9 | 40 | 96 | 41.7 |
| Wet | 63 | 144 | 43.8 | 46 | 144 | 31.9 |
| All | 109 | 240 | 45.4 | 85 | 240 | 35.4 |
| Note: Seasonal statistical comparisons were conducted using data from the complete 12-month cycle only (March 2019 – February 2020, n = 162 oysters). No significant seasonal difference was found for GI (F(1,19) = 1.474, p = 0.240) or GII (Welch’s F(1,11.7) = 0.248, p = 0.627). Overall GI prevalence was significantly higher than GII across the full study period (χ2(1) = 4.576, p = 0.032). | ||||||
These discrepancies between our results and those of earlier research, including Nguyen et al. (2018) and Victoria et al. (2010), emphasise the importance of accounting for local environmental factors when interpreting viral prevalence data. Given that noroviruses are sensitive to environmental conditions, factors such as water salinity, pH, hydrology and local waste management likely contribute to the observed variations in viral presence.
3.2. Potential influence of climate variability and COVID-19 restrictions on inter-annual norovirus trends
Seasonal analysis of norovirus GI and GII was conducted using data from the full 12-month period from March 2019 to February 2020, which represents the only uninterrupted annual data in the study period (Figure 2). The results showed that there is no significant difference in norovirus detection between dry (March – August) and wet seasons for GI (dry: 59.3% ± 33.4% vs wet: 44.4% ± 22.6%; F(1,19) = 1.474, p = 0.240). For GII, Levene’s test indicated unequal variances between seasons (p = 0.019). Therefore, Welch’s ANOVA was applied. There are also no significant differences between dry and wet seasons for GII (dry: 37.0% ± 35.1% vs wet: 30.6% ± 19.6%; Welch’s F(1,11.7) = 0.248, p = 0.627).
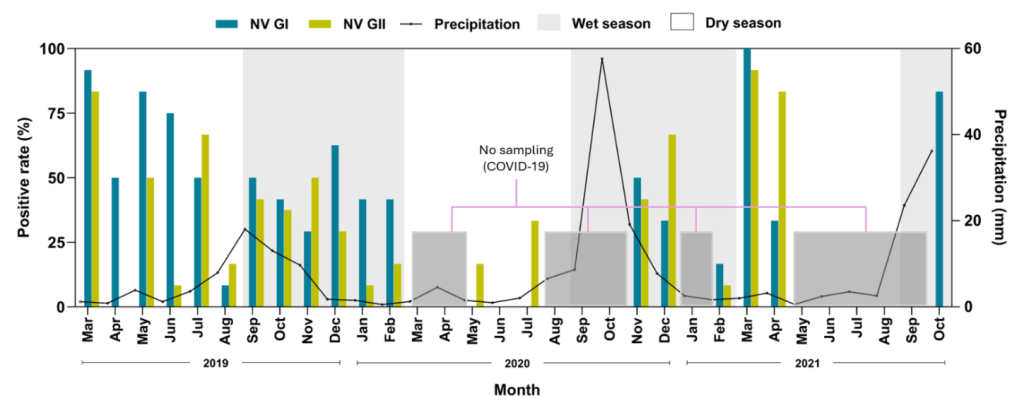
For inter-annual comparison, one-way ANOVA was conducted on dry season data (March – August) and wet season data (September – February) separately across 2019, 2020 and 2021. Levene’s test was used to check variance equality before each analysis and Welch ANOVA was applied where variances were unequal. For the inter-annual dry season comparison, Levene’s test indicated unequal variances for both GI (p = 0.022) and GII (p = 0.014). Welch’s ANOVA was applied where possible. For GI, Welch’s correction could not be computed because the 2020 group had zero variance (SD = 0, all dry season detection rates were 0%). The standard one-way ANOVA result is therefore reported for GI. The 0% GI detection across all 2020 dry season months is different from 2019 (59.3%) and 2021 (77.8%). For the inter-annual wet season comparison, Levene’s test indicated equal variances for both GI (p = 0.132) and GII (p = 0.132), supporting the use of standard ANOVA.
Significant differences were found in dry season detection across years for both GI (F(2,13) = 7.102, p = 0.008) and GII (Welch’s F(2,7.7) = 32.653, p < 0.001). For GI, the post-hoc Tukey HSD test showed that 2020 was significantly lower than both 2019 (59.3% vs 0.0%, p = 0.016) and 2021 (77.8% vs 0.0%, p = 0.016), whereas 2019 and 2021 did not differ significantly (p = 0.639). For GII, 2021 dry season detection (88.9% ± 9.6%) was significantly higher than 2020 (16.7% ± 13.6%, p = 0.015) and 2019 (37.0% ± 35.1%, p = 0.043). In contrast, no significant inter-annual differences were found in wet season detection for GI (F(2,15) = 0.076, p = 0.928) or GII (F(2,15) = 2.921, p = 0.085), suggesting that the inter-annual variation was specific to the dry season period.
Dry-season GI detection was markedly lower in 2020 than in 2019 and 2021, with no detections in May, June, or July 2020. GII detection was also reduced in the 2020 dry season compared with 2019 (16.7% vs 37.0%). These decreases may be associated with COVID-19 restrictions in Hue City, as strict social restrictions have been reported to substantially reduce norovirus circulation globally (Eigner et al., 2021; Lennon et al., 2020). The results agreed with the study by Mai et al. (2023), which showed lower norovirus during the COVID-19 travel restriction period in 2020.
To evaluate whether rainfall could explain the lower virus detection in 2020, the monthly precipitation data was obtained from NASA POWER (NASA POWER Project, 2025). The data revealed that May, June and July 2020 actually received less precipitation than the same months in 2019 (May: 47 vs 120 mm; June: 29 vs 37 mm; July: 64 vs 112 mm), as indicated in Figure 3. The results supported that rainfall dilution cannot account for the observed reduction in GI detection. Furthermore, November 2020 received nearly twice the rainfall of November 2019 (575 vs 291 mm), yet GI detection remained at 50%, which is further inconsistent with a dilution effect.
The substantially elevated GII dry season detection in 2021 (88.9% ± 9.6%) may reflect a rebound in norovirus circulation following the easing of COVID-19 restrictions. This result is consistent with the increasing prevalence of norovirus reported in Hue province during the post-COVID period (Mai et al., 2023). However, this should be interpreted cautiously as the 2021 dry season data comprised only three sampling events across two months (March and April 2021).
Notably, October to November 2020 experienced historically unprecedented precipitation (1,787 mm in October 2020), causing flooding. The precipitation was more than 4-fold higher than in October 2019 (404 mm), as shown in Figure 3. Sampling was suspended during this period due to COVID-19 restrictions, so the direct impact of this extreme event on viral detection could not be assessed. However, routine seasonal flooding occurs annually in Hue during the wet season and was present throughout the study period. The October 2020 event was exceptional in scale rather than seasonal in nature. We acknowledge that the absence of direct hydrological measurements, including salinity, river discharge and turbidity, limits further interpretation, and future studies incorporating continuous environmental monitoring would allow more rigorous testing of environmental drivers of norovirus prevalence in this setting. Furthermore, oysters in estuarine environments such as the Perfume River can accumulate viruses from both freshwater and marine sources depending on tidal mixing, and future studies should incorporate salinity and turbidity measurements to better characterise the hydrological drivers of viral accumulation.
Norovirus GII showed no significant seasonal differences within the complete year (Welch’s F(1,11.7) = 0.248, p = 0.627), nor across wet seasons between years (F(2,15) = 2.921, p = 0.085). This may suggest that GII strains are strongly associated with human wastewater, which may still flow into water sources even with reduced human activity, particularly in areas with continuous wastewater discharge. Similar results have been observed in previous studies, in which several Asian countries reported that GII was the main cause of gastroenteritis outbreaks (Chan et al., 2015; Matsushima et al., 2015).
A direct comparison with clinical gastroenteritis-hospitalisation records for Hue City was not feasible, as case-level data at the temporal resolution required were not accessible during the study period; integrating oyster-based viral surveillance with clinical case data in a One-Health framework is an important direction for future work.
3.3. Detection of PMMoV as a potential viral indicator for norovirus contamination in oysters
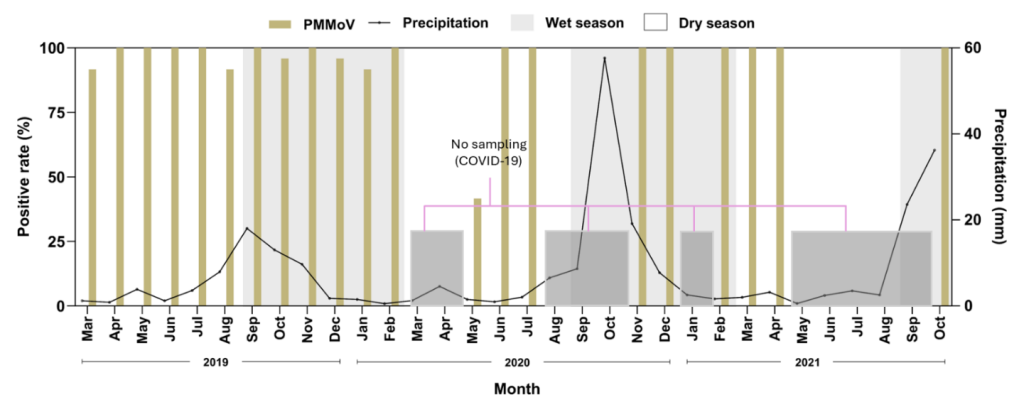
PMMoV was detected in 95.0% (228/240) of oyster samples across the full study period (Figure 3). This consistency suggests a high prevalence and environmental resistance of PMMoV. Of the 34 sampling events, 27 (79.4%) showed 100% PMMoV detection and only one event (May 2020) showed 41.67% detection (5/12 oysters), coinciding with the period of strictest COVID-19 restrictions in Hue City. Detection rates were consistently high across both dry (96.3%, 52/54 oysters) and wet seasons (97.2%, 105/108 oysters) during the complete year analysis (March 2019 – February 2020), with no significant seasonal difference.
Previous studies have proposed PMMoV as an indicator of faecal contamination from wastewater (Farkas et al., 2020; Rosario et al., 2009). However, Pearson correlation analysis showed no significant correlation between PMMoV and norovirus GI rates (r = 0.272, p = 0.120) or between PMMoV and GII detection rates (r = 0.150, p = 0.396) across all sampling events. These results indicate that although PMMoV reliably flags faecal contamination, its near-universal detection in this tropical setting limits its usefulness as a quantitative proxy for norovirus risk in oysters.
4. CONCLUSION
This study reveals notable patterns in the detection of norovirus GI, GII and PMMoV in oysters from Hue City, Vietnam. Norovirus GI was found at higher levels than GII in coastal oyster samples (χ2(1) = 4.576, p = 0.032), with a higher prevalence in the dry season than the wet season. However, this difference was not statistically significant for either GI (F(1,19) = 1.474, p = 0.240) or GII (Welch’s F(1,11.7) = 0.248, p = 0.627). Significant inter-annual differences in norovirus GI and GII prevalence were observed specifically in the dry season across years (p = 0.008 for GI; p < 0.001 for GII). The markedly lower detection in 2020 may be attributable to COVID-19 restrictions in Hue City; rainfall data indicated that the months of lowest detection (May, June and July 2020) received less precipitation than the same months in 2019.
The high prevalence of PMMoV in oysters and lack of significant correlation with norovirus detection (r = 0.272, p = 0.120 for GI; r = 0.150, p = 0.396 for GII) suggest that PMMoV may not be a reliable quantitative proxy for pathogenic virus contamination in oysters in this tropical setting. Key limitations of this study include variable MNV recovery (mean 5.8%, SD 5.5%) and gaps in sampling during the 2020 COVID-19 lockdown.
From a food-safety standpoint, norovirus was detected in 35.4% (GII) to 45.4% (GI) of oyster samples, indicating persistent exposure risk for raw-oyster consumers in Hue, Vietnam. These findings support (i) incorporating oyster-based viral surveillance into local food-safety monitoring where sewered wastewater is unavailable, and (ii) public-health advisories against raw consumption during dry-season peak detection periods. These findings underscore the importance of ongoing environmental monitoring and improvements in wastewater treatment to reduce the risk of virus transmission through seafood, thereby protecting public health.
5. ACKNOWLEDGEMENT
This work was supported by a Collaborative Regional Research Programme (CRRP2018-02MY-Pu) granted by the Asia-Pacific Network for Global Change Research (APN) and was partially supported by the International Research Partnership Fund, Faculty of Science, Chulalongkorn University.