Socio-ecological approaches in the science of pricing ecosystem services: A perception-based study in some wetlands of Asia and the Pacific
Keywords
Asia · Ecosystem services · Perception Study · Science of Pricing · Wetlands
HIGHLIGHTS
- Certain ecosystems’ intangible nature and non-use values pose challenges in their scientific pricing; however, such pricing is significantly needed.
- An attempt to price ecosystem services within socio-ecologically contrasting wetland ecosystems in Asian geo-ecology using perception-based contingency valuation methods reveals interesting drivers and determinants of pricing.
- It is concluded that strong awareness and built capacities vis-à-vis the science of pricing ecosystem services have significant bearings upon eco-political decision-making.
1. BACKGROUND AND LITERATURE REVIEW
According to the Millennium Ecosystem Assessment (2006), ecosystem services refer to the benefits humans obtain from the ecosystems they inhabit or depend upon. These services are mainly categorised by The Economics of Ecosystems and Biodiversity (TEEB Program of UN Environment [TEEB], 2009), on the basis of their use or non-use values. Non-use values are mostly intangible and therefore difficult to measure, whereas the use values of ecosystem services can be measured through their market values. Further, these services are classified according to their properties: some might be provisioning a product or other direct benefits (provisioning services); some have a regulatory authority to control or regulate some aspects of the ecosystem (regulatory services); some may extend cultural services for the inhabitants; and a few services might just support other ecosystem services (supporting services).
Studies have revealed that marginal communities, who are also vulnerable to climate impacts, strongly depend on both the use and non-use values of ecosystem services for their livelihood and lifestyle sustainability. While ‘use’ values are directly linked to their livelihood and income generation activities, ‘non-use’ values are recognised by them as indirect supports that they owe to their existence or its extended provision to other community members or even future generations. Contingent valuation of such ‘non-use’ ecosystem services adds insights to the influences of conservation policies on communities (Nilgen et al., 2024). In the climate milieu, it is a matter of immediate concern that, with the advent of anthropogenic interferences and environmental hazards affecting the ecosystems, most ecosystem services are deteriorating fast along with habitat degradation, thereby leading to the elevation of poverty and vulnerability among the community users (Liu et al., 2019; Pedersen Zari, 2019). Often, such damage and loss of ecosystem services are not accounted for, owing to the absence of a reasonable valuation method as well as monetised pricing of their values. Such losses can be irreversible due to thresholds and non-linearity in natural systems (Perrings & Pearce, 1994). The economic values of such intangible loss and damage are obscure. Policies pertaining to valuation need scientific enunciations, so as to ensure equity and sustainability. Therefore, the analytical apparatus employed for pricing nature services has to be scientifically developed to address sustainability challenges (Pearce, 1993).
Ecosystem services values are key to making conservation investments. However, they have not yet influenced conservation policy and practice (GIZ, 2018), as they are highly dependent on socio-institutional paraphernalia and demand special assessment methods (FAO, 2022; IPBES, 2019). Scientific methods in economic valuation of intangible natural services based on empirical studies demand interdisciplinary approaches and multi-criteria decision analysis (Veronika et al., 2023). Only a few studies discuss the role of ecosystem services pricing for decision-support (Laurans & Mermet, 2013), as there exist fundamental inadequacies in valuation (Barton et al., 2014; Kallis et al., 2013), including the complexity and connectedness of ecosystems, multiple rationalities, and dependence on distributional and institutional settings. The need for assessment and evaluation of ecosystem services was perceived in the early 1940s but gradually gained significant importance in conservation policy planning and natural resource management. Amongst numerous methods of valuation of ecosystem services, the most widely accepted ones are monetary valuation methods since they are pragmatic and therefore convincing in policy planning and business communications. However, it is imperative to have place-based methods for pricing both use and non-use values of ecosystem services (Selivanov & Hlaváčková, 2021). Gómez-Baggethun and Barton (2013), who reviewed technical challenges in pricing ecosystem services in urban contexts, suggested that its policy relevance depends on several socio-ecological criteria, failing which it can lead to inequalities and unsustainability. The benefits of ecosystem services go largely unnoticed in Ecosystem-based Adaptation (FAO, 2022; TEEB, 2009), whereas economic instruments such as the ecosystem services pricing system can inform policy-decision-making. Ecosystem services in Asia-Pacific countries provide US$14 trillion per year in benefits; these are mostly non-marketed and do not reflect in the national GDP. By 2050, these will be adversely impacted by the Great Transition Initiative archetypes (Kubiszewski et al., 2016). Sustaining the ecosystem services will contribute to poverty alleviation. Therefore, policymakers need alternative valuation methods, sensitive to economic and cultural diversity, as well as adaptive to place-based aspects for sustainable planning (Saeed, 2018).
The Nature’s Contribution to People (NCP) framework emphasises the significance of socio-cultural attributes as an intersectoral driver that determines the anthropoid perception of nature’s goods and services towards the well-being of people. Intergovernmental Science-Policy Platform on Biodiversity and Ecosystem Services (IPBES) recognises that NCP not only contextually explains the diversity in perspectives of different communities in framing ecosystem services but also accentuates the importance of traditional knowledge systems, which are less represented in value assessment and synthesis. However, the overlap in plurality and diversity of nature services are difficult to be discretely recognised by peer communities that exists in close proximity with the species rich habitat and as well enriched ecosystem services and expectedly, it is the role of conservationists and stakeholders, actors and institutions across multiple research-practice interfaces to translate, negotiate, mobilise and synthesise traditional knowledge among diverse perspectives, various actors, multiple methods, and values (Peterson et al., 2018).
However, various global studies make the research gap between ecosystem services pricing and policy-oriented decision making evident (Clarke et al., 2021; Olander et al., 2021; Wong et al., 2018). Willcock et al. (2018), who advocated for machine learning in pricing exercises, observed that the gap in implementing ecosystem services into real-world scenarios arises due to possible uncertainty in information and a limited data environment.
Given the above context, environmental policies must be developed not only to internalise the externalities, but also involve international coordination for addressing place-based contexts. Conventional cost-benefit analysis is inappropriate for larger non-marginal ecological problems (Dietz & Hepburn, 2010). Biodiversity and climate change depend upon complex, uncertain science to underpin policy, implying that capacities need to be built in assessing their economic prices. More precision in analysis and modest propositions of interventions are required to deal with environmental challenges (Helm et al., 2017). Macroeconomic concerns and measures, as well as the drivers and determinants of sustainability in the context of orthodox economic growth, need to be factored into environmental policy. Institutional investors have recurrently called for an appropriate risk-reward balance and credible long-term environmental policies based on scientific assessments and estimates to justify redirecting capital towards conservation priorities (Munns et al., 2009).
2. METHODOLOGY
2.1. Selection of study sites and study respondents
The study sites comprise three socio-ecologically and socio-economically contrasting wetlands in India, Bangladesh and Thailand. Though these three differently located wetlands, viz. East Kolkata wetlands in India, Tangaur Haor in Bangladesh and Monkey’s Cheek in Thailand are located in a similar geospatial and climatic regime of South and Southeast Asia, they have highly contrasting attributes in terms of ecological nature and economic usages. While East Kolkata wetland is a shallow sewer-fed peri-urban Ramsar wetland on the floodplains of the river Ganges that harbours wastewater fisheries of marginal agrarian communities, the Monkey’s Cheek is an urban artificial water reservoir, deeply dug for enhancing the city’s flood resilience, wherein fisheries are a spin-off economic activity. Tanguar Haor is a natural rural Ramsar wetland on the banks of the Surma-Kushiyara rivers that shows seasonal ecological variances and aquatic biodiversity. The aim has been to undertake a comparative and comprehensive study concerning three different methods of ecosystem valuation and pricing, based on the types of ecosystem services being prioritised by stakeholders and users. The study sites are briefly described below.
2.1.1. East Kolkata Ramsar wetland site in India
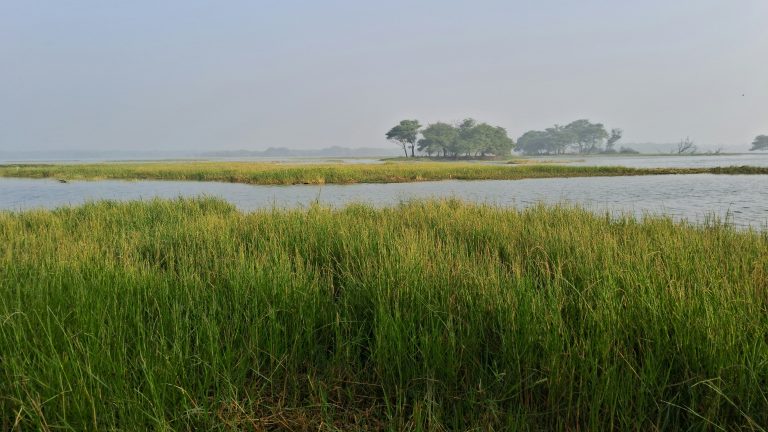
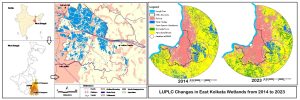
This peri-urban wetland (22 0 27′ N 88 0 27′ E) spanning over 125 km2 with a mean altitude of 20–25 AMSL, lies in close proximity to the metropolis of Kolkata, in India. It has been recognised as a Ramsar site with one of the largest natural resource recycling systems, owing to its capacity to recycle 100 million litres of the city’s sewage, every 30 days, through a natural bio-geochemical system in the presence of solar radiation. It is a productive habitat producing fish, paddy and other horticultural products; it is rich in biodiversity and locally recognised for its abundant cultural ecosystem services (Dey & Amerasinghe, 2022). Marginal fishers and farmers inhabit the wetland itself, whereas posh urbanites reside around the outer skirts of the wetland, enjoying its aesthetic landscape (Figure 1).
2.1.2. Tangaur Haor in Bangladesh
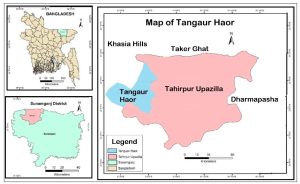
Tangaur Haor is a unique rural wetland ecosystem, located in the Dharmapasha upazila and Tahirpur upazila of Sunamganj district in Bangladesh, spread over an area of 100 km2, with 46 villages and 28 km2 of riverine waterlogged wetland. It is the source of livelihood for more than 40,000 people who depend on the water resources for fishing and farming. Further, it serves as a winter roosting ground for about 200 types of migratory birds and as a habitat for more than 140 species of freshwater fish. Research findings (Bagchi et al., 2020) have shown that in the pre-monsoon season, changes in rainfall patterns and water temperatures cause flash floods in the Tanguar Haor wetland, followed by drought spells. Such anomalous water regulation causes much loss and damage to local livelihoods and sustainable development (Figure 2).
2.1.3. Monkey’s Cheek in Thailand
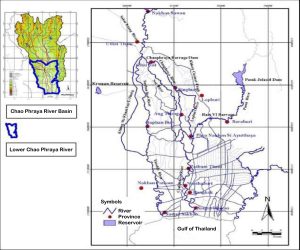
Monkey’s Cheek serves as a flood-control design for temporary water regulation, by storing extra floodwater during the monsoon period and gradually draining it out when the floodwaters recede. In the absence of hydraulic structures in natural canals or lowland areas, the control and retardation of the flood water, as in an irrigation project, is managed using such a “Monkey’s Cheek.” The study site herein is the Mahachai-Sanamchai Canal Monkey Cheek Project, near the city of Bangkok, which holds the floodwater reserves in the upper catchment area during rains and depending on the sea-tide levels, it releases the water into the Gulf of Thailand either using gravity or through pumping stations. Construction of improvised water regulators and pumping stations located in the canals within the project area is an integral part of this intervention. Such arrangements yield substantial mitigation of the flooding problem, as evidenced by a mathematical simulation model (Wattanaprateep, 2016). These temporary reservoirs of water offer a plethora of wetland ecosystem services to surrounding inhabitants and beneficiaries: from aesthetic landscapes to aquafarming (Figure 3).
2.2. Research design
This study is based upon the perception of ecosystem services in the selected wetlands vis-à-vis their users and beneficiaries. In selecting the respondents for attitude scaling, free and pre-informed consent was taken. Equal weightage was given to residents and non-residents of the wetland areas, direct users and indirect users of the ecosystem services, lower and upper economic strata, as well as lower age group (25–45 yrs) and upper age groups (46–66 yrs). Interviews have been conducted using a structured questionnaire, employing a cross-sectional approach, with the beneficiaries and stakeholders in the intervention areas, between September 2021 and August 2022. The stratified sampling method was deployed, as the study area was divided into smaller hamlets, and each such sublocation was considered an enumeration area (EA). The quotient obtained by dividing the enumeration population by the total population was multiplied by the total sample size in each intervention area, and the result was used to populate the primary sample unit (Mugenda & Mugenda, 1999). This sampling design created a better opportunity for both the overall population and individuals to be represented in the smallest EA. After obtaining free pre-informed consent from the local stakeholders, the survey prompted the Willingness to Pay (WTP) from a sample of households in the EA around the intervention site. Local elders were specifically engaged in the perception study to acquire both spatial and temporal ranges of opinions.
A single-bound dichotomous choice questionnaire has been designed for the Contingent Valuation Method (CVM), wherein the maximum WTP is prompted with a “yes” or “no” response. A review of household socio-economic characteristics has been carried out using a pre-tested and field-validated questionnaire, including respondent education, income, age, sex, land size, household size, the distance to the ecosystem, etc. The questionnaire first invokes the ethics of environmental conservation regarding the benefit accrued from the ecosystem. Next, it narrows down to focus on the use and non-use values of ecosystem services such as agricultural products, water resource regulation, aesthetic or cultural values, bequest and biodiversity conservation. Further, it targets the hypothesis of whether enhanced services are dependent on other related services or not; then, it looks at whether they agree with the available benefits of the services in the given scenarios; and lastly, it focuses upon the WTP of the respondents depending upon the market value, compensatory value or travel cost and so on, ranging between a minimal and a maximal pricing scale (Petrolia et al., 2014). The perception study survey considers every bid for WTP stated by the respondents; however, a zero value for an entry is considered unacceptable, and if the respondent does not understand the concept, those responses are excluded from the survey. Actually, the study was intended first to estimate the mean value of WTP for the local communities living around the wetland. Second, it compares the mean value across all those factors hypothesised to determine, in actuality, the stated economic value. Thus, both quantitative and qualitative data are generated, necessitating the use of descriptive statistics for correlated and comparative analysis, wherein a multifactorial regression is utilised.
2.3. Analytical methods
The following methods have been used for analysis and interpretation of the results across all three intervention sites.
2.3.1. Sociometric assessment
Sociometric assessments have been carried out through household surveys, using a sociometric tool developed in the scientific workshop. These assessments collect information about factors such as household size, land holdings, education and training, type of occupation, household income, disaster preparedness and dependence on the ecosystem services.
2.3.2. Vulnerability analysis
Vulnerability assessment (Thomas et al., 2019) has been employed to assess the threats from potential hazards to the population and the ecological paraphernalia they are dependent upon. It can be expressed as follows:
Vulnerability = f ( exposure + sensitivity − adaptive capacity ) ,
wherein exposure refers to the magnitude and duration of the exposure to extremities such as disasters, economic stress, societal inequity and psycho-biological factors. Sensitivity is defined as the degree to which a system (in this case, both inhabitants and the ecosystem) is impacted, either adversely or beneficially, by the variability or ensuing change. Adaptive capacity herein refers to the built capacities of the inhabitants, which allow them either to access alternatives or substitutes or to accommodate changes with augmented resilience. The perception of these factors has been quantified through attitudinal scoring on a 10-point scale, during focused group discussions and participatory rural appraisals of the wetlands’ inhabitants, which made more closure choices for the respondents and transformed them with double accuracy.
The methods for calculating exposure, sensitivity, and adaptive capacities are detailed below. These are measured by taking the mean values of the responses obtained from 10 different focus groups in each location. Each focus group consisted of 10–12 members who were residents of the respective wetlands.
- Exposure (%) = (No of stressful or disastrous events in the intervention area / No of such events exposed to) × 100.
- Sensitivity (%) = (No of Damaging events – No of Benefiting events)/(No of stressful events) × 100.
- Adaptive capacity (%) = (No of Capacity Building Events attended / No of Capacity Building events organised in the locale) × 100.
2.3.3. Perception analysis and attitude scaling
The respondents’ perceptions have been captured and quantified using an attitude scale. The scale development process, as described by Trochim (2006), has been completed via the five steps detailed below.
- The definition of the measured trait assumed that it is unidimensional.
- A batch of potential Likert items is generated, which are then rated on a 5-point agree-disagree response scale.
- An expert panel rated the items on a 1–5 scale, considering how favourably the items support the hypothesis (from 1 = strongly unfavourable to 5 = strongly favourable).
- Selected items are retained in the final scale.
- The raw score of the scale and some of the responses are then systematically ordered, so that retrogressive items, measuring responses on some traits in the opposite direction to the rest of the scale, are contrasted therein. This validates the response.
In order to ensure the quality of measurement, multiple scoring approaches were employed. While the unit-weighted sum was preferred to score certain items, factor scores were used for others. The dataset was standardised using the following formula:
z = ( x −
where z = standardised score (z-score); x = individual transformed scale score; µ = mean transformed score; σ = standard deviation of the transformed score. Standardisation enabled accurate inter-comparison across different scales.
The measurement quality of the total score has been of particular interest, as the overall assessment using an instrument is based upon the respondent’s scores on all items. Similarly, to measure the score more accurately, some items on the 5-point scale were converted to a 10-point scale. This was done for items that offered respondents more narrowly defined choices, thereby enabling double the measurement precision. Some of the raw scale scores are based on a unit-weighted sum of item scores, and others on factor scores. Unit-weighted scoring generated standardised scores using a normative sample. Subsequently, the scale score has also been standardised by raising it to the previously estimated power level. The mean transformed score is then subtracted from the transformed scale scores and divided by the standard deviation of the transformed scores for norming of the data sets. All the scores are transformed into percentiles, z-scores or T-scores for comparing them with other items. The development of the participatory assessment tool has taken place in three steps: generation of drivers and determining factors, qualitative review and cognitive pre-test. Identification of the drivers and determinants, along with the appropriate response scales has been primarily based on the inferences derived from the qualitative study, previous theoretical contemplations, and existing tools. For the sake of comprehensive development, the categories queried from the respondents have been ranked on a quantitative 10-point scale. Next, interview results, which may have already been adequately mapped by existing items in other questionnaires, have been determined.
2.4. Methods of valuation and pricing
Several studies have revealed the correlation between economic aspects and intangible and perception-based ecological perspectives (Gouwakinnou et al., 2019). This study carried out similar assessments using the following normative methods.
2.4.1. Identification of ecosystem services
This is based on the TEEB listing of services (www.teebweb.org) and identified through participatory appraisal in the community during focused group discussions, peer group reviews and stakeholder meetings.
2.4.2. Scoring and selection of ecosystem services
The two ecosystem services have been scored on a weightage basis over a 10-point scale, beginning from least significant at (1) to most significant at (10). The scores have been generated into a graphical notation and an impressionistic heat-image map for visual comparison.
2.4.3. Valuation and pricing of the selected services
Three different economic valuation and pricing systems (Diafas, 2014; Pascual et al., 2010) have been used in the three sites for the selected ecosystem services therein. Using regression analysis, these have been compared to find the mutual dependence among the independent factors. These valuation and pricing methods are detailed below:
- Market price method – can be applied in economic valuation of the traded market supplies and commodities, like oil, corn, fish, etc.
- Travel cost method – can be used to measure the economic valuation of recreational areas by calculating the expenses incurred by individuals to travel and visit those areas.
- CVM (Contingent valuation method) – can be implied in prompting the commercial value of any ecosystem service, by asking persons (users) to choose ecosystem services based on their priorities and importance. This has been deployed in valuing the ecosystem services in Tangaur Haor, wherein the willingness of a person to pay (WTP) for provisioning service of the ecosystem has been equated with several determinants like the household size, total livestock units possessed or total land holdings in ha.
3. RESULTS
3.1. Sociometric assessment
A total of 350 households have been surveyed in the intervention sites across all three countries. Sociometric assessments show a typical urban-rural divide: the respondents from Thailand, being urbanites, have a better socioeconomic status compared to the respondents from the peri-urban wetlands in India and the rural wetlands of Bangladesh. Some stark features differentiate the East Kolkata wetlands and the Tangaur Hoar, indicating that the built capacities in the Haor area are better compared to the East Kolkata wetlands, and the former also have better resources in terms of livestock units and pond holdings. This is probably one reason women are better engaged in work in the Hoar area. The details are available in Table 1 below.
| Locations | Total (HH) Respondents | Average Family Size (No) | Gender Ratio | Literacy Rate (%) | HH Income % (Below $125) | Trained Heads (%) | Insurance Cover (%) | Own Land Above 1Ha (%) | HH with Livestock (%) | HH with Own Pond (%) | Working Males (%) | Working Females (%) |
|---|---|---|---|---|---|---|---|---|---|---|---|---|
| East Kolkata wetlands | 170 | 5.1 | 01:01 | 78.52 | 64.25 | 47.58 | 23 | 3.7 | 23.25 | 83.27 | 67 | 27 |
| Tangaur Haor | 135 | 5.5 | 01:01 | 63.8 | 73.67 | 56.26 | 12 | 2.8 | 28.8 | 86.68 | 65 | 36 |
| Monkey’s Cheek | 45 | 3.9 | 01:01 | 98.9 | 1.20 | 92.44 | 99 | 68.66 | 72.58 | 12.47 | 72 | 68 |
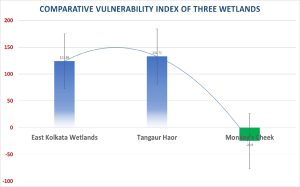
3.2. Vulnerability analysis
Analysing the vulnerability of the respondents across all three sites, based on their exposure to disastrous events and environmental hazards, sensitivity in terms of damage and its accrued compensatory benefits, shows an interesting variation from higher vulnerability (lower resilience) to lower vulnerability (higher resilience). The urbanites around the Monkey’s Cheek wetlands of Thailand are most resilient, whereas the peri-urban respondents of the East Kolkata wetlands are moderately resilient. The fact that the rural respondents of the Haor area are most vulnerable compared to the peri-urban wetland inhabitants probably arises from their higher exposure to stressful events and damage, though they possess better adaptive capacities with built skills for resilience. Table 2 and Figure 4 reflect the details discussed above.
| Location | Exposure (%) | Sensitivity (%) | Adaptive Capacity (%) | Vulnerability Index |
|---|---|---|---|---|
| East Kolkata wetlands | 85.61 | 59.71 | 21.43 | 123.89 |
| Tangaur Haor | 88.24 | 78.82 | 34.34 | 132.72 |
| Monkey’s Cheek | 33.33 | 13.33 | 71.56 | −24.9 |
| Std Devn | 25.29 | 27.50 | 21.25 | 72.31 |
3.3. Perception analysis
This perception study, in identifying the ecosystem services across all three study sites having contrasting socio-ecologies and economies, reveals that, though most of the services are being recognised, the weightage awarded to provisioning and supportive services randomly varied across all three sites, whereas weightages for regulatory or cultural services were mostly equivalent. It is evident from the study that the users appreciate those services more, which directly contribute to their daily chores or activities or are linked with cash flow for livelihood, rather than greater overarching benefits over space and time. Thus, the respondents underjudged several significant regulatory services, such as micro-climate, air pollution control or pollination, and provisioning services, such as genetic biodiversity. An impressionistic heat-map of the perception study has been created considering the centile responses of the respondents. The same is illustrated below in Table 3.
| Service categories (TEEB) | Available Service Types | Priorities in Perception (Percentile) | ||
|---|---|---|---|---|
| East Kolkata wetlands (India) | Monkey’s Cheek (Thailand) | Tangaur Haor (Bangladesh) | ||
| Provisioning Service | Drinking water | 8.5 | 4.1 | 8.2 |
| Household water | 10.8 | 13.6 | 7.6 | |
| Water for agro-farming | 11.6 | 18.2 | 15.5 | |
| Fish-Aqua-Products | 15.4 | 22.5 | 18.5 | |
| Agro products | 3.6 | 2.8 | 3.5 | |
| Fodder and feed | 4.3 | 1.1 | 3.2 | |
| Fuel wood | 2.2 | 1 | 2.8 | |
| Timber wood | 1 | 1 | 3.5 | |
| Medicinal plants | 2.7 | 1.5 | 3.2 | |
| Genetic resources | 1 | 1 | 1 | |
| Supportive Service | Bio-geochemical cycle | 3 | 2 | 2 |
| Resource recycling | 6.4 | 1 | 1 | |
| Primary productivity | 3.2 | 4.5 | 4.5 | |
| Regulatory Service | Climate (Local) | 1 | 1 | 1 |
| Air quality, | 1 | 1 | 1 | |
| Water regulation | 5 | 7 | 7 | |
| Disease regulation | 1 | 1 | 1 | |
| Pest control | 1 | 1 | 1 | |
| Pollination | 1 | 1 | 1 | |
| Cultural Service | Ecotourism | 7.3 | 6.7 | 6.5 |
| Aesthetic beauty | 3 | 3 | 3 | |
| Socio-cultural importance | 3 | 3 | 3 | |
| Religious significance | 3 | 1 | 1 | |
Based on the selected services, a statistical regression has been drawn to compare the interdependence and influence of other socio-economic and ecological factors on the services valued by the respondents (Justus et al., 2021). In the case of the peri-urban wetlands of Kolkata, the East Kolkata Ramsar wetland site of India, the most recognised ecosystem service in the locale, has provided opportunities for ecotourism, as evidenced by the perception studies. Therefore, a multiple linear regression analysis has been performed to examine the influence of variables such as mean distance (in km) from the East Kolkata wetlands and average travel cost (in INR) to reach the wetlands, which are likely to determine the WTP. The regression model shows that these variables explain 85.73% of the variance in WTP (INR) day tour (pax/day). Using the present sample, it is found that the effect is significantly different from zero, F = 15.02, p = .002, R2 = 0.86 and the following regression model is obtained:
WTP (INR) day tour (pax/day) = 1 4 . 9 + 3 . 1 6 ⋅ mean distance from East Kolkata wetlands (km) − 0 . 0 8 ⋅ average travel cost to East Kolkata wetlands (INR)
It is noted that when all independent variables are zero, the value of the variable WTP (INR) day tour (pax/day) is 14.9. It is also seen that, if the value of the variable mean distance from East Kolkata wetlands (km) changes by one unit, the value of the variable WTP (INR) day tour (pax/day) changes by 3.16. However, if the value of the variable average travel cost to East Kolkata wetlands (INR) changes by one unit, the value of the variable WTP (INR) day tour (pax/day) changes by −0.08. The variable mean distance from East Kolkata wetlands (km) has the greatest influence on the variable WTP (INR) day tour (pax/day). However, for both the variants, mean distance from East Kolkata wetlands (p = 0.459) and average cost of travel (p = 0.942), the p-value is greater than the significance level of 0.05. The details of the standardised and unstandardised regression coefficients are given below in Table 4.
| Unstandardised Coefficients | Standardised Coefficients | 95% Confidence Interval for B | |||||
|---|---|---|---|---|---|---|---|
| Model | B | Beta | Standard Error | t | p | Lower Bound | Upper Bound |
| (Constant) | 14.9 | 5.87 | 2.54 | .052 | −0.2 | 30 | |
| Mean Distance from East Kolkata wetlands (km) | 3.16 | 1.02 | 3.94 | 0.8 | .459 | −6.97 | 13.28 |
| Average travel cost to East Kolkata wetlands (INR) | −0.08 | −0.1 | 0.98 | −0.08 | .942 | −2.6 | 2.45 |
In the case of Monkey’s Cheek in Thailand, similar multiple linear regression analysis was performed to examine the influence of the variables average monthly income(THB) and the market price of fish in THB/kg on the variable WTP for fish in THB/kg, since the local inhabitants and stakeholders therein identified the enhanced availability of fresh fish from the water reservoir as an important service being enjoyed by them. Herein, the regression model showed that the variables’ average monthly income in THB and the market price of fish in THB/kg explained 98.14% of the variance from the variable WTP for fish in THB/kg. An ANOVA was used to test whether this value was significantly different from zero. Using the present sample, it was found that the effect was significantly different from zero (F = 79.12, p = <.001, R2 = 0.98) and yielded the following regression model:
WTP for fish (THB/kg) = − 2 9 5 . 3 1 + 0 . 0 1 average monthly income (THB) + 0 . 2 5 market price (THB/kg)
This suggests that when all independent variables are zero, the value of the variable WTP for fish (THB/kg) is −295.31. If the value of the variable average monthly income (THB) changes by one unit, the value of the variable WTP for fish (THB/kg) changes by 0.01. However, if the value of the variable market price (THB/kg) changes by one unit, the value of the variable WTP for fish (THB/kg) changes by 0.25. The standardised coefficients beta are independent of the measured variable and are always between −1 and 1. This shows that the greater the amount of beta, the greater the contribution of the respective independent variable in explaining the dependent variable WTP for fish (THB/kg). In this model, the variable average monthly income (THB) is found to have the greatest influence on the variable WTP for fish (THB/kg).
The p-value for the coefficient of average monthly income (THB) is .001 (>0.05). Thus, it is assumed that the coefficient for the population’s variable average monthly income (THB) is different from zero. However, the p-value for the coefficient of market price(THB/kg) is 0.558. The standardised and unstandardised coefficients are given in Tables 5 and 6 below.
| Unstandardised Coefficients | Standardised Coefficients | 95% Confidence Interval for B | |||||
|---|---|---|---|---|---|---|---|
| Model | B | Beta | Standard Error | t | p | Lower Bound | Upper Bound |
| (Constant) | −295.31 | 497.19 | −0.59 | .594 | −1877.39 | 1286.76 | |
| Average Income (THB) | 0.01 | 0.97 | 0 | 11.69 | .001 | 0.01 | 0.02 |
| Market Price (THB/kg) | 0.25 | 0.05 | 0.38 | 0.66 | .558 | −0.97 | 1.47 |
| Min | Q1 | Median | Q3 | Max | Mean | SD | |
|---|---|---|---|---|---|---|---|
| Residual | −66.09 | −49.63 | −14.28 | 53.96 | 79.36 | 0 | 62.94 |
| Std. Residual | −0.94 | −0.7 | −0.12 | 1.09 | 1.63 | 0.17 | 1.11 |
Likewise, a multiple linear regression has been performed in Tangaur Haor in Bangladesh to examine the influence of the variables such as land holding size (in acre), total number of livestock units (TLU) and income per month (in BDT) on the variable WTP for water regulation services in BDT/month towards insurance premium in compensating damage and loss due to flood or drought. The following regression model has been obtained:
WTP/month (BDT) = − 2 4 7 . 9 4 + 6 1 . 0 6 land size (acre) + 3 0 TLU + 0 . 0 5 income/month (BDT)
It is seen that the variables land size (acre), TLU and income/month (BDT) explain 65.67% of the variance from the variable WTP/month (in BDT). Using ANOVA in the present sample for statistical significance, it is found that the effect is significantly different from zero: (F = 83.53, p = <.001, R2 = 0.66). Further, it shows that when all independent variables are zero, the value of the variable WTP/month (BDT) is −247.94; if the value of the variable land size (acre) changes by one unit, the value of the variable WTP/month (BDT) changes by 61.06; if the value of the variable TLU changes by one unit, the value of the variable WTP/month (BDT) changes by 30; and if the value of the variable income/month (BDT) changes by one unit, the value of the variable WTP/month (BDT) changes by 0.05. The standardised coefficients beta are independent of the measured variable and are always between −1 and 1. The larger the beta amount, the greater the contribution of the respective independent variable to explain the dependent variable WTP/month (BDT). In this model, therefore, the variable income/month (BDT) shows the greatest influence on the variable WTP/month (BDT). The p-value for the coefficient of land size (acre) and income/month (BDT) is <.001, and for the coefficient of TLU it is .001. The null hypothesis that the coefficient of land size (acre), income/month (BDT), and TLU was zero in the population was rejected, as the p-value was found to be smaller than the significance level of 0.05.
4. DISCUSSION
It is imperative from the above results and findings that the perceptions about ecosystem services in commoners and users are naïve, and such services are mostly recognised if they are directly linked to local livelihood activities and cash flow (Gouwakinnou et al., 2019; Zhang et al., 2016) rather than broader environmental or economic benefits at national or global levels. The Intergovernmental Panel on Climate Change (2001) recognised adaptive capacity as a crucial component in assessing the vulnerability of marginal communities at climate risk. However, it has been found that gaining access to nature’s goods and services, as well as fiscal capital and assets, determines the adaptive capacities in these communities, and this needs to be policy-driven in climate-sensitive sectors (Dasgupta et al., 2022). The significance of adaptive capacities in vulnerable communities has recently been furthered, not as simply acquiring and accumulating resources but much beyond in enhancing willingness and abilities in communities to transform them into adaptive actions for augmenting climate resilience, thereby enabling the socio-ecological systems to enhance adaptive capacity in this climate milieu (Chapagain et al., 2025).
Perusal of studies on the perception of cultural ecosystem services in forest communities of western Himalayan terrains indicates a strong bond between the socio-cultural attributes and traditional environmental knowledge, and community forest management policies delineate out-migration, forest degradation and human-wildlife conflict as major threats to the societal aesthetic, cohesion and community harmony (Bhatt et al., 2024).
This calls for a strong recommendation for building capacities in valuation and pricing of ecosystem services for all stakeholders, especially in the global south (Wangchuk et al., 2021). The present study reveals that both in the urban and rural settings of Thailand and Bangladesh, respectively, the WTP for recognisable ecosystem services depends on the income of the respondent (showing strong correlation), whereas household size or acquired non-fiscal resources (such as livestock, land or pond) do not determine the mindsets of users regarding WTP. It is interesting to note that the decisions regarding WTP are more erroneous when the vulnerability indices are higher amongst the respondents, as in the case of the East Kolkata wetlands. Urban pressures and influences might also be major limiting factors here; this indicates a need for further empirical research in this context.
In informed decision making at community-ecosystem interface, though the significance of perception-based studies on evaluating intangible nature services in providing a societal perspective in differential valuation of ecosystem services by various communities, depending upon their interaction with nature, is crucial, the limitations of such studies like potential bias or lacking in objectivity of the findings might compromise the quality of research output (Wang et al., 2017). Though ecosystem services underpin human wellbeing in socio-ecological production landscapes, they show high spatial heterogeneity, which is reflected in perception-based studies amongst societal actors. These variances probably arise either from varying gradients of environmental determinants shaping the services or because the variances in the gradients do not influence the perceptions of respondents who use these services. Thus, when we compare the vulnerability of communities that are enjoying similar ecosystem services, it shows larger deviation from the mean value (vide Table 2) compared to the determinants like exposure, sensitivity and adaptive capacity. The main limitation that delimits the study arises from the fact that the respondents are not true representatives of the populace; rather, they are always biased by their appreciative perception regarding the services. However, it is imperative that such studies strongly highlight the integrative potential of ecosystem services in decision-making (Thiemann et al., 2022).
5. CONCLUSION
The present study, therefore, necessarily accentuates the relevance of scientific rationale and evidence-based approaches in the pricing of ecosystem services, compared to purely perception-based valuation that seldom filters the bias of societal actors and incorporates spatial variances of the drivers and determinants of these services as well, at the community-ecosystem interface. Especially, in the climate milieu, this study design would be expected to constitute a major decision support mechanism in community-based climate action, sustainable development and inclusive growth. The results and discussions in the above study highlight the nexus of several socio-ecological factors and attributes that determine the value system of pricing ecosystem services with a strong evidence-based rationale. It is now imperative that the same be brought into policy planning protocols, and the required capacities be built for such inclusive planning. In cognisance of that, awareness building in local communities to recognise the importance of ecosystem services and ‘Nature’s Contribution to People’ in alignment with the mandates of IPBES, is also a necessity at the grassroots. This brings into line the emphasis given on equitable access and benefit sharing of the Indigenous people and local communities during the UN Conference of Parties on Conservation of Biodiversity (COP 16, UN CBD) held at Cali, Colombia in 2024. The outcomes would eventually lead to further research and discourse in evolving the valuation methods of pricing ecosystem services, addressing place-based socio-ecological variants more plausibly.
6. ACKNOWLEDGEMENTS
This article is based on work supported by the Asia-Pacific Network for Global Change Research (APN) under Grant No. CBA2020-03MY-Dey. The extended support of Bangabandhu Sheikh Mujibur Rahman Agricultural University, Bangladesh; SMARTS, Asian Institute of Technology, Thailand; and Progyan Foundation for Research and Innovation, India, are also duly acknowledged herein.